AI PPT Maker
Templates
PPT Bundles
Design Services
Business PPTs
Business Plan
Management
Strategy
Introduction PPT
Roadmap
Self Introduction
Timelines
Process
Marketing
Agenda
Technology
Medical
Startup Business Plan
Cyber Security
Dashboards
SWOT
Proposals
Education
Pitch Deck
Digital Marketing
KPIs
Project Management
Product Management
Artificial Intelligence
Target Market
Communication
Supply Chain
Google Slides
Research Services
 One Pagers
All Categories
Decisioning Analytics PowerPoint Presentation Templates and Google Slides
13 Item(s)
Slide 1 of 6
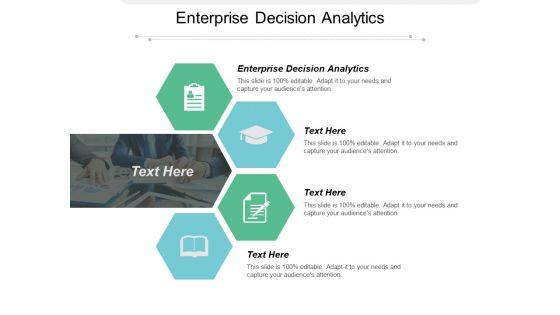
This is a enterprise decision analytics ppt powerpoint presentation file show cpb. This is a four stage process. The stages in this process are enterprise decision analytics.


Slide 1 of 2
This slide illustrates the SAP Analytics Cloud dashboard to monitor product sales performance. It provides information regarding the gross margin and net revenue earned, product performance state wise and year wise. Welcome to our selection of the Budget Plan For BI Technique For Data Informed Decisions Clipart PDF. These are designed to help you showcase your creativity and bring your sphere to life. Planning and Innovation are essential for any business that is just starting out. This collection contains the designs that you need for your everyday presentations. All of our PowerPoints are 100 percent editable, so you can customize them to suit your needs. This multi purpose template can be used in various situations. Grab these presentation templates today.
Slide 1 of 2
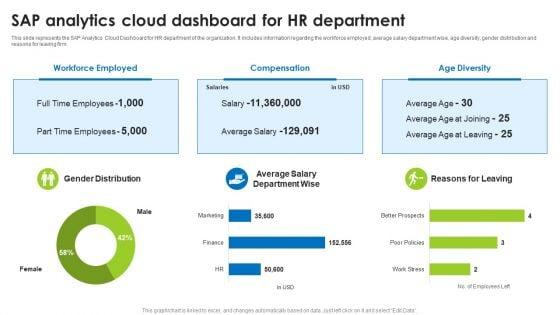
This slide represents the SAP Analytics Cloud Dashboard for HR department of the organization. It includes information regarding the workforce employed, average salary department wise, age diversity, gender distribution and reasons for leaving firm. This modern and well-arranged BI Technique For Data Informed Decisions Sap Analytics Cloud Dashboard For HR Department Background PDF provides lots of creative possibilities. It is very simple to customize and edit with the Powerpoint Software. Just drag and drop your pictures into the shapes. All facets of this template can be edited with Powerpoint no extra software is necessary. Add your own material, put your images in the places assigned for them, adjust the colors, and then you can show your slides to the world, with an animated slide included.


Slide 1 of 2
This slide illustrates the SAP Analytics Cloud dashboard for financial reporting in terms of net revenue, operating profit, cost of goods sold, profitability trend and net revenue by country. It also provides details of net worth of incoming order and order distribution by country. Coming up with a presentation necessitates that the majority of the effort goes into the content and the message you intend to convey. The visuals of a PowerPoint presentation can only be effective if it supplements and supports the story that is being told. Keeping this in mind our experts created BI Technique For Data Informed Decisions Sap Analytics Cloud Dashboard For Financial Reporting Portrait PDF to reduce the time that goes into designing the presentation. This way, you can concentrate on the message while our designers take care of providing you with the right template for the situation.
Slide 1 of 2
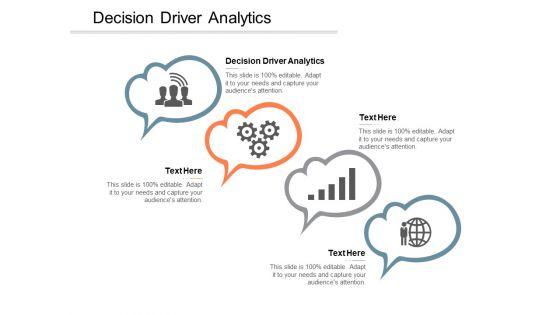
Presenting this set of slides with name decision driver analytics ppt powerpoint presentation styles graphics download cpb. This is an editable Powerpoint four stages graphic that deals with topics like decision driver analytics to help convey your message better graphically. This product is a premium product available for immediate download and is 100 percent editable in Powerpoint. Download this now and use it in your presentations to impress your audience.
Slide 1 of 2
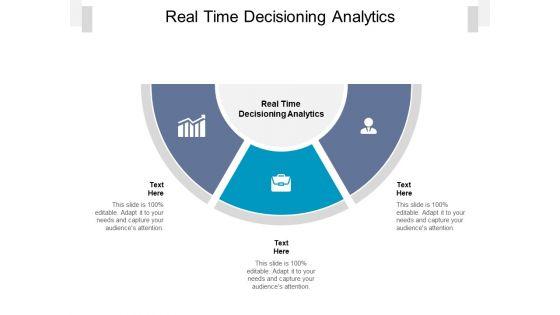
Presenting this set of slides with name real time decisioning analytics ppt powerpoint presentation infographics files cpb pdf. This is an editable Powerpoint three stages graphic that deals with topics like real time decisioning analytics to help convey your message better graphically. This product is a premium product available for immediate download and is 100 percent editable in Powerpoint. Download this now and use it in your presentations to impress your audience.


Slide 1 of 9
The following slide illustrates brief summary of web analytics to drive more traffic and create better user experience. It includes elements such as returning visitors, traffic sources, bounce rate, page views, previews, impressions etc. Slidegeeks has constructed Guide For Marketing Analytics To Improve Decisions Website Analytics Overview For Better User Experience Demonstration PDF after conducting extensive research and examination. These presentation templates are constantly being generated and modified based on user preferences and critiques from editors. Here, you will find the most attractive templates for a range of purposes while taking into account ratings and remarks from users regarding the content. This is an excellent jumping off point to explore our content and will give new users an insight into our top notch PowerPoint Templates.


Slide 1 of 9
The purpose of this slide is to showcase the comparison of SAP Analytics Cloud comparison with other available tools in the market. The comparison is done on multiple parameters such as pricing, core functionalities, and training available. Formulating a presentation can take up a lot of effort and time, so the content and message should always be the primary focus. The visuals of the PowerPoint can enhance the presenters message, so our BI Technique For Data Informed Decisions Sap Analytics Cloud Comparison With Other BI Tools Structure PDF was created to help save time. Instead of worrying about the design, the presenter can concentrate on the message while our designers work on creating the ideal templates for whatever situation is needed. Slidegeeks has experts for everything from amazing designs to valuable content, we have put everything into BI Technique For Data Informed Decisions Sap Analytics Cloud Comparison With Other BI Tools Structure PDF.


Slide 1 of 9
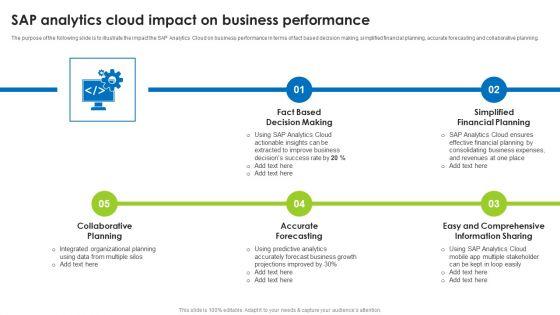
The purpose of the following slide is to illustrate the impact the SAP Analytics Cloud on business performance in terms of fact based decision making, simplified financial planning, accurate forecasting and collaborative planning. Slidegeeks is here to make your presentations a breeze with BI Technique For Data Informed Decisions Sap Analytics Cloud Impact On Business Performance Brochure PDF With our easy to use and customizable templates, you can focus on delivering your ideas rather than worrying about formatting. With a variety of designs to choose from, you are sure to find one that suits your needs. And with animations and unique photos, illustrations, and fonts, you can make your presentation pop. So whether you are giving a sales pitch or presenting to the board, make sure to check out Slidegeeks first.


Slide 1 of 9
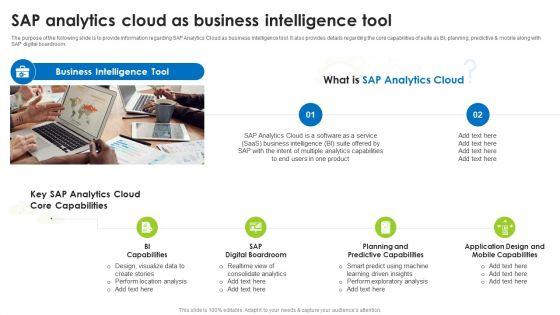
The purpose of the following slide is to provide information regarding SAP Analytics Cloud as business intelligence tool. It also provides details regarding the core capabilities of suite as BI, planning, predictive and mobile along with SAP digital boardroom. Present like a pro with BI Technique For Data Informed Decisions Sap Analytics Cloud As Business Intelligence Tool Graphics PDF Create beautiful presentations together with your team, using our easy to use presentation slides. Share your ideas in real time and make changes on the fly by downloading our templates. So whether you are in the office, on the go, or in a remote location, you can stay in sync with your team and present your ideas with confidence. With Slidegeeks presentation got a whole lot easier. Grab these presentations today.


Slide 1 of 9
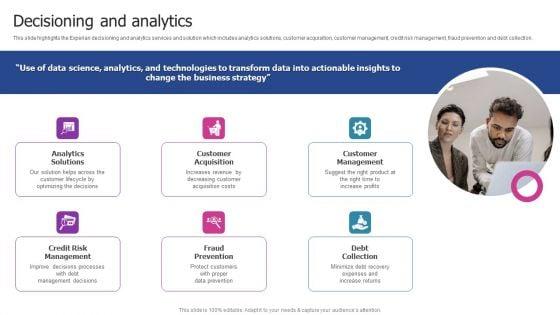
This slide highlights the Experian decisioning and analytics services and solution which includes analytics solutions, customer acquisition, customer management, credit risk management, fraud prevention and debt collection. Want to ace your presentation in front of a live audience Our Experian Company Outline Decisioning And Analytics Inspiration PDF can help you do that by engaging all the users towards you. Slidegeeks experts have put their efforts and expertise into creating these impeccable powerpoint presentations so that you can communicate your ideas clearly. Moreover, all the templates are customizable, and easy to edit and downloadable. Use these for both personal and commercial use.


Slide 1 of 9
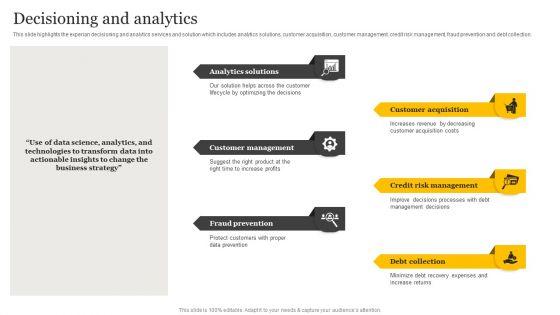
This slide highlights the experian decisioning and analytics services and solution which includes analytics solutions, customer acquisition, customer management, credit risk management, fraud prevention and debt collection. Do you have an important presentation coming up Are you looking for something that will make your presentation stand out from the rest Look no further than Customer Credit Reporting Company Outline Decisioning And Analytics Formats PDF. With our professional designs, you can trust that your presentation will pop and make delivering it a smooth process. And with Slidegeeks, you can trust that your presentation will be unique and memorable. So why wait Grab Customer Credit Reporting Company Outline Decisioning And Analytics Formats PDF today and make your presentation stand out from the rest.


Slide 1 of 9
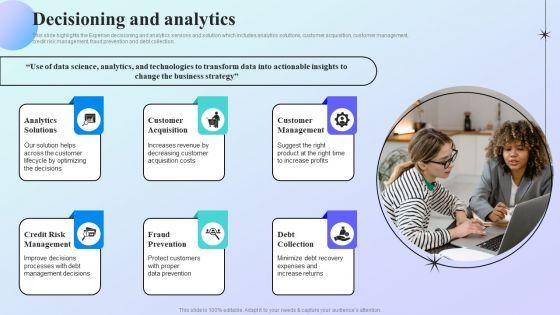
This slide highlights the Experian decisioning and analytics services and solution which includes analytics solutions, customer acquisition, customer management, credit risk management, fraud prevention and debt collection. There are so many reasons you need a Information Analytics Company Outline Decisioning And Analytics Professional PDF. The first reason is you cannot spend time making everything from scratch, Thus, Slidegeeks has made presentation templates for you too. You can easily download these templates from our website easily.
13 Item(s)
