 AI PPT Maker
 Templates
 PPT Bundles
 Design Services
 Business PPTs
 Business Plan
 Management
 Strategy
 Introduction PPT
 Roadmap
 Self Introduction
 Timelines
 Process
 Marketing
 Agenda
 Technology
 Medical
 Startup Business Plan
 Cyber Security
 Dashboards
 SWOT
SWOT Proposals
 Education
 Pitch Deck
 Digital Marketing
 KPIs
KPIs Project Management
 Product Management
 Artificial Intelligence
 Target Market
 Communication
 Supply Chain
 Google Slides
 Research Services
 One Pagers
 All Categories
Effect Diagrams PowerPoint Presentation Templates and Google Slides
SHOW
- 60
- 120
- 180
DISPLAYING: 60 of 116 Item(s)
Page


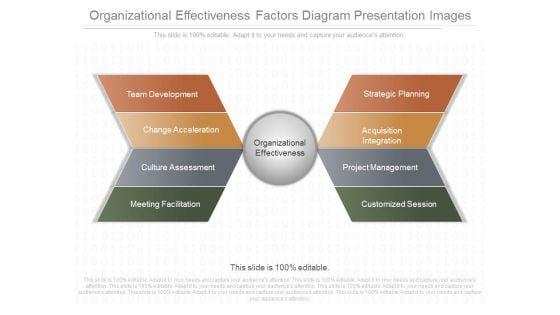


This is a organizational effectiveness factors diagram presentation images. This is a eight stage process. The stages in this process are team development, change acceleration, culture assessment, meeting facilitation, organizational effectiveness, strategic planning, acquisition integration, project management, customized session.


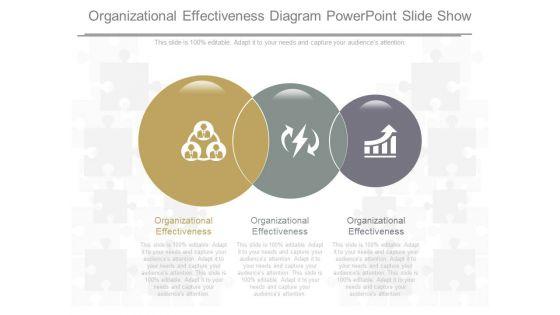
This is a organizational effectiveness vision diagram powerpoint slide show. This is a three stage process. The stages in this process are change management, strategic planning facilitation, retreat workshop facilitation, organization, individual, team, individual coaching, leadership effectiveness, individual development planning, senior team alignment, strategic planning, conflict resolution.


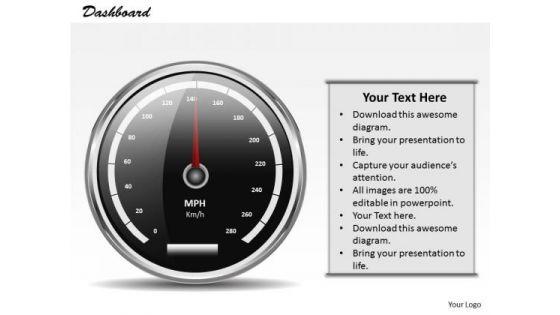

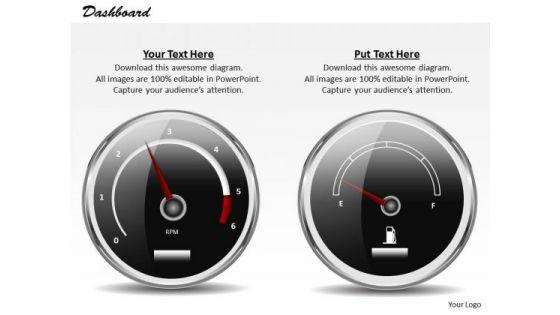
Analyze Ailments On Our Business Diagram Dashboard Design To Communicate Effectively Marketing Diagram Powerpoint Templates. Bring Out The Thinking Doctor In You. Dock Your Thoughts With Our Business Diagram Dashboard Design To Communicate Effectively Marketing Diagram Powerpoint Templates. They Will Launch Them Into Orbit.


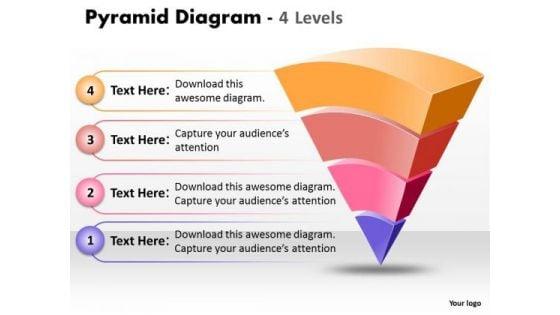
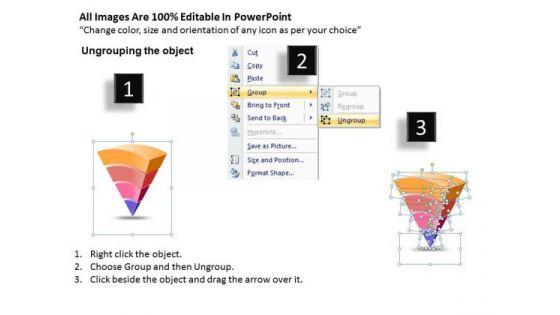
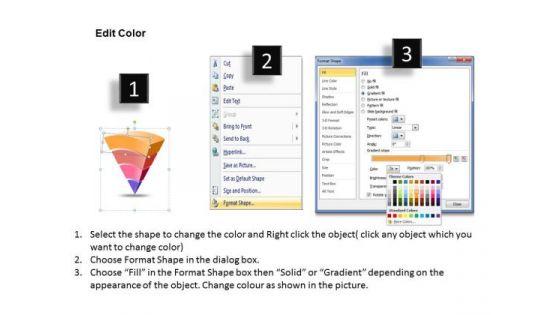
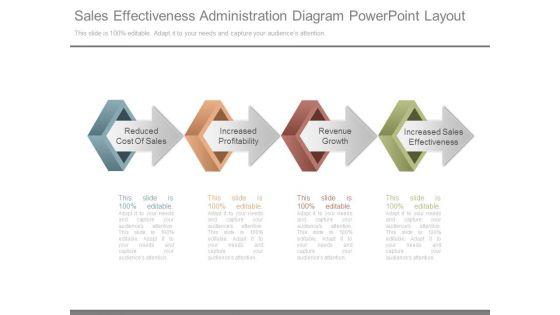
Document Your Views On Our Business Cycle Diagram Reverse Design Triangle With 3D Effect Strategy Diagram Powerpoint Templates. They Will Create A Strong Impression. Plan Your Documentary Shot By Shot. Break Them Down On Our Business Cycle Diagram Reverse Design Triangle With 3D Effect Strategy Diagram Powerpoint Templates.


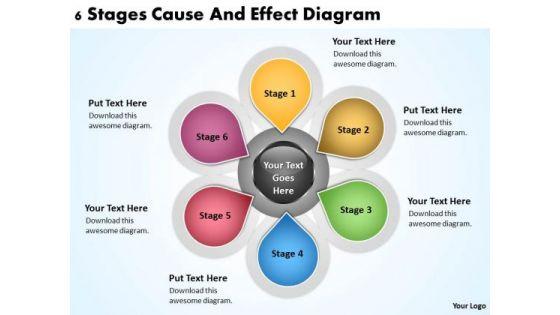


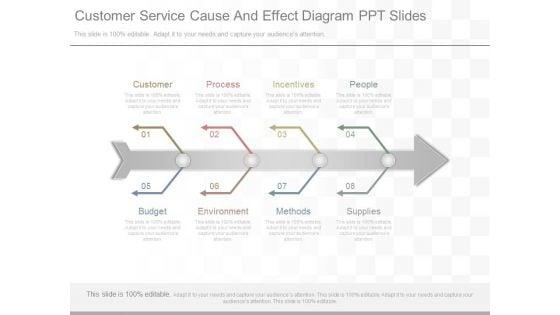
We present our examples of business processes 6 stages cause and effect diagram PowerPoint templates.Use our Circle Charts PowerPoint Templates because you can Set pulses racing with our PowerPoint Templates and Slides. They will raise the expectations of your team. Use our Ring Charts PowerPoint Templates because Our PowerPoint Templates and Slides have the Brilliant backdrops. Guaranteed to illuminate the minds of your audience. Download our Business PowerPoint Templates because Our PowerPoint Templates and Slides are the chords of your song. String them along and provide the lilt to your views. Present our Process and Flows PowerPoint Templates because You can Bask in the warmth of our PowerPoint Templates and Slides. Enjoy the heartfelt glowing response of your listeners. Use our Flow Charts PowerPoint Templates because Watching this your Audience will Grab their eyeballs, they wont even blink.Use these PowerPoint slides for presentations relating to Abstract, arrows, blank, business, central, centralized, chart, circle, circular, circulation, concept, conceptual, converging, design, diagram, empty, executive, five, icon, idea, illustration, management, map, mapping, model, numbers, organization, outwards, pointing, procedure, process, radial, radiating, relationship, resource, sequence, strategy, template. The prominent colors used in the PowerPoint template are Purple, Gray, Black. You have been given an exacting task. Plan your approach with our Examples Of Business Processes 6 Stages Cause And Effect Diagram PowerPoint Templates.


We present our business process flow chart examples 6 stages cause and effect diagram ppt PowerPoint Slides.Use our Marketing PowerPoint Templates because Our PowerPoint Templates and Slides are designed to help you succeed. They have all the ingredients you need. Present our Business PowerPoint Templates because Our PowerPoint Templates and Slides will embellish your thoughts. See them provide the desired motivation to your team. Download our Shapes PowerPoint Templates because Your audience will believe you are the cats whiskers. Download our Circle Charts PowerPoint Templates because Our PowerPoint Templates and Slides will bullet point your ideas. See them fall into place one by one. Use our Signs PowerPoint Templates because Our PowerPoint Templates and Slides will generate and maintain the level of interest you desire. They will create the impression you want to imprint on your audience.Use these PowerPoint slides for presentations relating to Brochure, business, button, catalog, chart, circle, company, cross, data, design, diagram, direction, document, financial, glossy, goals, graph, junction, management, market, marketing, model, multiple, navigation, network, options, pie, plan, presentation, process, results, shiny, six, sphere, statistics, stock, structure, template, vector, website. The prominent colors used in the PowerPoint template are Yellow, Gray, Black. Our Business Process Flow Chart Examples 6 Stages Cause And Effect Diagram Ppt PowerPoint Slides will ensure everyone in the room is impressed. You will be glad you tried us out.

We present our PPT horizontal flow of 6 stage cause and effect diagram PowerPoint template 5 Graphic. Use our Design PowerPoint Templates because, you have made significant headway in this field. Use our Shapes PowerPoint Templates because, are the tools that helped most of us evolve. Use our Business PowerPoint Templates because, Marketing Strategy Business Template: - Maximizing sales of your product is the intended destination. Use our Process and Flows PowerPoint Templates because, However there is a key aspect to be emphasized. Use our Arrows PowerPoint Templates because; in any endeavor people matter most. Use these PowerPoint slides for presentations relating to accent, advertisement, aqua, arrow, blank, business, button, collection, color, decoration, design, direction, element, empty, financial, flow, graph, green, grey, horizontal, instruction, isolated, placard, process, promo, promotion, sale, set, shape, shiny, silver, steps, symbol. The prominent colors used in the PowerPoint template are Blue navy, White, Gray Let the audience experience the beauty of our Ppt Horizontal Flow Of 6 Stage Cause And Effect Diagram PowerPoint Template 5 Graphic. They will be beholden to you.
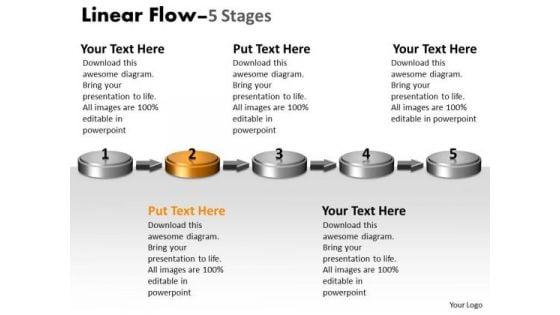
We present our PPT Theme 3d linear flow five steps cause and effect diagram PowerPoint template Graphic. Use our Arrows PowerPoint Templates because, Signpost your preferred roadmap to your eager co- travelers and demonstrate clearly how you intend to navigate them towards the desired corporate goal. Use our Symbol PowerPoint Templates because; Raise your Company stocks at the Opening Bell. Use our Marketing PowerPoint Templates because, you have the process in your head, our template design showing will illuminate your thoughts. Use our Advertising PowerPoint Templates because, Team Efforts Business Template: - The concept and strategy is your strength. Use our Business PowerPoint Templates because, Marketing Strategy Business Template:- Maximizing sales of your product is the intended destination. Use these PowerPoint slides for presentations relating to Arrow, Background, Business, Chart, Diagram, Financial, Graphic, Gray, Icon, Illustration, Management, Perspective, Planning, Process, Stages, Steps, Text. The prominent colors used in the PowerPoint template are Orange, Gray, and Black Our Ppt Theme 3d Linear Flow Five Steps Cause And Effect Diagram PowerPoint Template Graphic encourage economy of effort. Make it easier to bear the burden.
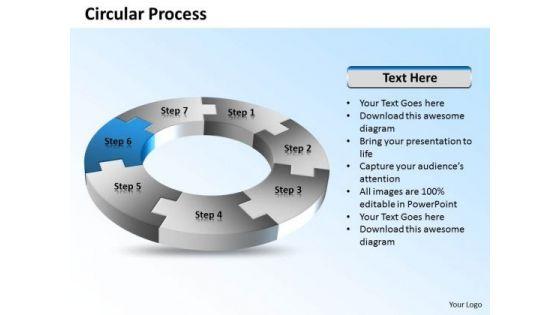
PPT 7 stages circular process flow cause and effect diagram powerpoint template Templates-This diagram can use to examine all of business activities, and see how they're connected. This image has been conceived to enable you to emphatically communicate your ideas that can help you understand the sources of value for your organization. Add charm and personality to your presentations with our stunning high quality PowerPoint Template.-PPT 7 stages circular process flow cause and effect diagram powerpoint template Templates-Arrows, Background, Business, Chart, Circle, Circular, Financial, Flow, Graphic, Gray, Icon, Illustration, Isometric, Perspective, Process, Recycle, Round, Shape, Flow, Marketing, Leadership, Steps Announce plans with our Ppt 7 Stages Circular Process Flow Cause And Effect Diagram PowerPoint Template Templates. You will come out on top.
PPT linear abstraction arrow cause and effect diagram powerpoint template Templates-Use this linear diagram to emphasize the process of your business and corporate growth. Highlight your ideas broad based on strong fundamentals and illustrate how they step by step achieve the set growth factor.-PPT linear abstraction arrow cause and effect diagram powerpoint template Templates-analysis, arrow, background, business, chart, communication, concept, construction, delivery, design, development, engineering, fabrication, feasibiliti, generated, growth, idea, industry, making, production, products, science, sequence, shape Analyse your inputs with our Ppt Linear Abstraction Arrow Cause And Effect Diagram PowerPoint Template Templates. Discover ways to increase your output.
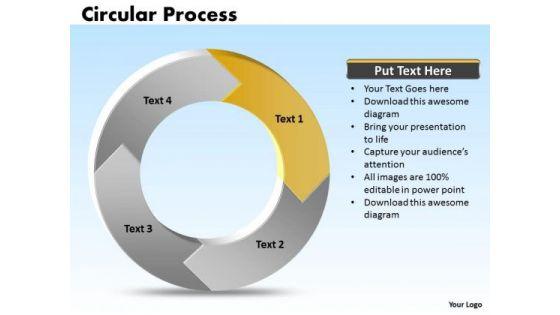
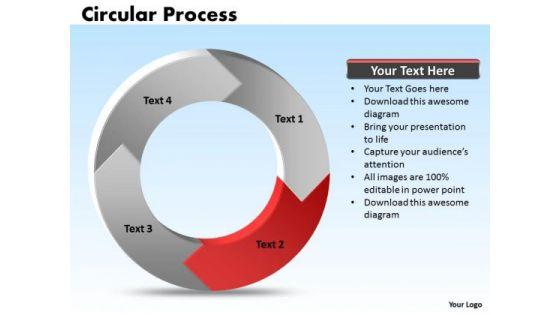
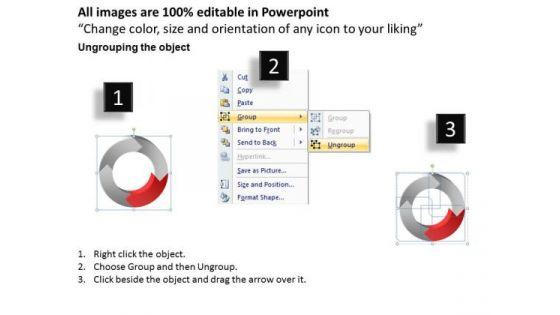
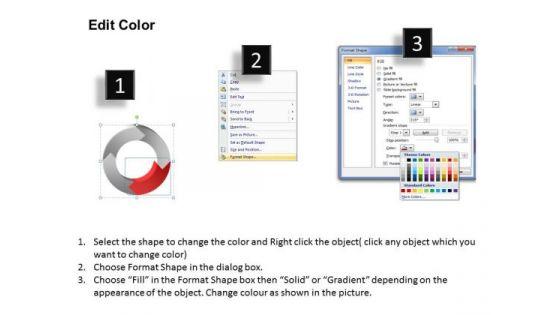
PPT cycle process cause and effect diagram powerpoint template 4 stages Templates-Visually support your Microsoft office PPT Presentation with our above template. This diagram shows the flow of control between activities. You can model the sequential steps in a process with this diagram-PPT cycle process cause and effect diagram powerpoint template 4 stages Templates-Arrow, Chart, Circular Procedure, Color, Colorful, Connect, Connection, Design, Diagram, Finance, Graphic, Group, Growth, Icon, Illustration, Marketing, Pieces, Process, Recycle, Recycling, Round, Set, Strategy, Symbol, Wheel Make it a festival of ideas with our Ppt Cycle Process Cause And Effect Diagram PowerPoint Template 4 Stages Templates. Your audience will be up for a celebration.


PPT components of circular process cause and effect diagram powerpoint template Templates-This circular flow diagram illustrates the economic exchange that takes place in the building of wealth. Adjust the above image in your PPT presentations to visually support your content in your Business PPT slideshows-PPT components of circular process cause and effect diagram powerpoint template Templates-Arrow, Chart, Circular, Color, Colorful, Connect, Connection, Design, Diagram, Finance, Graphic, Group, Growth, Icon, Illustration, Marketing, Pieces, Process, Recycle, Recycling, Round, Set, Strategy, Symbol, Wheel Our Ppt Components Of Circular Process Cause And Effect Diagram PowerPoint Template Templates will become an extension of you. They will get in character with your thoughts.
PPT 4 stages process cycle cause and effect diagram powerpoint template Templates-This process cycle cause and effect diagram is an outstanding communication tool. Use this structured, systematic, compartmentalized layout to evaluate the causes of a particular effect. Steal the affection of your audience. Our Ppt 4 Stages Process Cycle Cause And Effect Diagram PowerPoint Template Templates will abet you in the crime.
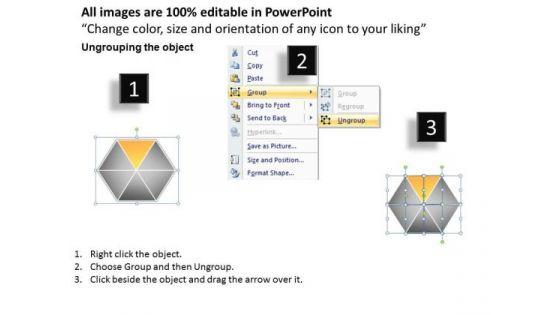

PPT yellow factor hexagon cause and effect diagram PowerPoint template editable Templates-Create visually stimulating Microsoft office PPT Presentations with our above Diagram. This image has been professionally designed to emphasize the concept of interrelated issues, Approaches or Methods. This Business Diagram can be used in Marketing, Banking, and Management etc. This Diagram explains the Yellow Component.-PPT yellow factor hexagon cause and effect diagram PowerPoint template editable Templates-attached, backgrounds, blue, cell, color, component, connect, connection, diagram, elements, geometric, graphic, group, hexagon, honeycomb, icon, illustration, intricacy, lines, link, map, mesh, model, network, science, shape, shiny, strategy, structure, symbol, teamwork, technology Watch your plans fall into place. Our Ppt Yellow Factor Hexagon Cause And Effect Diagram PowerPoint Template Editable Templates aid in completion.

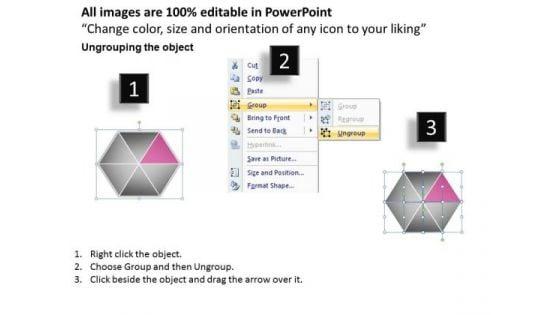
PPT pink factor hexagon cause and effect diagram PowerPoint template editable Templates-The Diagram offers an excellent background to build up the various stages of your business process. This PowerPoint Process Chart shows the seven Different Layers which are to be followed in any business. This Business Diagram can be used in Marketing, Banking, and Management etc. -PPT pink factor hexagon cause and effect diagram PowerPoint template editable Templates-attached, backgrounds, blue, cell, color, component, connect, connection, diagram, elements, geometric, graphic, group, hexagon, honeycomb, icon, illustration, intricacy, lines, link, map, mesh, model, network, science, shape, shiny, strategy, structure, symbol, teamwork, technology Dwell on your exploits with our Ppt Pink Factor Hexagon Cause And Effect Diagram PowerPoint Template Editable Templates. Bring out the courage of your actions.
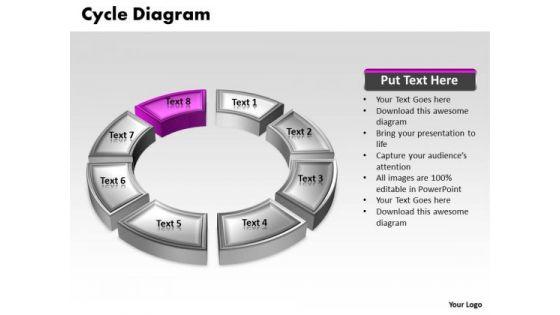


PPT pink animated text cycle cause and effect diagram powerpoint template Templates-This Eight Way Round chart Diagram is an effective way of displaying Interconnected information. You can edit text, color, shade and style as per you need.-PPT pink animated text cycle cause and effect diagram powerpoint template Templates-Abstract, Blank, Business, Chart, Circular, Circulation, Cycle, Design, Diagram, Empty, Executive, Icon, Illustration, Management, Model, Numbers, Organization, Procedure, Process Our Ppt Pink Animated Text Cycle Cause And Effect Diagram PowerPoint Template Templates has been designed by professionals. Use them to string together your glistening ideas.


PPT blue animated multicolor cycle cause and effect diagram powerpoint template Templates-This PowerPoint Diagram shows the blue piece out of all connected pieces to describe the part of the process in Linear Flow. It signifies Round, circular, beeline, continuous, even, horizontal, linear, nonstop, right, shortest, though, true, unbroken etc.-PPT blue animated multicolor cycle cause and effect diagram powerpoint template Templates-Abstract, Blank, Business, Chart, Circular, Circulation, Cycle, Design, Diagram, Empty, Executive, Icon, Illustration, Management, Model, Numbers, Organization, Procedure, Process Our Ppt Blue Animated Multicolor Cycle Cause And Effect Diagram PowerPoint Template Templates stay faithful to their word. They stand by any promise they make.
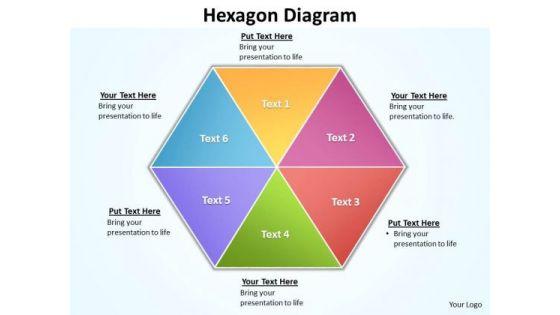
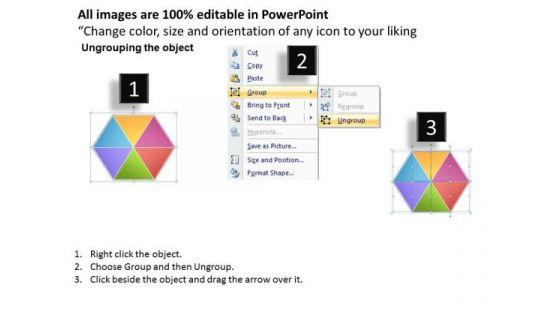

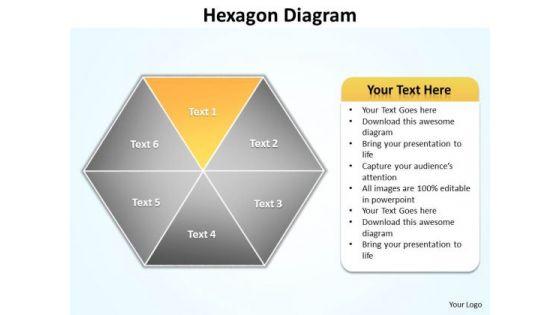
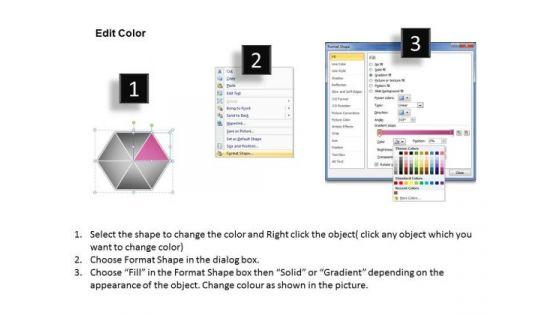
PPT 6 factors hexagon cause and effect diagram powerpoint template editable Templates-This Business PowerPoint Diagram shows you the regular Hexagon describing six issues in one particular slide of Presentation. It symbolizes six-pointed star, Jewish star, Star of Bethlehem, stile, hexagon, hexagram and hexahedron.-PPT 6 factors hexagon cause and effect diagram powerpoint template editable Templates-Abstract, Background, Design, Digital, Elements, Graphic, Grey, Hexagon, Illustration, Light, Modern, Perspective, Triangles, Shapes, Shiny, Style, Technology, Template, Vector, Vertical, Virtual, Wallpaper, Web Camp in success land with our Ppt 6 Factors Hexagon Cause And Effect Diagram PowerPoint Template Editable Templates. You will come out on top.

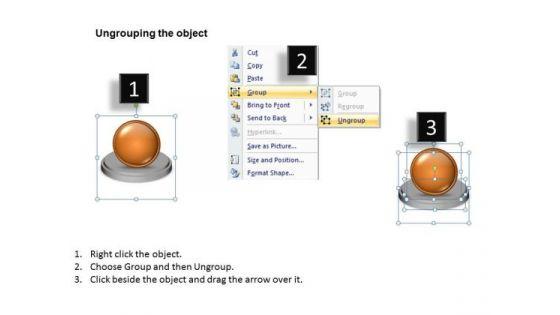
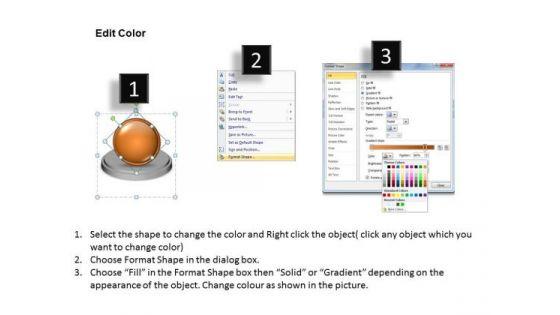
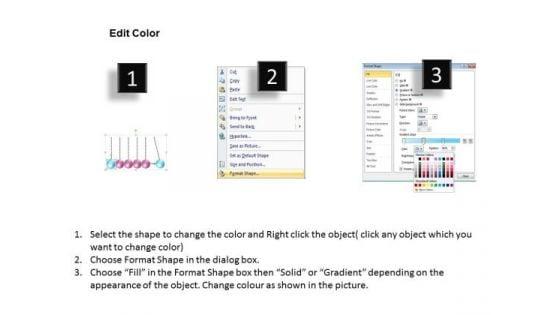
PPT sphere cause and effect diagram powerpoint template 2 state Templates-This PPT slide can be used to compare two approaches and evaluate the effectiveness. You can easily insert text to this slide as per your requirement.-PPT sphere cause and effect diagram powerpoint template 2 state Templates-Around, Background, Ball, Big, Blue, Business, Circle, Competition, Competitive, Concept, Contrast, Design, Development, Diagram, Group, Icon, Illustration, Individual, Individuality, Isolated, Leadership, Partnership, Ring, Shapes, Sign, Sphere, Success, Symbol, Team, Teamwork, Wheel Compare products and services with our Ppt Sphere Cause And Effect Diagram PowerPoint Template 2 State Templates. You will come out on top.
PPT chevron cause and effect diagram powerpoint template Templates--PowerPoint presentations on Arrow, Background, Bullet, Business, Chart, Checkmark, Chevron, Diagram, Drop, Eps10, Financial, Glass, Graphic, Gray, Icon, Illustration, Isometric, Management, Orange, Perspective, Placeholder, Point, Process, Project, Reflection, Set, Shadow, Silver, Stage, Text, Three, Transparency, White-PPT chevron cause and effect diagram powerpoint template Templates Achieve cross-functional team leadership with our Ppt Chevron Cause And Effect Diagram PowerPoint Template Templates. They will make you look good.

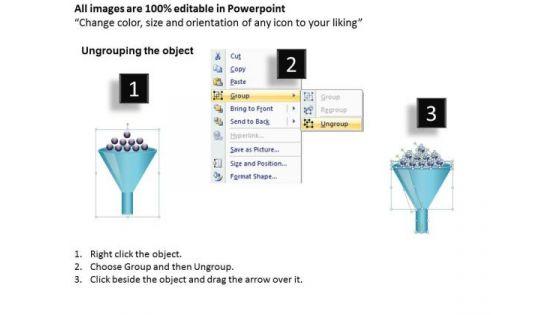

PPT funnel cause and effect diagram powerpoint template editable Templates-This Funnel based PowerPoint Diagram signifies adulteration, contamination, corruption, defilement, dirt, filth, foreign matter, grime, pestilence, poisoning, pollutant, pollution, scum, stain, taint, uncleanness.-PPT funnel cause and effect diagram powerpoint template editable Templates Get rid of banality with our Ppt Funnel Cause And Effect Diagram PowerPoint Template Editable Templates. Take any boredom out of the equation.

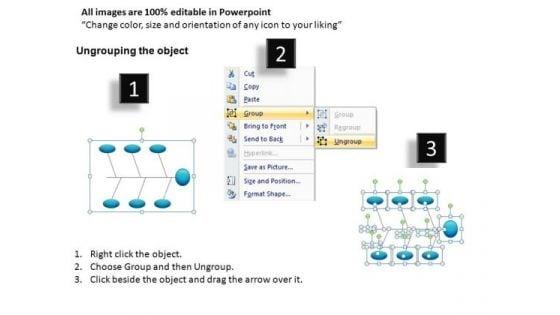

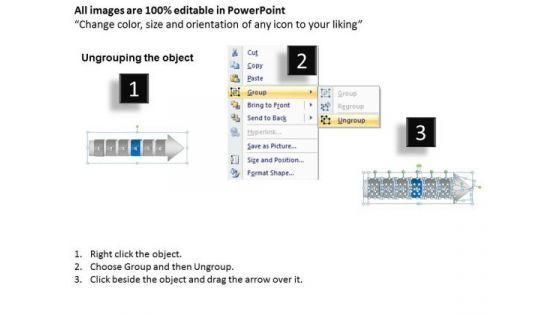
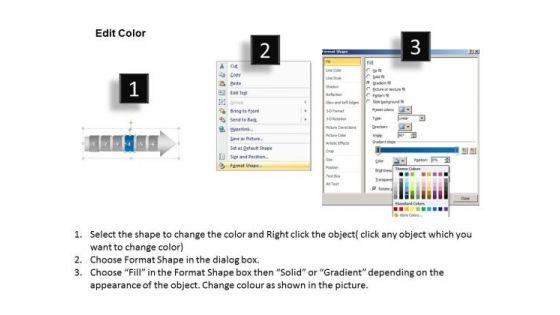
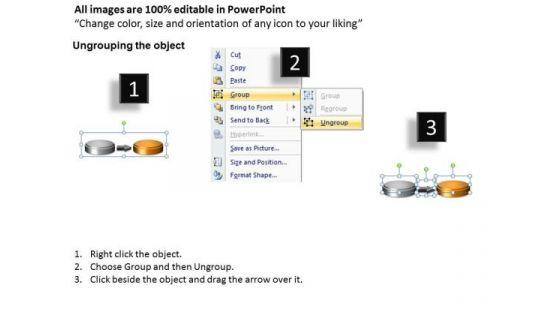
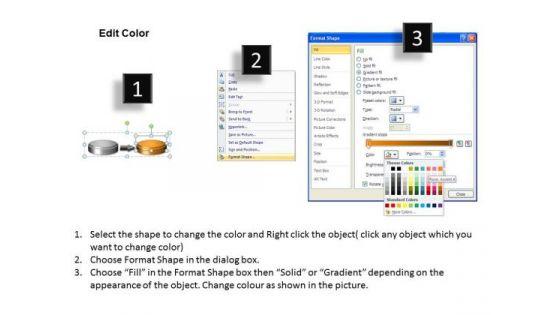
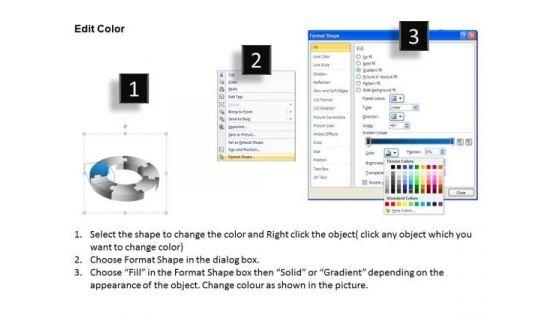
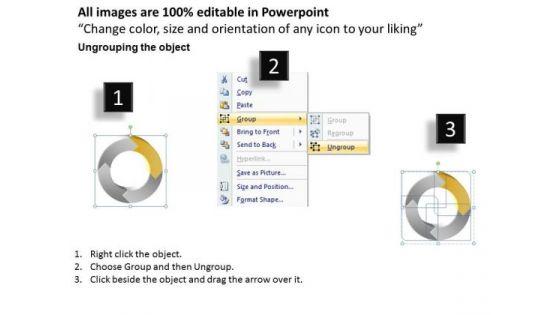
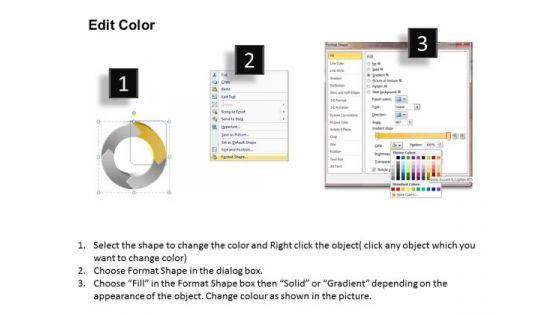
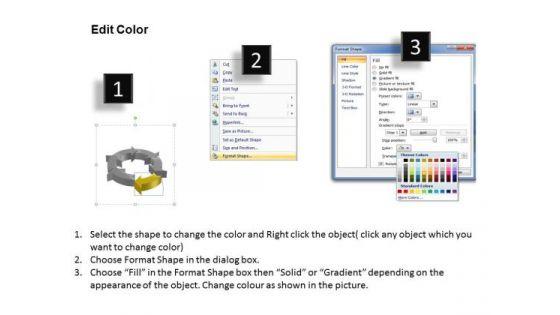
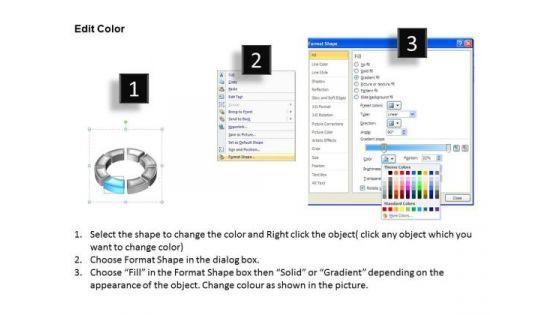
PPT Slide Cause and Effect Diagram-These high quality powerpoint pre-designed slides and powerpoint templates have been carefully created by our professional team to help you impress your audience. All slides have been created and are 100% editable in powerpoint. Each and every property of any graphic - color, size, orientation, shading, outline etc. can be modified to help you build an effective powerpoint presentation. Any text can be entered at any point in the powerpoint template or slide. Simply DOWNLOAD, TYPE and PRESENT!These PowerPoint Presentation slides can be used for themes relating to--Arrow, cause, defect, deficiency, diagram, document, effect, envelope, environment, fishbone, flow, industry, kahashiwara, machine, manufacture, material, paper, pencil, safety, sketch Applaud your achievements with our Ppt Slide Cause And Effect Diagram. You will come out on top.
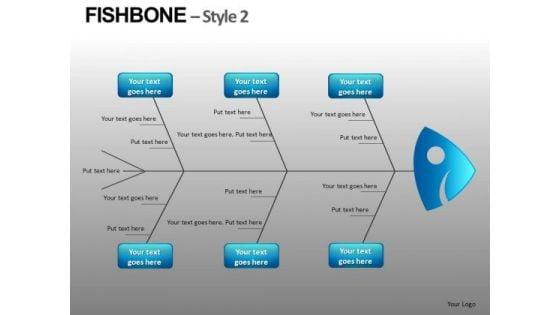
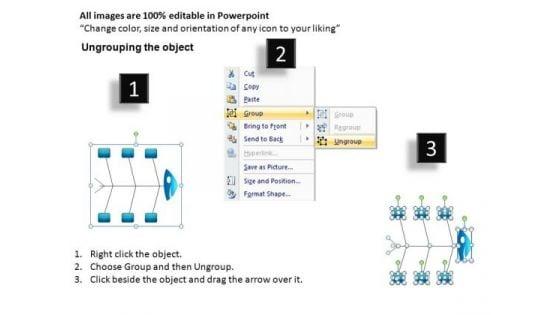

Download Cause and Effect FishBone Diagram Editable PowerPoint Slides-These high quality powerpoint pre-designed slides and powerpoint templates have been carefully created by our professional team to help you impress your audience. All slides have been created and are 100% editable in powerpoint. Each and every property of any graphic - color, size, orientation, shading, outline etc. can be modified to help you build an effective powerpoint presentation. Any text can be entered at any point in the powerpoint template or slide. Simply DOWNLOAD, TYPE and PRESENT!These PowerPoint Presentation slides can be used for themes relating to--Arrow, cause, defect, deficiency, diagram, document, effect, envelope, environment, fishbone, flow, industry, kahashiwara, machine, manufacture, material, paper, pencil, safety, sketch Anything extra always attracts. Our Download Cause And Effect Fishbone Diagram Editable PowerPoint Slides will leave you absolutely delighted.


Cause and Effect Ishikawa Diagram PowerPoint templates PPT Slides Download-These high quality powerpoint pre-designed slides and powerpoint templates have been carefully created by our professional team to help you impress your audience. All slides have been created and are 100% editable in powerpoint. Each and every property of any graphic - color, size, orientation, shading, outline etc. can be modified to help you build an effective powerpoint presentation. Any text can be entered at any point in the powerpoint template or slide. Simply DOWNLOAD, TYPE and PRESENT!These PowerPoint Presentation slides can be used for themes relating to--Arrow, cause, defect, deficiency, diagram, document, effect, envelope, environment, fishbone, flow, industry, kahashiwara, machine, manufacture, material, paper, pencil, safety, sketch Monitor plans with our Cause And Effect Ishikawa Diagram PowerPoint Templates Ppt Slides Download. Download without worries with our money back guaranteee.


Cause and Effect FishBone Diagram PowerPoint Slides Editable PPT Templates-These high quality powerpoint pre-designed slides and powerpoint templates have been carefully created by our professional team to help you impress your audience. All slides have been created and are 100% editable in powerpoint. Each and every property of any graphic - color, size, orientation, shading, outline etc. can be modified to help you build an effective powerpoint presentation. Any text can be entered at any point in the powerpoint template or slide. Simply DOWNLOAD, TYPE and PRESENT!These PowerPoint Presentation slides can be used for themes relating to--Arrow, cause, defect, deficiency, diagram, document, effect, envelope, environment, fishbone, flow, industry, kahashiwara, machine, manufacture, material, paper, pencil, safety, sketch Coach subordinates with our Cause And Effect Fishbone Diagram PowerPoint Slides Editable Ppt Templates. Download without worries with our money back guaranteee.


This slide represents the principles of linked data, such as using uniform resource identifier names, utilizing HTTP URIs for identification, standards to deliver information to users, and adding links of other uniform resource identifiers.If your project calls for a presentation, then Slidegeeks is your go-to partner because we have professionally designed, easy-to-edit templates that are perfect for any presentation. After downloading, you can easily edit Principles Of Linked Data System Integrating Linked Data To Enhance Operational Effectiveness Diagrams PDF and make the changes accordingly. You can rearrange slides or fill them with different images. Check out all the handy templates.


This slide shows the retail analytics dashboard to measure merchandise planning effectiveness which includes conversion rate, sell through rate, return on investment, website traffic, abandonment rate, etc. Are you searching for a Retail Analytics Dashboard To Measure Merchandise Planning Effectiveness Diagrams PDF that is uncluttered, straightforward, and original Its easy to edit, and you can change the colors to suit your personal or business branding. For a presentation that expresses how much effort you have put in, this template is ideal With all of its features, including tables, diagrams, statistics, and lists, its perfect for a business plan presentation. Make your ideas more appealing with these professional slides. Download Retail Analytics Dashboard To Measure Merchandise Planning Effectiveness Diagrams PDF from Slidegeeks today.


This slide covers quality risk management tool such as Cause or effect diagram. Deliver an awe inspiring pitch with this creative QRM Cause Effect Diagram Risk Management Tool Ppt Infographics Rules PDF bundle. Topics like Raw Materials, Granulatior, Compressing can be discussed with this completely editable template. It is available for immediate download depending on the needs and requirements of the user.
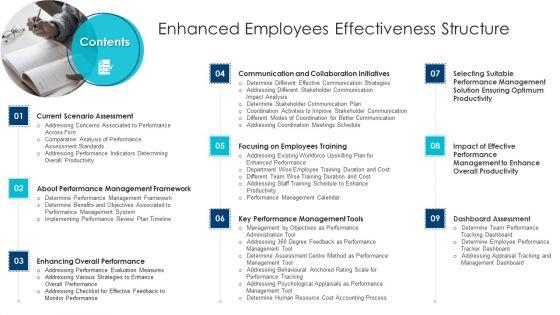
Presenting Contents Enhanced Employees Effectiveness Structure Diagrams PDF to provide visual cues and insights. Share and navigate important information on nine stages that need your due attention. This template can be used to pitch topics like Management Framework, Scenario Assessment, Overall Performance. In addtion, this PPT design contains high resolution images, graphics, etc, that are easily editable and available for immediate download.
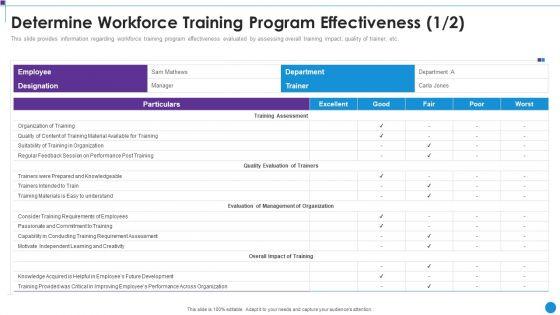

This slide provides information regarding workforce training program effectiveness evaluated by assessing overall training impact, quality of trainer, etc. Deliver and pitch your topic in the best possible manner with this Personnel Training Playbook Determine Workforce Training Program Effectiveness Diagrams PDF. Use them to share invaluable insights on Employee Department Particulars, Quality Evaluation Trainers, Evaluation Management Organization and impress your audience. This template can be altered and modified as per your expectations. So, grab it now.
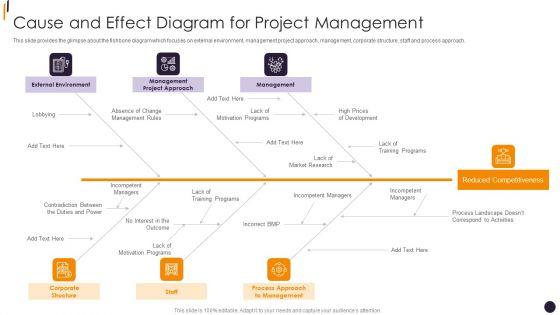
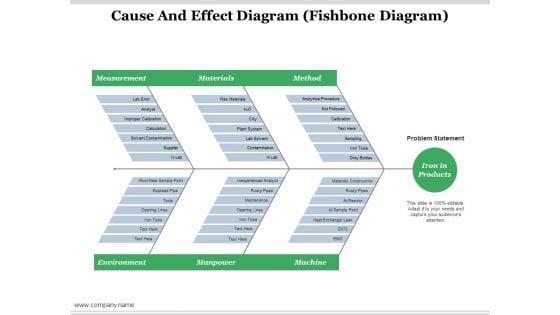
This slide provides the glimpse about the fishbone diagram which focuses on external environment, management project approach, management, corporate structure, staff and process approach.Introducing our well designed PMP Tools Cause And Effect Diagram For Project Management Introduction PDF set of slides. The slide displays editable icons to enhance your visual presentation. The icons can be edited easily. So customize according to your business to achieve a creative edge. Download and share it with your audience.
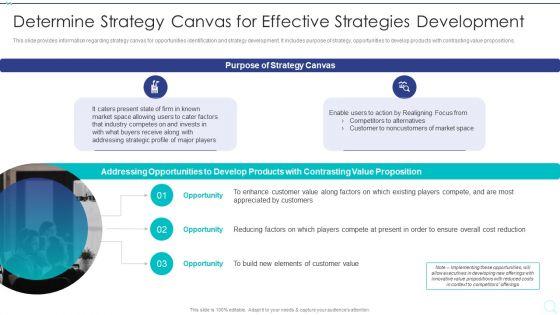

This slide provides information regarding strategy canvas for opportunities identification and strategy development. It includes purpose of strategy, opportunities to develop products with contrasting value propositions. This is a Strategy Implementation Playbook Determine Strategy Canvas For Effective Diagrams PDF template with various stages. Focus and dispense information on three stages using this creative set, that comes with editable features. It contains large content boxes to add your information on topics like Addressing Opportunities, Contrasting Value Proposition, Enhance Customer You can also showcase facts, figures, and other relevant content using this PPT layout. Grab it now.
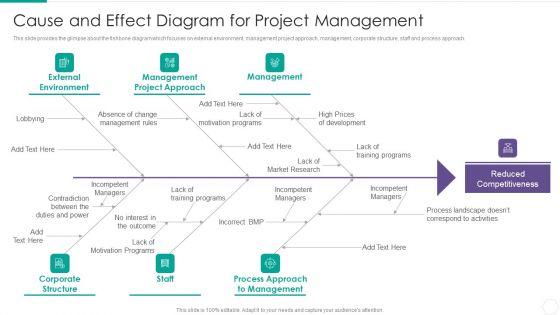

This slide provides the glimpse about the fishbone diagram which focuses on external environment, management project approach, management, corporate structure, staff and process approach. This is a Quantitative Risk Assessment Cause And Effect Diagram For Project Management Rules PDF template with various stages. Focus and dispense information on six stages using this creative set, that comes with editable features. It contains large content boxes to add your information on topics like Management, External Environment, Corporate Structure, Market. You can also showcase facts, figures, and other relevant content using this PPT layout. Grab it now.
SHOW
- 60
- 120
- 180
DISPLAYING: 60 of 116 Item(s)
Page