- Sign up
- Sign In
 AI PPT Maker
 Templates
 PPT Bundles
 Design Services
 Business PPTs
 Business Plan
 Management
 Strategy
 Introduction PPT
 Roadmap
 Self Introduction
 Timelines
 Process
 Marketing
 Agenda
 Technology
 Medical
 Startup Business Plan
 Cyber Security
 Dashboards
 SWOT
SWOT Proposals
 Education
 Pitch Deck
 Digital Marketing
 KPIs
KPIs Project Management
 Product Management
 Artificial Intelligence
 Target Market
 Communication
 Supply Chain
 Google Slides
 Research Services
 One Pagers
 All Categories
Efficiency graph PowerPoint Presentation Templates and Google Slides
SHOW
- 60
- 120
- 180
DISPLAYING: 60 of 82 Item(s)
Page
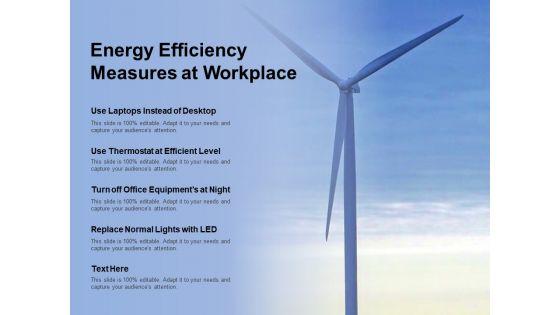

Presenting this set of slides with name energy efficiency measures at workplace ppt powerpoint presentation professional graphic images. The topics discussed in these slides are energy efficiency, energy comparison, electricity. This is a completely editable PowerPoint presentation and is available for immediate download. Download now and impress your audience.
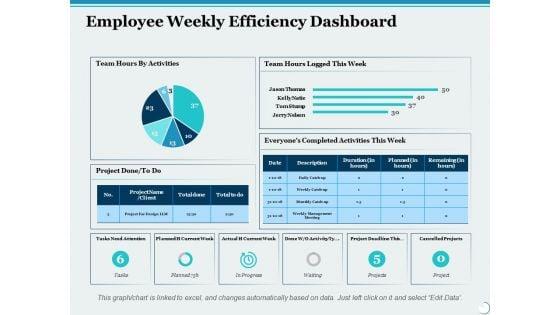

Employee Weekly Efficiency Dashboard Ppt PowerPoint Presentation Infographic Template Graphic Images
This is a employee weekly efficiency dashboard ppt powerpoint presentation infographic template graphic images. This is a six stage process. The stages in this process are percentage, product, business, management, marketing.
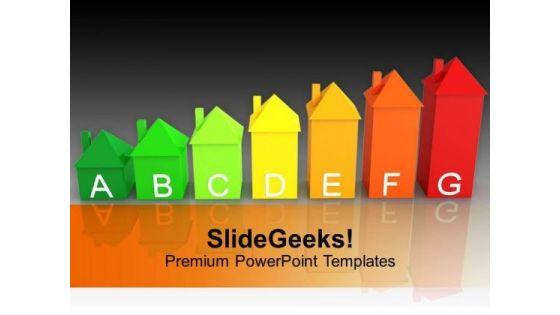
We present our Energy Efficiency In Home Bar Graph PowerPoint Templates PPT Backgrounds For Slides 0113.Use our Business PowerPoint Templates because It will Strengthen your hand with your thoughts. They have all the aces you need to win the day. Present our Sales PowerPoint Templates because Our PowerPoint Templates and Slides offer you the needful to organise your thoughts. Use them to list out your views in a logical sequence. Download and present our Marketing PowerPoint Templates because You can Channelise the thoughts of your team with our PowerPoint Templates and Slides. Urge them to focus on the goals you have set. Present our Finance PowerPoint Templates because You can Hit the nail on the head with our PowerPoint Templates and Slides. Embed your ideas in the minds of your audience. Present our Success PowerPoint Templates because You can Connect the dots. Fan expectations as the whole picture emerges.Use these PowerPoint slides for presentations relating to Energy efficiency as a bar graph made of symbolic houses, business, sale, marketing, finance, success. The prominent colors used in the PowerPoint template are Green, Yellow, Red. PowerPoint presentation experts tell us our Energy Efficiency In Home Bar Graph PowerPoint Templates PPT Backgrounds For Slides 0113 are readymade to fit into any presentation structure. Use our as PowerPoint templates and PPT Slides are effectively colour coded to prioritise your plans They automatically highlight the sequence of events you desire. People tell us our Energy Efficiency In Home Bar Graph PowerPoint Templates PPT Backgrounds For Slides 0113 will generate and maintain the level of interest you desire. They will create the impression you want to imprint on your audience. The feedback we get is that our symbolic PowerPoint templates and PPT Slides help you meet deadlines which are an element of today's workplace. Just browse and pick the slides that appeal to your intuitive senses. Professionals tell us our Energy Efficiency In Home Bar Graph PowerPoint Templates PPT Backgrounds For Slides 0113 are designed by a team of presentation professionals. Presenters tell us our of PowerPoint templates and PPT Slides are readymade to fit into any presentation structure. Our Energy Efficiency In Home Bar Graph PowerPoint Templates Ppt Backgrounds For Slides 0113 make a delicious offering. The audience will be drooling for more.


The following slide showcases he employees productivity and efficiency graph for last years which shows that employees productivity has declined during this time period because of lack of training programs and high attrition rate. Make sure to capture your audiences attention in your business displays with our gratis customizable Corporate Training Program Employee Productivity And Efficiency Graph For Last 5 Years Elements PDF. These are great for business strategies, office conferences, capital raising or task suggestions. If you desire to acquire more customers for your tech business and ensure they stay satisfied, create your own sales presentation with these plain slides.
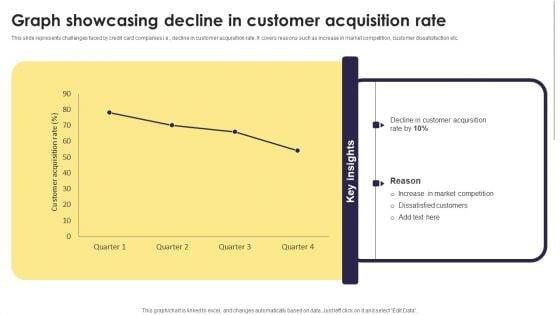
This slide represents challenges faced by credit card companies i.e., decline in customer acquisition rate. It covers reasons such as increase in market competition, customer dissatisfaction etc. Are you in need of a template that can accommodate all of your creative concepts This one is crafted professionally and can be altered to fit any style. Use it with Google Slides or PowerPoint. Include striking photographs, symbols, depictions, and other visuals. Fill, move around, or remove text boxes as desired. Test out color palettes and font mixtures. Edit and save your work, or work with colleagues. Download Implementation Of An Efficient Credit Card Promotion Plan Graph Showcasing Decline In Customer Themes PDF and observe how to make your presentation outstanding. Give an impeccable presentation to your group and make your presentation unforgettable.


The following slide showcases he employees productivity and efficiency graph for last years which shows that employees productivity has declined during this time period because of lack of training programs and high attrition rate. Whether you have daily or monthly meetings, a brilliant presentation is necessary. Business Development Program Employee Productivity And Efficiency Graph For Last 5 Years Ideas PDF can be your best option for delivering a presentation. Represent everything in detail using Business Development Program Employee Productivity And Efficiency Graph For Last 5 Years Ideas PDF and make yourself stand out in meetings. The template is versatile and follows a structure that will cater to your requirements. All the templates prepared by Slidegeeks are easy to download and edit. Our research experts have taken care of the corporate themes as well. So, give it a try and see the results.

The following slide showcases he employees productivity and efficiency graph for last years which shows that employees productivity has declined during this time period because of lack of training programs and high attrition rate. Do you know about Slidesgeeks Employee Training And Development Strategy Employee Productivity And Efficiency Graph For Last 5 Years Graphics PDF These are perfect for delivering any kind od presentation. Using it, create PowerPoint presentations that communicate your ideas and engage audiences. Save time and effort by using our pre designed presentation templates that are perfect for a wide range of topic. Our vast selection of designs covers a range of styles, from creative to business, and are all highly customizable and easy to edit. Download as a PowerPoint template or use them as Google Slides themes.
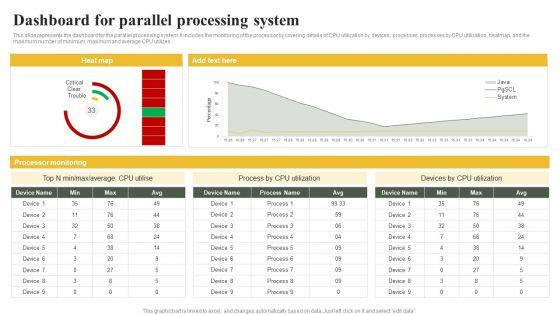
This slide represents the dashboard for the parallel processing system. It includes the monitoring of the processor by covering details of CPU utilization by devices, processes, processes by CPU utilization, heatmap, and the maximum number of minimum, maximum and average CPU utilizes.Create an editable Parallel Computing System To Enhance Process Efficiency Dashboard For Parallel Processing System Graphics PDF that communicates your idea and engages your audience. Whether you are presenting a business or an educational presentation, pre-designed presentation templates help save time. Parallel Computing System To Enhance Process Efficiency Dashboard For Parallel Processing System Graphics PDF is highly customizable and very easy to edit, covering many different styles from creative to business presentations. Slidegeeks has creative team members who have crafted amazing templates. So, go and get them without any delay.


The following slide outlines the key benefits which the organization will get after implementing automation in the customer support department. Information covered in this slide is related to agent productivity, improved customer satisfaction, reduced customer service costs and response time optimization. Deliver an awe inspiring pitch with this creative Major Benefits Of Automated Customer Service Achieving Operational Efficiency Graphics PDF bundle. Topics like Customer Satisfaction, Automated Response, Customer Queries can be discussed with this completely editable template. It is available for immediate download depending on the needs and requirements of the user.


The following slide outlines a comprehensive dashboard depicting the business process automation BPA results in the supply chain. Information covered in the slide is related to average order processing days, average shipping days, etc.Deliver and pitch your topic in the best possible manner with this KPI Dashboard Highlighting Automation Results In Supply Achieving Operational Efficiency Graphics PDF. Use them to share invaluable insights on Orders Progress, Late Deliveries, Deliveries Warehouse and impress your audience. This template can be altered and modified as per your expectations. So, grab it now.
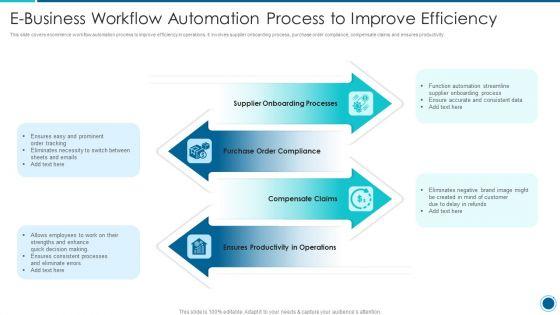
This slide covers ecommerce workflow automation process to improve efficiency in operations. It involves supplier onboarding process, purchase order compliance, compensate claims and ensures productivity. Presenting E Business Workflow Automation Process To Improve Efficiency Graphics PDF to dispense important information. This template comprises four stages. It also presents valuable insights into the topics including Purchase Order Compliance, Supplier Onboarding Processes, Compensate Claims. This is a completely customizable PowerPoint theme that can be put to use immediately. So, download it and address the topic impactfully.
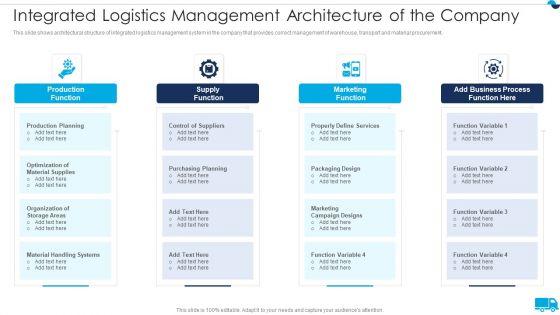

This slide shows architectural structure of integrated logistics management system in the company that provides correct management of warehouse, transport and material procurement. Presenting Strategies For Integrated Logistics Management Enhancing Order Efficiency Integrated Logistics Management Graphics PDF to provide visual cues and insights. Share and navigate important information on four stages that need your due attention. This template can be used to pitch topics like Production Function, Supply Function, Marketing Function In addtion, this PPT design contains high resolution images, graphics, etc, that are easily editable and available for immediate download.
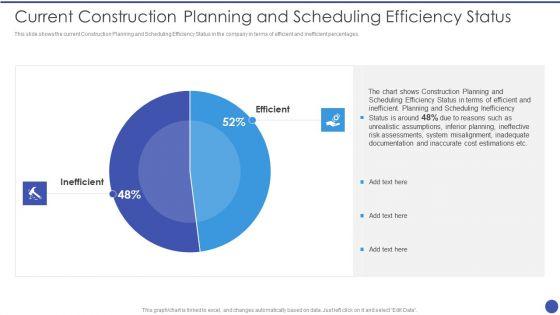
This slide shows the current Construction Planning and Scheduling Efficiency Status in the company in terms of efficient and inefficient percentages. Deliver an awe inspiring pitch with this creative Management Techniques Current Construction Planning And Scheduling Efficiency Status Graphics PDF bundle. Topics like Construction Planning And Scheduling Efficiency, Inadequate Documentation, Inaccurate Cost Estimations, Efficient can be discussed with this completely editable template. It is available for immediate download depending on the needs and requirements of the user.


This slide focuses on different product development methodologies which includes methodology such as waterfall, agile and hybrid with description, pros, cons and other comments. Deliver and pitch your topic in the best possible manner with this Deliver Efficiency Innovation Different Product Development Methodologies Graphics PDF. Use them to share invaluable insights on Methodology, Agile, Pros, Cons, Other Comments and impress your audience. This template can be altered and modified as per your expectations. So, grab it now.
Persuade your audience using this Project Team Efficiency Status Graph Icon Diagrams PDF. This PPT design covers three stages, thus making it a great tool to use. It also caters to a variety of topics including Project Team Efficiency Status Graph Icon. Download this PPT design now to present a convincing pitch that not only emphasizes the topic but also showcases your presentation skills.
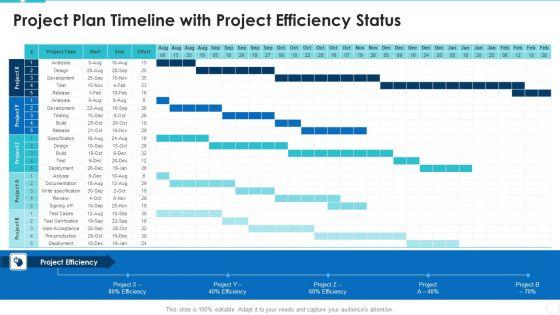
Showcasing this set of slides titled Project Plan Timeline With Project Efficiency Status Graphics PDF. The topics addressed in these templates are Development, Design, Analysis. All the content presented in this PPT design is completely editable. Download it and make adjustments in color, background, font etc. as per your unique business setting.
Persuade your audience using this Project Efficiency Status Dashboard Icon With Graphs And Charts Demonstration PDF. This PPT design covers three stages, thus making it a great tool to use. It also caters to a variety of topics including Project Efficiency Status Dashboard Icon WITH Graphs AND Charts. Download this PPT design now to present a convincing pitch that not only emphasizes the topic but also showcases your presentation skills.

Showcasing this set of slides titled project activity efficiency and coordination graph microsoft pdf. The topics addressed in these templates are project activity efficiency and coordination graph. All the content presented in this PPT design is completely editable. Download it and make adjustments in color, background, font etc. as per your unique business setting.


This slide caters details about progressive evolution of business productivity management platform through different phases. This is a strategic business efficiency administration tool investor financing elevator pitch deck different phases depicting graphics pdf template with various stages. Focus and dispense information on five stages using this creative set, that comes with editable features. It contains large content boxes to add your information on topics like remote access, virtual computing, secured application networking. You can also showcase facts, figures, and other relevant content using this PPT layout. Grab it now.
Introducing our well designed best techniques to enhance new product management efficiency why to develop marketing strategy rules pdf set of slides. The slide displays editable icons to enhance your visual presentation. The icons can be edited easily. So customize according to your business to achieve a creative edge. Download and share it with your audience.
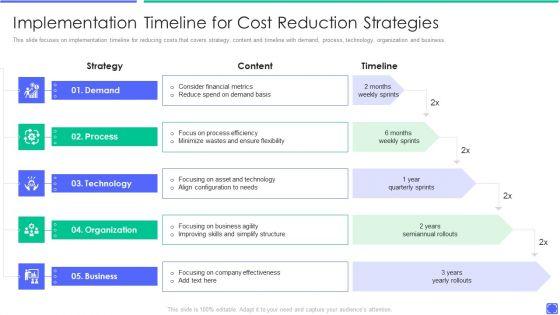
This slide focuses on implementation timeline for reducing costs that covers strategy, content and timeline with demand, process, technology, organization and business. This is a best techniques to enhance new product management efficiency implementation timeline for cost graphics pdf template with various stages. Focus and dispense information on five stages using this creative set, that comes with editable features. It contains large content boxes to add your information on topics like process, technology, organization. You can also showcase facts, figures, and other relevant content using this PPT layout. Grab it now.
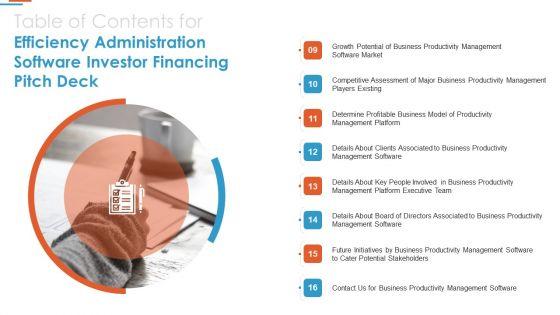

Presenting table of contents for efficiency administration software investor financing pitch deck team graphics pdf to provide visual cues and insights. Share and navigate important information on eight stages that need your due attention. This template can be used to pitch topics like management, productivity, determine, business, enterprise. In addtion, this PPT design contains high resolution images, graphics, etc, that are easily editable and available for immediate download.


This is a agenda for quality assurance transformation strategies to improve business performance efficiency graphics pdf template with various stages. Focus and dispense information on five stages using this creative set, that comes with editable features. It contains large content boxes to add your information on topics like qa transformation testing tools, cross platform compatibility, customer experience testing. You can also showcase facts, figures, and other relevant content using this PPT layout. Grab it now.


Following slide involves teams common purpose and clear expectation of organization from employees so as to attain level of performance they require from each employee in order to achieve their desired results.Deliver and pitch your topic in the best possible manner with this organizational program to improve team productivity and efficiency set common purpose graphics pdf Use them to share invaluable insights on attain appropriate working, misutilization of resources, maintain work quality and impress your audience. This template can be altered and modified as per your expectations. So, grab it now.
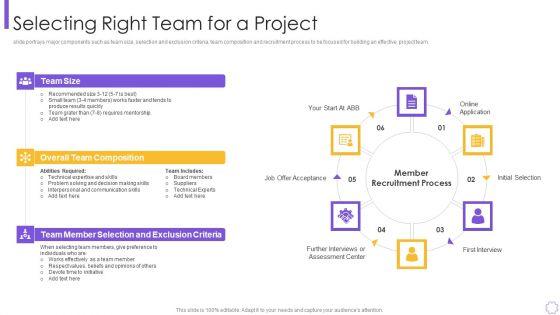

slide portrays major components such as team size, selection and exclusion criteria, team composition and recruitment process to be focused for building an effective project team.This is a organizational program to improve team productivity and efficiency selecting right graphics pdf template with various stages. Focus and dispense information on six stages using this creative set, that comes with editable features. It contains large content boxes to add your information on topics like overall team composition, team member selection, effectively as a team member You can also showcase facts, figures, and other relevant content using this PPT layout. Grab it now.


This slides aims to identify major areas of improvement post team building program execution. It uses a scoring system to measure gap level based on multiple parameters focused during the program.Deliver an awe inspiring pitch with this creative organizational program to improve team productivity and efficiency identify areas of improvement graphics pdf bundle. Topics like project cancelation, improper utilization, negotiation while purchasing can be discussed with this completely editable template. It is available for immediate download depending on the needs and requirements of the user.
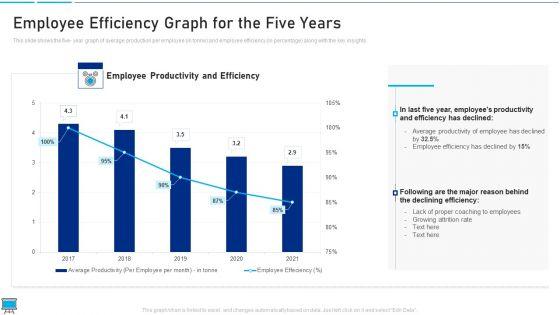
This slide shows the five year graph of average production per employee in tonne and employee efficiency in percentage along with the key insights Deliver and pitch your topic in the best possible manner with this performance training action plan and extensive strategies employee efficiency graph for the five years guidelines pdf Use them to share invaluable insights on declining efficiency, proper coaching to employees, employee efficiency and impress your audience. This template can be altered and modified as per your expectations. So, grab it now.

This slide shows the five- year graph of average production per employee in tonne and employee efficiency in percentage along with the key insights. Deliver and pitch your topic in the best possible manner with this upskill training for employee performance improvement employee efficiency graph for the five years summary pdf. Use them to share invaluable insights on employee efficiency graph for the five years and impress your audience. This template can be altered and modified as per your expectations. So, grab it now.
This slide shows the five- year graph of average production per employee in tonne and employee efficiency in percentage along with the key insights. Deliver and pitch your topic in the best possible manner with this skill development training to strengthen employee performance employee efficiency graph for the five years icons pdf. Use them to share invaluable insights on employee efficiency graph for the five years and impress your audience. This template can be altered and modified as per your expectations. So, grab it now.
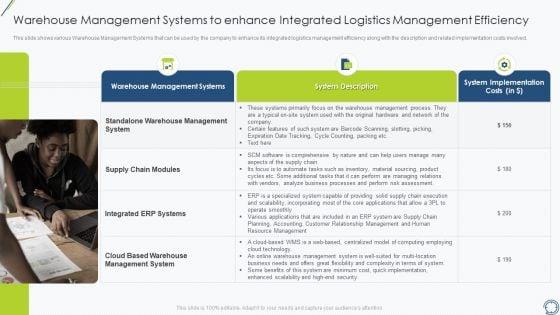

This slide shows various Warehouse Management Systems that can be used by the company to enhance its integrated logistics management efficiency along with the description and related implementation costs involved. This is a warehouse management systems to enhance integrated logistics management efficiency graphics pdf template with various stages. Focus and dispense information on one stages using this creative set, that comes with editable features. It contains large content boxes to add your information on topics like supply, processes, product, sourcing, inventory. You can also showcase facts, figures, and other relevant content using this PPT layout. Grab it now.
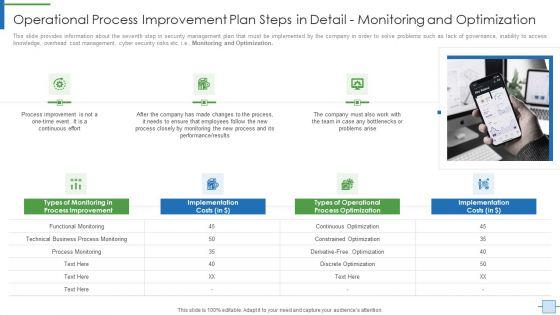
This slide provides information about the fourth step in security management plan that must be implemented by the company in order to solve problems such as lack of governance, inability to access knowledge, overhead cost management, cyber security risks etc. i.e., Assigning Resources. This is a operational efficiency execution strategy improve quality operational process improvement plan graphics pdfS template with various stages. Focus and dispense information on three stages using this creative set, that comes with editable features. It contains large content boxes to add your information on topics like team, resource, process, communication. You can also showcase facts, figures, and other relevant content using this PPT layout. Grab it now.
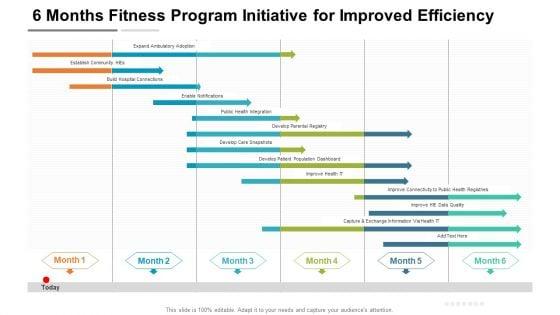

Introducing our 6 months fitness program initiative for improved efficiency graphics. This PPT presentation is Google Slides compatible, therefore, you can share it easily with the collaborators for measuring the progress. Also, the presentation is available in both standard screen and widescreen aspect ratios. So edit the template design by modifying the font size, font type, color, and shapes as per your requirements. As this PPT design is fully editable it can be presented in PDF, JPG and PNG formats.
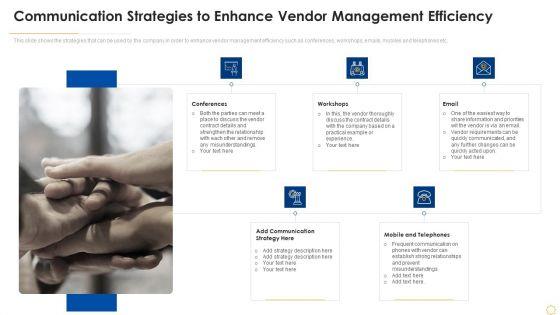

This slide shows the strategies that can be used by the company in order to enhance vendor management efficiency such as conferences, workshops, emails, mobiles and telephones etc. Presenting successful vendor management approaches to boost procurement efficiency communication strategies graphics pdf to provide visual cues and insights. Share and navigate important information on five stages that need your due attention. This template can be used to pitch topics like conferences, workshops, email, communication strategy, mobile and telephones. In addtion, this PPT design contains high resolution images, graphics, etc, that are easily editable and available for immediate download.
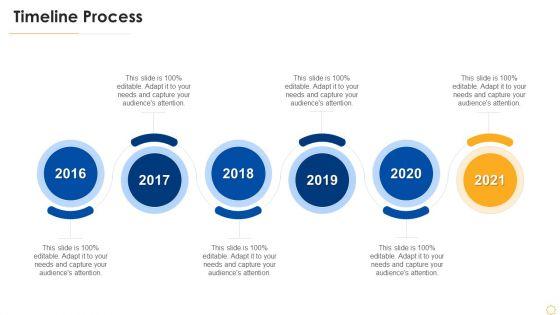

Presenting successful vendor management approaches to boost procurement efficiency timeline process graphics pdf to provide visual cues and insights. Share and navigate important information on six stages that need your due attention. This template can be used to pitch topics like timeline process, 2016 to 2021. In addtion, this PPT design contains high resolution images, graphics, etc, that are easily editable and available for immediate download.
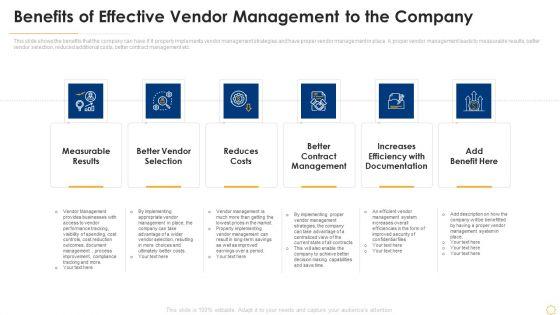

This slide shows the benefits that the company can have if it properly implements vendor management strategies and have proper vendor management in place. A proper vendor management leads to measurable results, better vendor selection, reduced additional costs, better contract management etc. Presenting successful vendor management approaches to boost procurement efficiency benefits of effective vendor graphics pdf to provide visual cues and insights. Share and navigate important information on six stages that need your due attention. This template can be used to pitch topics like measurable results, reduces costs, increases efficiency, contract management. In addtion, this PPT design contains high resolution images, graphics, etc, that are easily editable and available for immediate download.


This slide shows the future estimated Construction Management System Efficiency Indicators of the company that are compared for 3 years. Some indicators are Incident Rate, Equipment Downtime, Labor Downtime , Construction Documentation Issues, Labor Productivity, Overall Construction Management Efficiency etc. Deliver an awe inspiring pitch with this creative future estimated construction management efficiency indicators after implementing strategies graphics pdf bundle. Topics like incident rate, performance indicators, equipment downtime, management efficiency can be discussed with this completely editable template. It is available for immediate download depending on the needs and requirements of the user.


The purpose of this slide is to provide the information regarding the sales performance across various geographical regions in various financial years and the forecasted sales. Deliver an awe-inspiring pitch with this creative sales assistance boost overall efficiency projected sales performance graphics pdf bundle. Topics like projected sales performance can be discussed with this completely editable template. It is available for immediate download depending on the needs and requirements of the user.
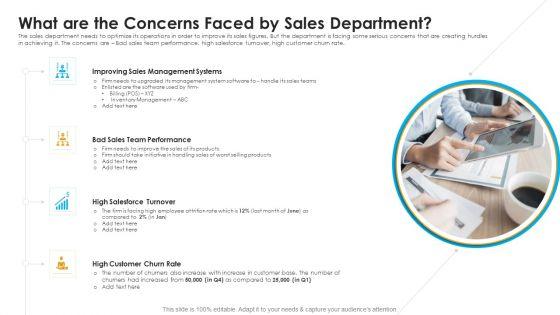

The sales department needs to optimize its operations in order to improve its sales figures. But the department is facing some serious concerns that are creating hurdles in achieving it. The concerns are Bad sales team performance, high salesforce turnover, high customer churn rate. Presenting sales assistance boost overall efficiency what are the concerns faced by sales department graphics pdf to provide visual cues and insights. Share and navigate important information on four stages that need your due attention. This template can be used to pitch topics like sales management systems, sales team performance, high customer churn rate. In addition, this PPT design contains high-resolution images, graphics, etc, that are easily editable and available for immediate download.

Presenting sales assistance boost overall efficiency post it notes ppt slides graphics pdf to provide visual cues and insights. Share and navigate important information on three stages that need your due attention. This template can be used to pitch topics like post it notes. In addition, this PPT design contains high-resolution images, graphics, etc, that are easily editable and available for immediate download.
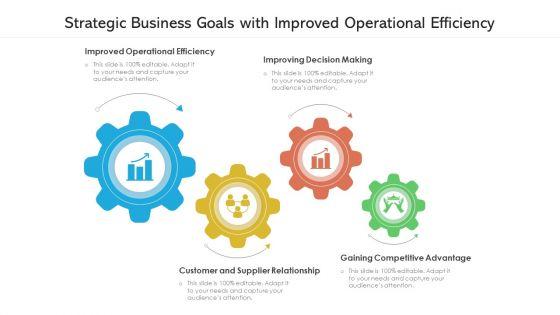

Presenting strategic business goals with improved operational efficiency ppt gallery graphics pdf. to dispense important information. This template comprises four stages. It also presents valuable insights into the topics including improved operational efficiency, improving decision making, customer and supplier relationship. This is a completely customizable PowerPoint theme that can be put to use immediately. So, download it and address the topic impactfully.
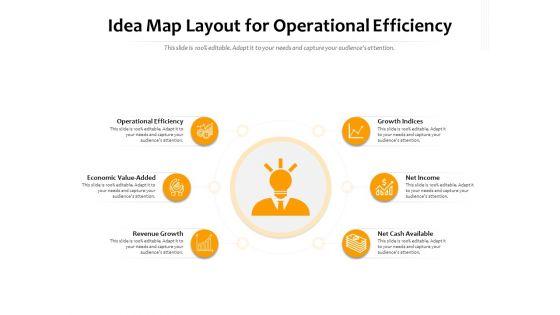
Presenting idea map layout for operational efficiency ppt powerpoint presentation infographic template graphic tips pdf to dispense important information. This template comprises six stages. It also presents valuable insights into the topics including idea map layout for operational efficiency. This is a completely customizable PowerPoint theme that can be put to use immediately. So, download it and address the topic impactfully.

Persuade your audience using this inventory management system to drive efficiency ppt powerpoint presentation file graphics pictures pdf. This PPT design covers five stages, thus making it a great tool to use. It also caters to a variety of topics including inventory management system to drive efficiency. Download this PPT design now to present a convincing pitch that not only emphasizes the topic but also showcases your presentation skills.
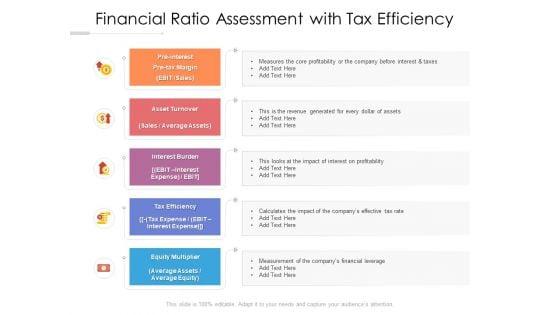
Financial Ratio Assessment With Tax Efficiency Ppt PowerPoint Presentation Show Graphics Example PDF
Presenting this set of slides with name financial ratio assessment with tax efficiency ppt powerpoint presentation show graphics example pdf. This is a four stage process. The stages in this process are pre interest, pre tax margin, asset turnover, interest burden, tax efficiency, equity multiplier. This is a completely editable PowerPoint presentation and is available for immediate download. Download now and impress your audience.
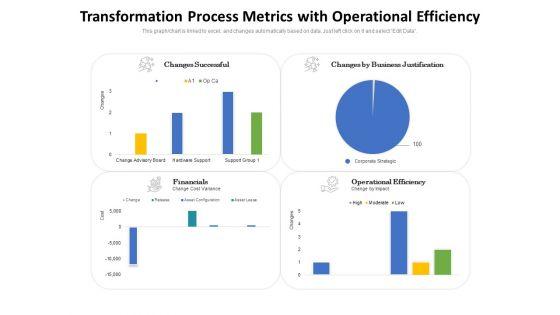
Presenting this set of slides with name transformation process metrics with operational efficiency ppt powerpoint presentation pictures graphic images pdf. The topics discussed in these slides are changes successful, changes by business justification, financials, operational efficiency. This is a completely editable PowerPoint presentation and is available for immediate download. Download now and impress your audience.
Presenting this set of slides with name person achieving efficiency in job role vector icon ppt powerpoint presentation slides graphics tutorials pdf. This is a three stage process. The stages in this process are person achieving efficiency in job role vector icon. This is a completely editable PowerPoint presentation and is available for immediate download. Download now and impress your audience.
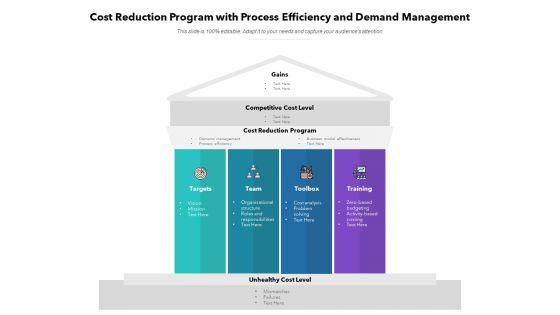

Presenting this set of slides with name cost reduction program with process efficiency and demand management ppt powerpoint presentation layouts graphic images pdf. This is a four stage process. The stages in this process are cost reduction program with process efficiency and demand management. This is a completely editable PowerPoint presentation and is available for immediate download. Download now and impress your audience.
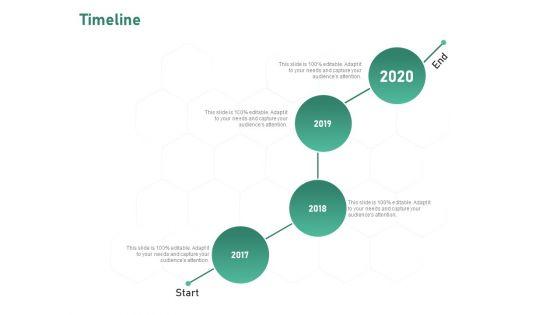

Presenting this set of slides with name intercultural proficiency for group efficiency and improved interaction timeline ppt slides graphics pdf. This is a four stage process. The stages in this process are timeline, 2017 to 2020. This is a completely editable PowerPoint presentation and is available for immediate download. Download now and impress your audience.
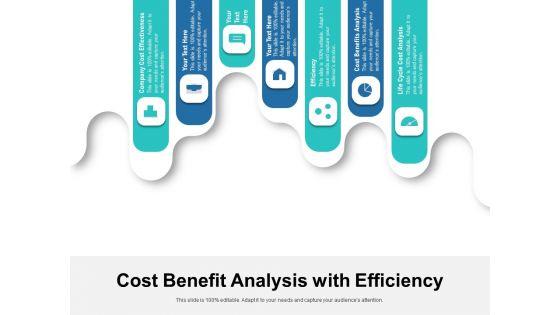

Presenting this set of slides with name cost benefit analysis with efficiency ppt powerpoint presentation gallery graphics pdf. This is a seven stage process. The stages in this process are cost, effectiveness, analysis. This is a completely editable PowerPoint presentation and is available for immediate download. Download now and impress your audience.
Presenting this set of slides with name operational efficiency business operations vector icon ppt powerpoint presentation summary graphics template pdf. This is a one stage process. The stages in this process are operational efficiency business operations vector icon. This is a completely editable PowerPoint presentation and is available for immediate download. Download now and impress your audience.

Presenting this set of slides with name effective ways improve team efficiency productivity ppt powerpoint presentation layouts graphics pictures cpb pdf. This is an editable Powerpoint three stages graphic that deals with topics like effective ways improve team efficiency productivity to help convey your message better graphically. This product is a premium product available for immediate download and is 100 percent editable in Powerpoint. Download this now and use it in your presentations to impress your audience.

Presenting this set of slides with name human resource management employee efficiency analysis ppt model graphics pdf. The topics discussed in these slides are utilization, target utilization, incurred hours, future scheduled hours, available hours. This is a completely editable PowerPoint presentation and is available for immediate download. Download now and impress your audience.
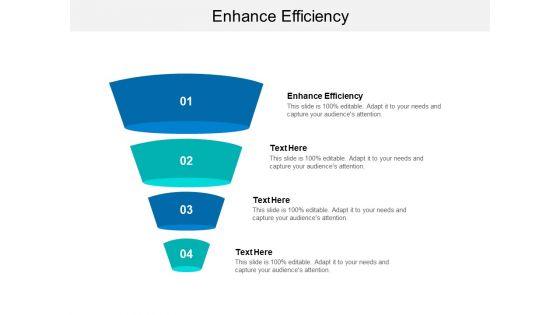

Presenting this set of slides with name enhance efficiency ppt powerpoint presentation file graphics example cpb. This is an editable Powerpoint four stages graphic that deals with topics like enhance efficiency to help convey your message better graphically. This product is a premium product available for immediate download and is 100 percent editable in Powerpoint. Download this now and use it in your presentations to impress your audience.
Presenting this set of slides with name team efficiency vector icon ppt powerpoint presentation icon graphics example. This is a three stage process. The stages in this process are team efficiency vector icon. This is a completely editable PowerPoint presentation and is available for immediate download. Download now and impress your audience.


Introducing our well designed Icons Deploying Digital Twin Technology To Enhance Operational Efficiency Ppt PowerPoint Presentation Diagram Graph Charts PDF set of slides. The slide displays editable icons to enhance your visual presentation. The icons can be edited easily. So customize according to your business to achieve a creative edge. Download and share it with your audience.
Presenting Assessment Of Capabilities For Team Efficiency Icon Graphics PDF to dispense important information. This template comprises three stages. It also presents valuable insights into the topics including Assessment Of Capabilities, Team Efficiency Icon. This is a completely customizable PowerPoint theme that can be put to use immediately. So, download it and address the topic impactfully.

This slide represents framework showcasing service delivery process which helps to achieve operational excellence. It provides information regarding plan, objectives, monitor and manage. Persuade your audience using this Service Delivery Excellence Model To Improve Operational Efficiency Graphics PDF. This PPT design covers four stages, thus making it a great tool to use. It also caters to a variety of topics including Objectives, Monitor, Manage, Plan. Download this PPT design now to present a convincing pitch that not only emphasizes the topic but also showcases your presentation skills.
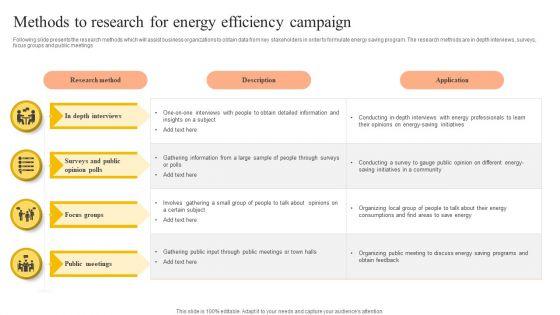
Following slide presents the research methods which will assist business organizations to obtain data from key stakeholders in order to formulate energy saving program. The research methods are in depth interviews, surveys, focus groups and public meetings Showcasing this set of slides titled Methods To Research For Energy Efficiency Campaign Graphics PDF. The topics addressed in these templates are Research Method, Description, Application. All the content presented in this PPT design is completely editable. Download it and make adjustments in color, background, font etc. as per your unique business setting.
SHOW
- 60
- 120
- 180
DISPLAYING: 60 of 82 Item(s)
Page