 AI PPT Maker
 Templates
 PPT Bundles
 Design Services
 Business PPTs
 Business Plan
 Management
 Strategy
 Introduction PPT
 Roadmap
 Self Introduction
 Timelines
 Process
 Marketing
 Agenda
 Technology
 Medical
 Startup Business Plan
 Cyber Security
 Dashboards
 SWOT
SWOT Proposals
 Education
 Pitch Deck
 Digital Marketing
 KPIs
KPIs Project Management
 Product Management
 Artificial Intelligence
 Target Market
 Communication
 Supply Chain
 Google Slides
 Research Services
 One Pagers
 All Categories
Process-infographic PowerPoint Presentation Templates and Google Slides
SHOW
- 60
- 120
- 180
DISPLAYING: 60 of 326 Item(s)
Page


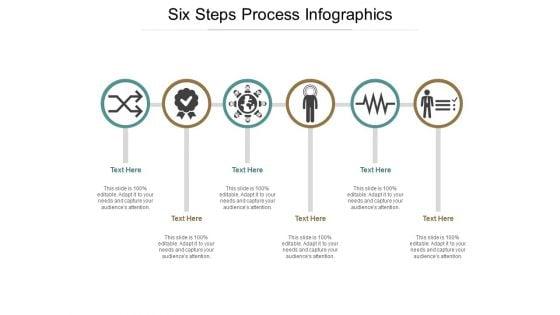
Presenting this set of slides with name six steps vector design process infographic ppt powerpoint presentation complete deck. The topics discussed in these slides are process, infographic, digital marketing, business, manufacturer. This is a completely editable PowerPoint presentation and is available for immediate download. Download now and impress your audience.

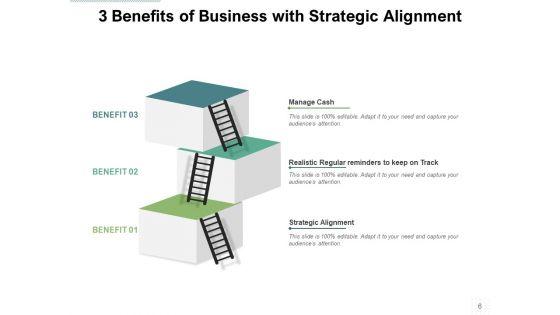


Presenting this set of slides with name three steps process infographics benefit strategic business ppt powerpoint presentation complete deck. The topics discussed in these slides are benefit, strategic, business, management, marketing. This is a completely editable PowerPoint presentation and is available for immediate download. Download now and impress your audience.


Presenting this set of slides with name circular process infographic layout ppt powerpoint presentation model format ideas. This is a three stage process. The stages in this process are 3 step circle diagram, process infographic, business goals. This is a completely editable PowerPoint presentation and is available for immediate download. Download now and impress your audience.


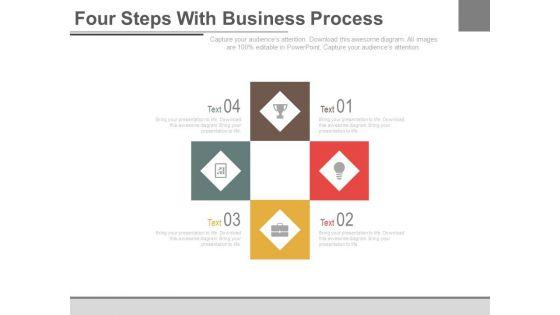
Presenting this set of slides with name phase gate process funnel infographics ppt powerpoint presentation layouts layout. This is a four stage process. The stages in this process are project funnel, performance management, planning. This is a completely editable PowerPoint presentation and is available for immediate download. Download now and impress your audience.
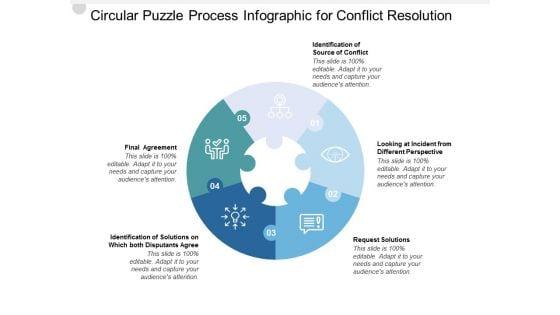


Circular Puzzle Process Infographic For Conflict Resolution Ppt PowerPoint Presentation Ideas Slides
Presenting this set of slides with name circular puzzle process infographic for conflict resolution ppt powerpoint presentation ideas slides. This is a five stage process. The stages in this process are round puzzle, continuous improvement, circular puzzle infographic. This is a completely editable PowerPoint presentation and is available for immediate download. Download now and impress your audience.


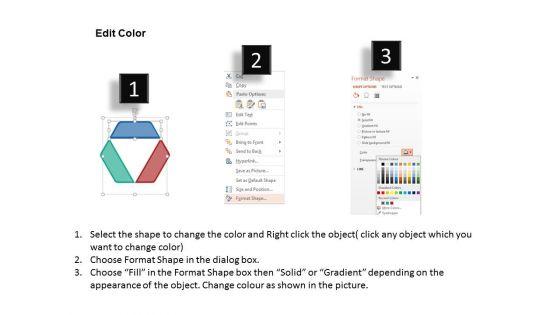
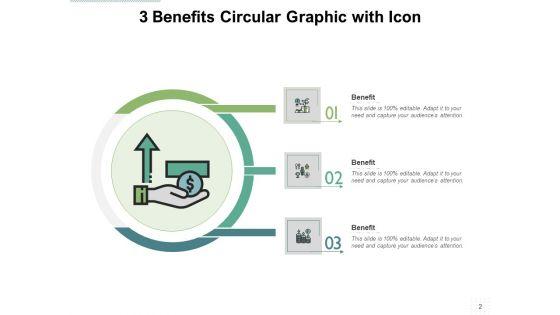
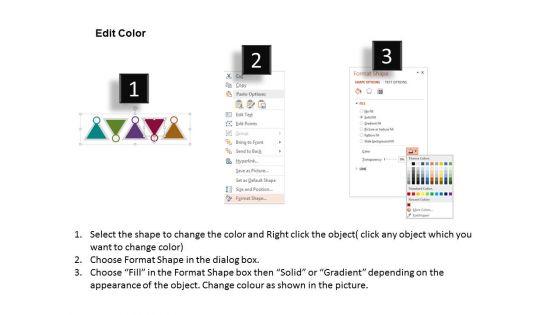
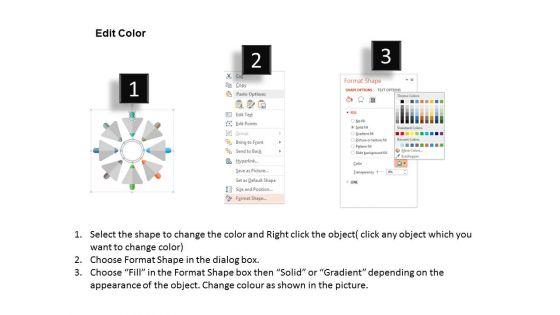
At times visuals can take over important and relevant information. Keeping such rare yet problematic situations in mind, our designers have created this slide which can be very effective to explain steps of a process in a PowerPoint presentation. This template is completely professional and is often used by our customers from the corporate and business sectors. The three multicolored labels have enough space to insert the name and some details about the process. The icons and colors are customizable and can be modified according the subject of the presentation.


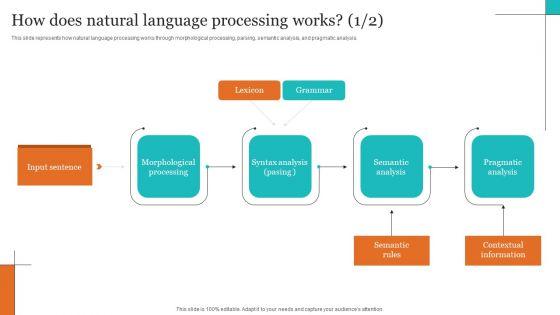
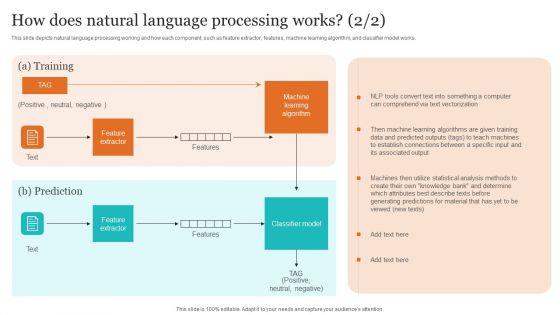
This slide represents how natural language processing works through morphological processing, parsing, semantic analysis, and pragmatic analysis. Welcome to our selection of the Leveraging NLP To Enhance Operational Efficiency How Does Natural Language Processing Works Infographics PDF. These are designed to help you showcase your creativity and bring your sphere to life. Planning and Innovation are essential for any business that is just starting out. This collection contains the designs that you need for your everyday presentations. All of our PowerPoints are 100 percent editable, so you can customize them to suit your needs. This multi purpose template can be used in various situations. Grab these presentation templates today.
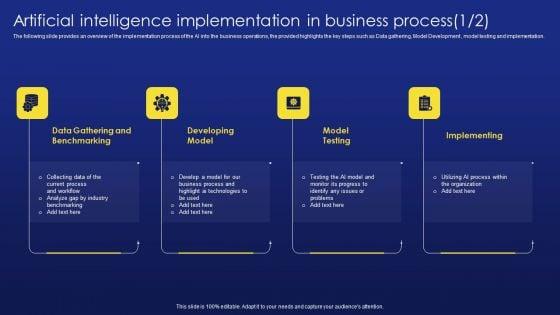
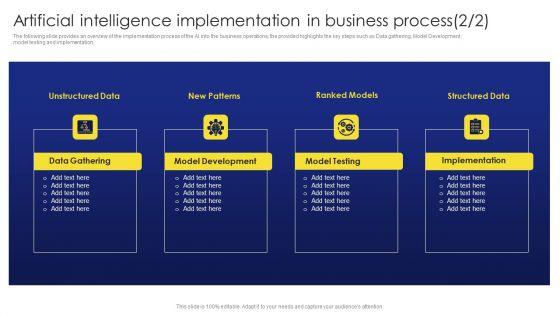
The following slide provides an overview of the implementation process of the AI into the business operations, the provided highlights the key steps such as Data gathering, Model Development , model testing and implementation. Boost your pitch with our creative Deployment Procedure Of Hyper Automation Artificial Intelligence Implementation In Business Process Infographics PDF. Deliver an awe inspiring pitch that will mesmerize everyone. Using these presentation templates you will surely catch everyones attention. You can browse the ppts collection on our website. We have researchers who are experts at creating the right content for the templates. So you do not have to invest time in any additional work. Just grab the template now and use them.

Purpose of the following slide is to show the performance trackers to check hires per month, average time spent in hiring process, offer acceptance rate etc. If you are looking for a format to display your unique thoughts, then the professionally designed Improving HRM Process Dashboards To Track Company Recruitment Process Infographics PDF is the one for you. You can use it as a Google Slides template or a PowerPoint template. Incorporate impressive visuals, symbols, images, and other charts. Modify or reorganize the text boxes as you desire. Experiment with shade schemes and font pairings. Alter, share or cooperate with other people on your work. Download Improving HRM Process Dashboards To Track Company Recruitment Process Infographics PDF and find out how to give a successful presentation. Present a perfect display to your team and make your presentation unforgettable.
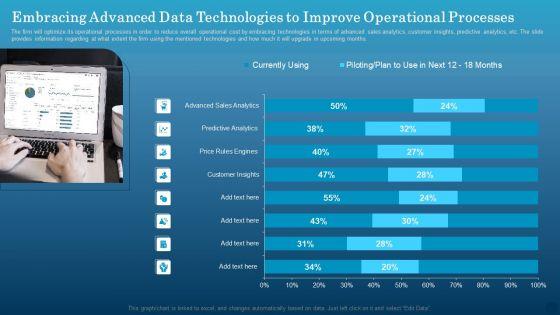

The firm will optimize its operational processes in order to reduce overall operational cost by embracing technologies in terms of advanced sales analytics, customer insights, predictive analytics, etc. The slide provides information regarding at what extent the firm using the mentioned technologies and how much it will upgrade in upcoming months. Formulating a presentation can take up a lot of effort and time, so the content and message should always be the primary focus. The visuals of the PowerPoint can enhance the presenters message, so our Embracing Advanced Data Technologies To Improve Operational Processes Infographics PDF was created to help save time. Instead of worrying about the design, the presenter can concentrate on the message while our designers work on creating the ideal templates for whatever situation is needed. Slidegeeks has experts for everything from amazing designs to valuable content, we have put everything into Embracing Advanced Data Technologies To Improve Operational Processes Infographics PDF.
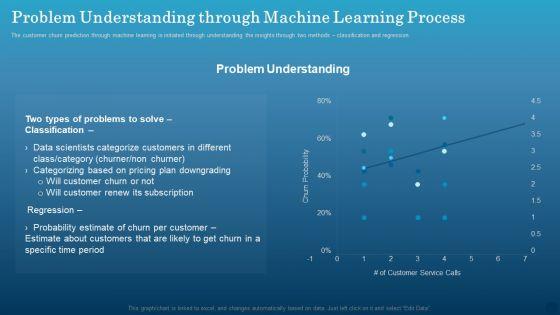
The customer churn prediction through machine learning is initiated through understanding the insights through two methods classification and regression. Crafting an eye catching presentation has never been more straightforward. Let your presentation shine with this tasteful yet straightforward Data Monetization Approach To Drive Business Growth Problem Understanding Through Machine Learning Process Infographics PDF template. It offers a minimalistic and classy look that is great for making a statement. The colors have been employed intelligently to add a bit of playfulness while still remaining professional. Construct the ideal Data Monetization Approach To Drive Business Growth Problem Understanding Through Machine Learning Process Infographics PDF that effortlessly grabs the attention of your audience. Begin now and be certain to wow your customers.


Deliver an awe inspiring pitch with this creative Table Of Contents For Decision Support System DSS To Streamline Processes Infographics PDF bundle. Topics like Need Data Warehouse, Data Warehouse Types, Working Data Warehouse can be discussed with this completely editable template. It is available for immediate download depending on the needs and requirements of the user.


The following slide highlights the business trends influencing human resource automation. It showcases remote teams, cloud based hr, recruitment experience, learning and development, analytics and data security. Presenting Business Trends Influencing HR Automation Software And Processes Infographics PDF to dispense important information. This template comprises six stages. It also presents valuable insights into the topics including Recruitment Experience, Remote Teams, Learning And Development. This is a completely customizable PowerPoint theme that can be put to use immediately. So, download it and address the topic impactfully.
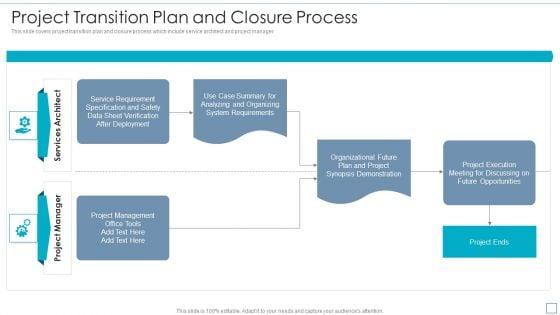
This slide covers project transition plan and closure process which include service architect and project manager. Pitch your topic with ease and precision using this Project Transition Plan And Closure Process Infographics PDF. This layout presents information on Service Requirement, Deployment, System Requirements. It is also available for immediate download and adjustment. So, changes can be made in the color, design, graphics or any other component to create a unique layout.
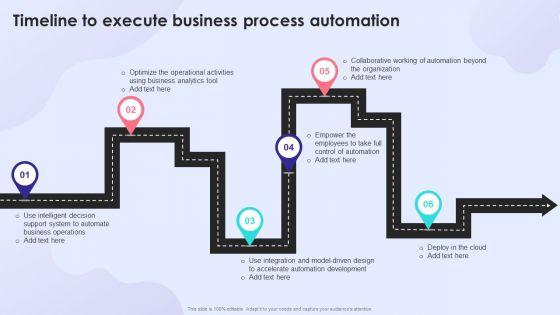

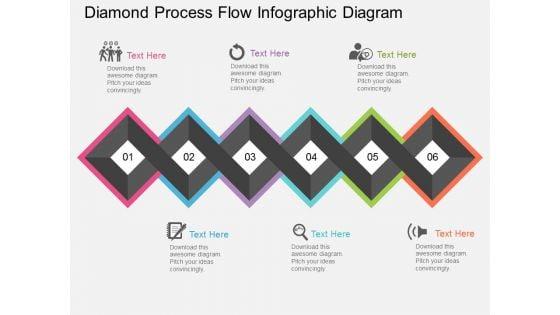
This is a Timeline To Execute Business Process Automation Infographics PDF template with various stages. Focus and dispense information on six stages using this creative set, that comes with editable features. It contains large content boxes to add your information on topics like Business Analytics, Accelerate Automation Development, Model Driven Design. You can also showcase facts, figures, and other relevant content using this PPT layout. Grab it now.
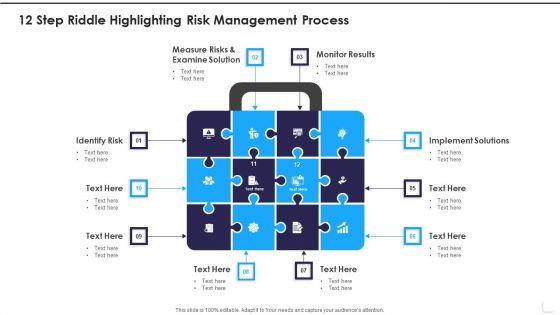

Persuade your audience using this 12 Step Riddle Highlighting Risk Management Process Infographics PDF. This PPT design covers tweleve stages, thus making it a great tool to use. It also caters to a variety of topics including Monitor Results, Implement Solutions, Identify Risk. Download this PPT design now to present a convincing pitch that not only emphasizes the topic but also showcases your presentation skills.


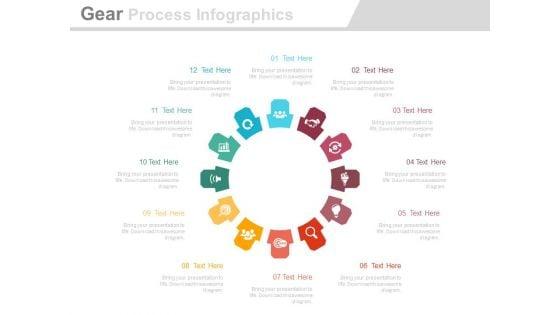
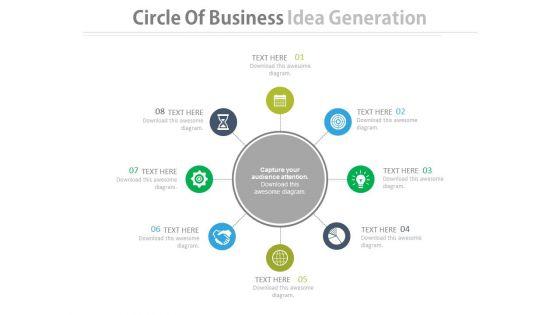
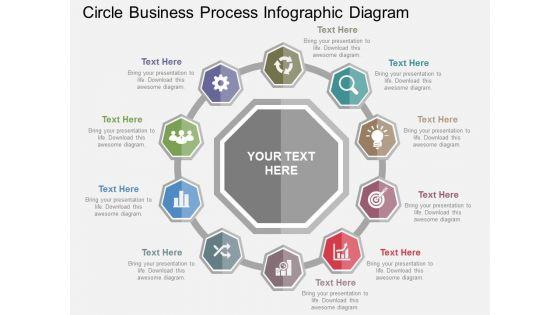
Persuade your audience using this 10 Piece Wheel For Business Planning Process Ppt Infographic Template Outfit PDF. This PPT design covers ten stages, thus making it a great tool to use. It also caters to a variety of topics including Objectives, Goals, Mission And Vision. Download this PPT design now to present a convincing pitch that not only emphasizes the topic but also showcases your presentation skills.
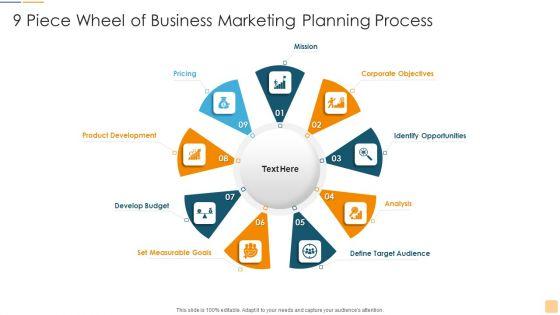

Persuade your audience using this 9 Piece Wheel Of Business Marketing Planning Process Ppt Infographics Shapes PDF. This PPT design covers nine stages, thus making it a great tool to use. It also caters to a variety of topics including Corporate Objectives, Identify Opportunities, Define Target Audience. Download this PPT design now to present a convincing pitch that not only emphasizes the topic but also showcases your presentation skills.
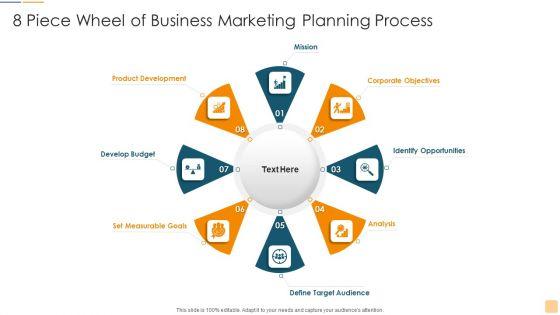

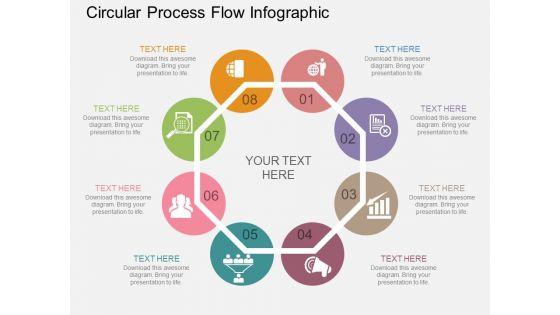
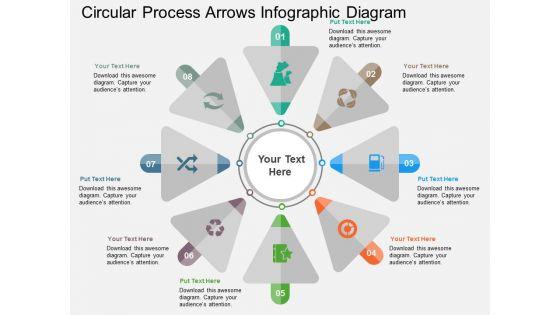
Persuade your audience using this 8 Piece Wheel Of Business Marketing Planning Process Ppt Infographics Vector PDF. This PPT design covers eight stages, thus making it a great tool to use. It also caters to a variety of topics including Corporate Objectives, Identify Opportunities, Define Target Audience. Download this PPT design now to present a convincing pitch that not only emphasizes the topic but also showcases your presentation skills.
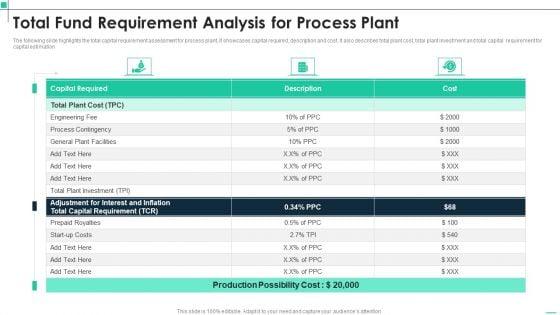

The following slide highlights the total capital requirement assessment for process plant, It showcases capital required, description and cost. It also describes total plant cost, total plant investment and total capital requirement for capital estimation. Pitch your topic with ease and precision using this Total Fund Requirement Analysis For Process Plant Infographics PDF. This layout presents information on Total Plant Investment, Capital Requirement, Capital Required. It is also available for immediate download and adjustment. So, changes can be made in the color, design, graphics or any other component to create a unique layout.
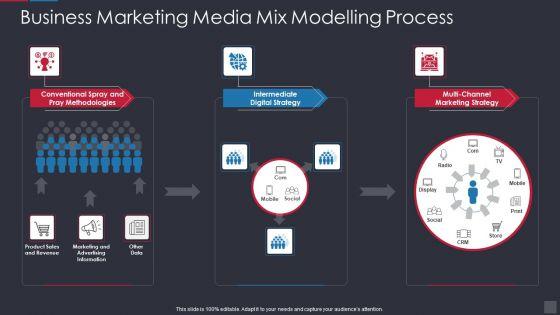

Showcasing this set of slides titled Business Marketing Media Mix Modelling Process Infographics PDF. The topics addressed in these templates are Marketing Strategy, Intermediate Digital Strategy, Pray Methodologies. All the content presented in this PPT design is completely editable. Download it and make adjustments in color, background, font etc. as per your unique business setting.
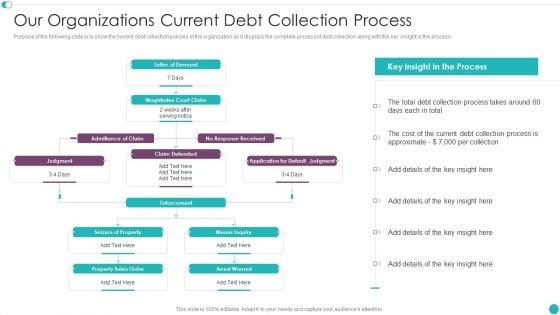
Purpose of the following slide is to show the current debt collection policies of the organization as it displays the complete process of debt collection along with the key insight in the process. Presenting Credit Management And Recovery Policies Our Organizations Current Debt Collection Process Infographics PDF to provide visual cues and insights. Share and navigate important information on seven stages that need your due attention. This template can be used to pitch topics like Letter Demand, Magistrates Court, Admittance Claim. In addtion, this PPT design contains high resolution images, graphics, etc, that are easily editable and available for immediate download.
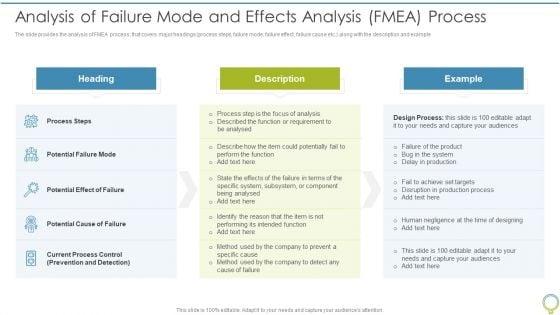

The slide provides the analysis of FMEA process, that covers major headings process steps, failure mode, failure effect, failure cause etc. along with the description and example. Deliver an awe inspiring pitch with this creative FMEA To Determine Potential Analysis Of Failure Mode And Effects Analysis FMEA Process Infographics PDF bundle. Topics like Process Steps, Potential Cause, Current Process can be discussed with this completely editable template. It is available for immediate download depending on the needs and requirements of the user.
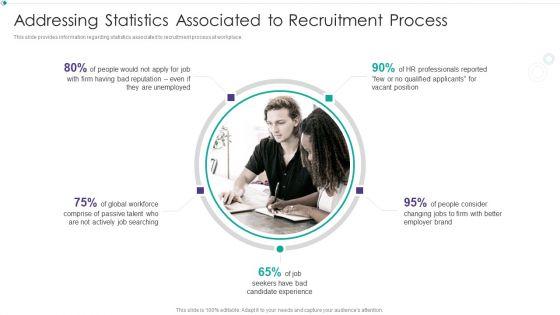
This slide provides information regarding statistics associated to recruitment process at workplace. Presenting Hiring New Employees At Workplace Addressing Statistics Associated To Recruitment Process Infographics PDF to provide visual cues and insights. Share and navigate important information on five stages that need your due attention. This template can be used to pitch topics like Addressing Statistics, Associated, Recruitment Process. In addtion, this PPT design contains high resolution images, graphics, etc, that are easily editable and available for immediate download.


This slide covers the performance benchmarking report for effective supply chain process which includes performance attribute, metrics, supplier actual, parity, advantage, superior and gaps in actual performance with accuracy, responsiveness, flexibility, expense, etc.Pitch your topic with ease and precision using this Performance Benchmarking Report For Effective Supply Chain Process Infographics PDF This layout presents information on Responsiveness, Flexibility, Accuracy It is also available for immediate download and adjustment. So, changes can be made in the color, design, graphics or any other component to create a unique layout.
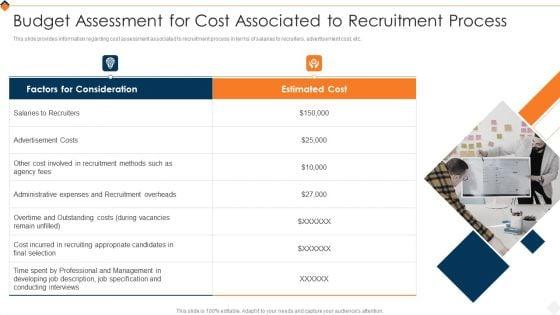

This slide provides information regarding cost assessment associated to recruitment process in terms of salaries to recruiters, advertisement cost, etc. Presenting Optimizing Recruitment Process Budget Assessment For Cost Associated To Recruitment Process Infographics PDF to provide visual cues and insights. Share and navigate important information on two stages that need your due attention. This template can be used to pitch topics like Salaries To Recruiters, Advertisement Costs, Recruiting Appropriate In addtion, this PPT design contains high resolution images, graphics, etc, that are easily editable and available for immediate download.
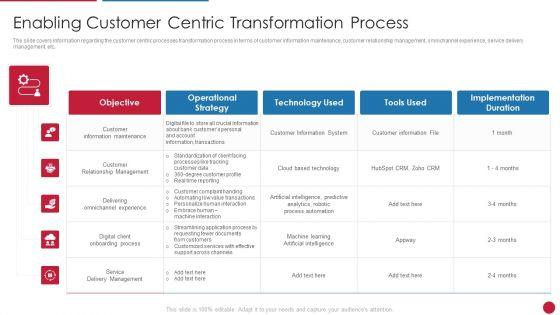
The slide covers information regarding the customer centric processes transformation process in terms of customer information maintenance, customer relationship management, omnichannel experience, service delivery management, etc. Deliver and pitch your topic in the best possible manner with this Facilitating IT Intelligence Architecture Enabling Customer Centric Transformation Process Infographics PDF Use them to share invaluable insights on Operational Strategy, Implementation Duration, Information Maintenance and impress your audience. This template can be altered and modified as per your expectations. So, grab it now.


This slide provides the line graph of hiring manager satisfaction rate that shows improvement in satisfaction rate after implementing the recruitment training program Deliver and pitch your topic in the best possible manner with this Recruitment Training Program For Workforce Hiring Manager Satisfaction With Recruitment Process Infographics PDF Use them to share invaluable insights on Recruitment Training Program, Improving The Hiring Managers, Recruitment Process and impress your audience. This template can be altered and modified as per your expectations. So, grab it now.
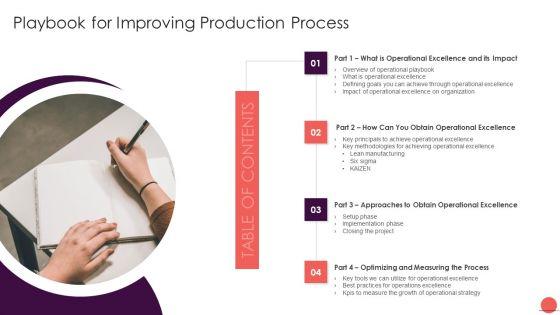
Presenting Table Of Contents Playbook For Improving Production Process Infographics PDF to provide visual cues and insights. Share and navigate important information on four stages that need your due attention. This template can be used to pitch topics like Operational Excellence, Approaches To Obtain, Optimizing And Measuring Process. In addtion, this PPT design contains high resolution images, graphics, etc, that are easily editable and available for immediate download.
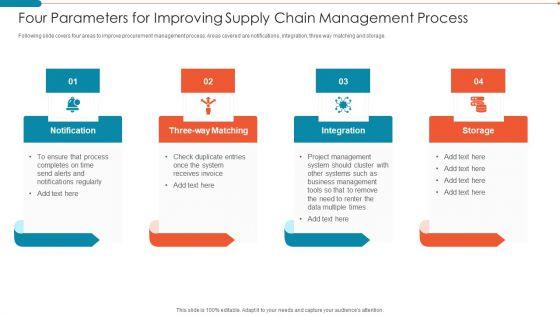
Following slide covers four areas to improve procurement management process. Areas covered are notifications, integration, three way matching and storage.Persuade your audience using this Four Parameters For Improving Supply Chain Management Process Infographics PDF. This PPT design covers four stages, thus making it a great tool to use. It also caters to a variety of topics including Management, System, Notifications. Download this PPT design now to present a convincing pitch that not only emphasizes the topic but also showcases your presentation skills.
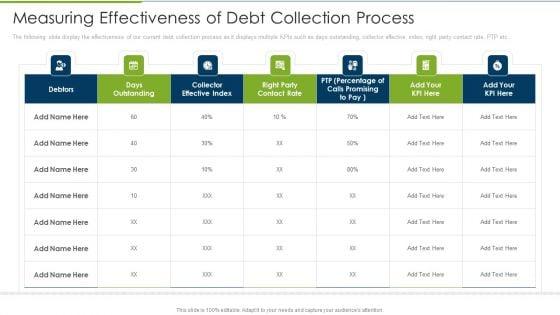

Debt Collection Improvement Plan Measuring Effectiveness Of Debt Collection Process Infographics PDF
The following slide display the effectiveness of our current debt collection process as it displays multiple KPIs such as days outstanding, collector effective index, right party contact rate, PTP etc. Deliver an awe inspiring pitch with this creative debt collection improvement plan measuring effectiveness of debt collection process infographics pdf bundle. Topics like days outstanding, collector effective index, right party contact rate can be discussed with this completely editable template. It is available for immediate download depending on the needs and requirements of the user.


Organization strategy and process are essential parts of a business playbook as they define the strategy structure, system and inner working of the organization. The following slide aligns the organization strategy with vision and mission. Presenting corporate organization playbook organization strategy and process ppt infographics background image pdf to provide visual cues and insights. Share and navigate important information on four stages that need your due attention. This template can be used to pitch topics like strategy, structure, system, process, business vision, business mission. In addtion, this PPT design contains high resolution images, graphics, etc, that are easily editable and available for immediate download.
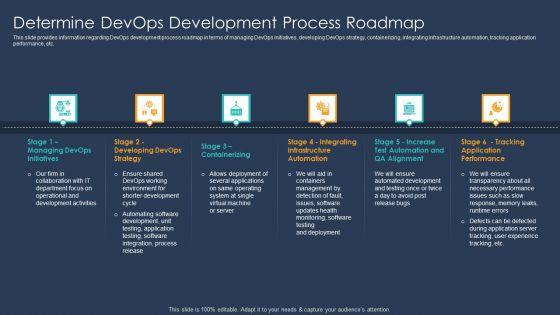

This is a Devops Implementation And Advisory Proposal IT Determine Devops Development Process Roadmap Infographics PDF template with various stages. Focus and dispense information on six stages using this creative set, that comes with editable features. It contains large content boxes to add your information on topics like Development, Environment, Management, Application. You can also showcase facts, figures, and other relevant content using this PPT layout. Grab it now.


This slide covers quality inspection management with its process flow. It provides details about batch creation, execution, outcomes and defects, usage decision, packaging, notifying production team, etc. Pitch your topic with ease and precision using this process flow of quality control process infographics pdf. This layout presents information on quantity, executing inspection, inspection guidelines. It is also available for immediate download and adjustment. So, changes can be made in the color, design, graphics or any other component to create a unique layout.
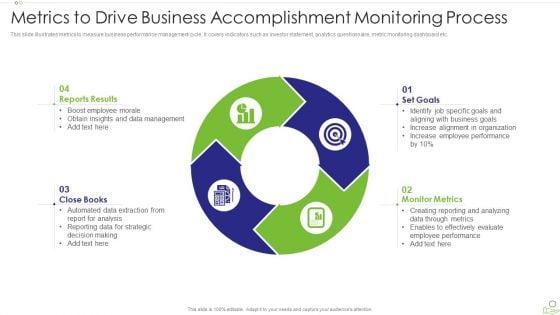
This slide illustrates metrics to measure business performance management cycle. It covers indicators such as investor statement, analytics questionnaire, metric monitoring dashboard etc. Presenting metrics to drive business accomplishment monitoring process infographics pdf to dispense important information. This template comprises four stages. It also presents valuable insights into the topics including monitor metrics, set goals, close books. This is a completely customizable PowerPoint theme that can be put to use immediately. So, download it and address the topic impactfully.


In this slide, we are tabulating the key processes and activities involved for data management process. It contains information on implementing the change management in data analytic framework. Deliver an awe inspiring pitch with this creative business intelligence and big data analytics change management data analytics process infographics pdf bundle. Topics like strategy, key plan, key activities, infrastructure can be discussed with this completely editable template. It is available for immediate download depending on the needs and requirements of the user.
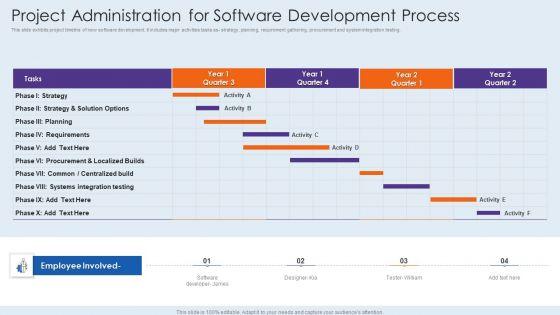

This slide exhibits project timeline of new software development. It includes major activities tasks as strategy, planning, requirement gathering, procurement and system integration testing. Showcasing this set of slides titled project administration for software development process infographics pdf. The topics addressed in these templates are strategy, requirements, planning. All the content presented in this PPT design is completely editable. Download it and make adjustments in color, background, font etc. as per your unique business setting.
SHOW
- 60
- 120
- 180
DISPLAYING: 60 of 326 Item(s)
Page