- Sign up
- Sign In
 AI PPT Maker
 Templates
 PPT Bundles
 Design Services
 Business PPTs
 Business Plan
 Management
 Strategy
 Introduction PPT
 Roadmap
 Self Introduction
 Timelines
 Process
 Marketing
 Agenda
 Technology
 Medical
 Startup Business Plan
 Cyber Security
 Dashboards
 SWOT
SWOT Proposals
 Education
 Pitch Deck
 Digital Marketing
 KPIs
KPIs Project Management
 Product Management
 Artificial Intelligence
 Target Market
 Communication
 Supply Chain
 Google Slides
 Research Services
 One Pagers
 All Categories
Financial indicator PowerPoint Presentation Templates and Google Slides
SHOW
- 60
- 120
- 180
DISPLAYING: 60 of 71 Item(s)
Page


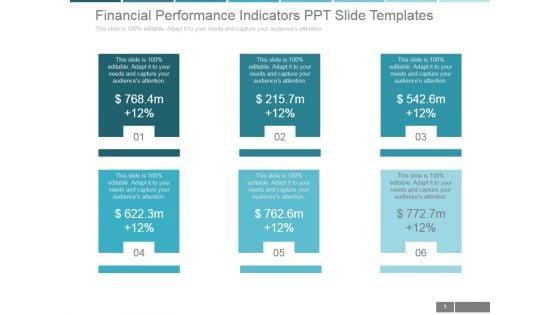
Boost your confidence and team morale with this well-structured Company Financial Performance Indicators Ppt PowerPoint Presentation Complete Deck With Slides. This prefabricated set gives a voice to your presentation because of its well-researched content and graphics. Our experts have added all the components very carefully, thus helping you deliver great presentations with a single click. Not only that, it contains a set of twelve slides that are designed using the right visuals, graphics, etc. Various topics can be discussed, and effective brainstorming sessions can be conducted using the wide variety of slides added in this complete deck. Apart from this, our PPT design contains clear instructions to help you restructure your presentations and create multiple variations. The color, format, design anything can be modified as deemed fit by the user. Not only this, it is available for immediate download. So, grab it now.


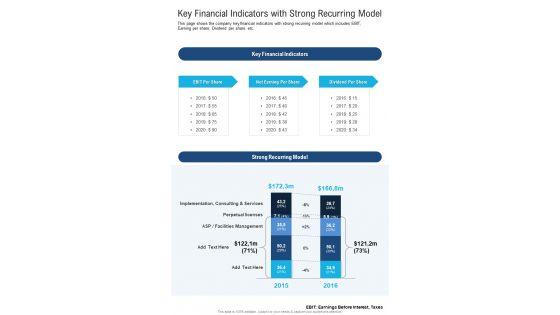
This page shows the company key financial indicators with strong recurring model which includes EBIT, Earning per share, Dividend per share, etc. Presenting you an exemplary Key Financial Indicators With Strong Recurring Model Template 284 One Pager Documents. Our one-pager comprises all the must-have essentials of an inclusive document. You can edit it with ease, as its layout is completely editable. With such freedom, you can tweak its design and other elements to your requirements. Download this Key Financial Indicators With Strong Recurring Model Template 284 One Pager Documents brilliant piece now.

Presenting you a fantastic Key Financial Indicators With Strong Recurring Model One Pager Documents. This piece is crafted on hours of research and professional design efforts to ensure you have the best resource. It is completely editable and its design allow you to rehash its elements to suit your needs. Get this Key Financial Indicators With Strong Recurring Model One Pager Documents A4 One-pager now.
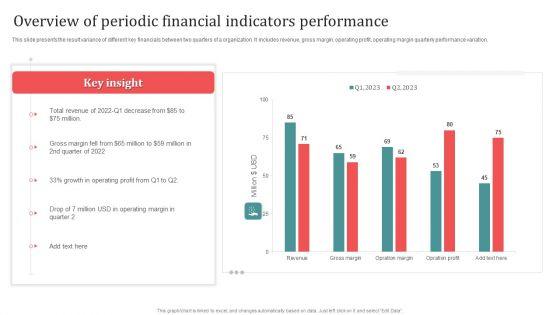
This slide presents the result variance of different key financials between two quarters of a organization. It includes revenue, gross margin, operating profit, operating margin quarterly performance variation. Showcasing this set of slides titled Overview Of Periodic Financial Indicators Performance Designs PDF. The topics addressed in these templates are Overview Of Periodic, Financial Indicators Performance. All the content presented in this PPT design is completely editable. Download it and make adjustments in color, background, font etc. as per your unique business setting.
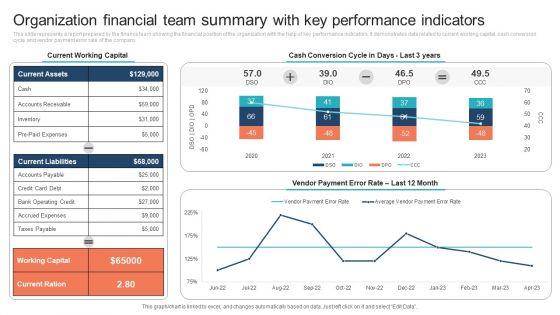
This slide represents a report prepared by the finance team showing the financial position of the organization with the help of key performance indicators. It demonstrates data related to current working capital, cash conversion cycle and vendor payment error rate of the company. Pitch your topic with ease and precision using this Organization Financial Team Summary With Key Performance Indicators Clipart PDF. This layout presents information on Current Working Capital, Cash Conversion Cycle. It is also available for immediate download and adjustment. So, changes can be made in the color, design, graphics or any other component to create a unique layout.
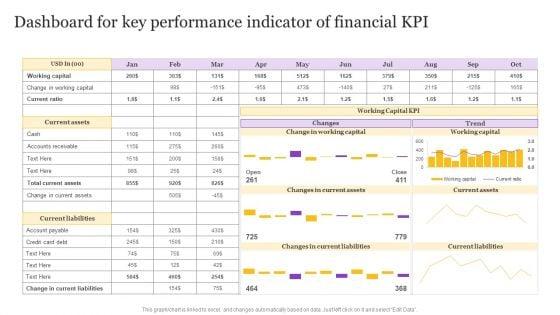

Pitch your topic with ease and precision using this Dashboard For Key Performance Indicator Of Financial KPI Background PDF. This layout presents information on Dashboard For Key, Performance Indicator, Financial KPI. It is also available for immediate download and adjustment. So, changes can be made in the color, design, graphics or any other component to create a unique layout.
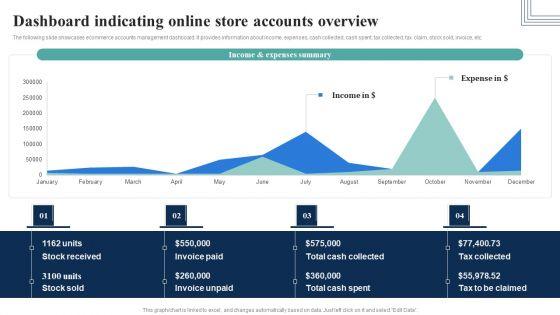
The following slide showcases ecommerce accounts management dashboard. It provides information about income, expenses, cash collected, cash spent, tax collected, tax claim, stock sold, invoice, etc.Do you know about Slidesgeeks How Electronic Commerce Financial Procedure Can Be Enhanced Dashboard Indicating Online Store Pictures PDF These are perfect for delivering any kind od presentation. Using it, create PowerPoint presentations that communicate your ideas and engage audiences. Save time and effort by using our pre-designed presentation templates that are perfect for a wide range of topic. Our vast selection of designs covers a range of styles, from creative to business, and are all highly customizable and easy to edit. Download as a PowerPoint template or use them as Google Slides themes.


The following slide showcases ecommerce accounts management dashboard. It provides information about income, expenses, cash collected, cash spent, tax collected, tax claim, stock sold, invoice, etc.From laying roadmaps to briefing everything in detail, our templates are perfect for you. You can set the stage with your presentation slides. All you have to do is download these easy-to-edit and customizable templates. Dashboard Indicating Online Store Accounts Overview Financial Management Strategies Clipart PDF will help you deliver an outstanding performance that everyone would remember and praise you for. Do download this presentation today.
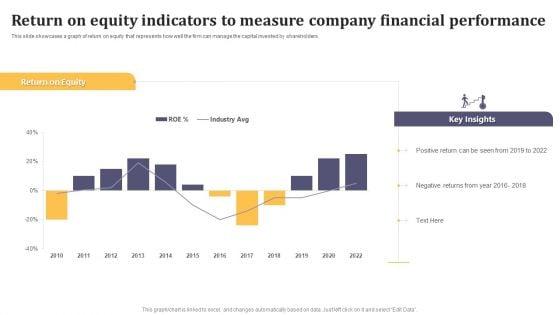
This slide showcases a graph of return on equity that represents how well the firm can manage the capital invested by shareholders. Pitch your topic with ease and precision using this Return On Equity Indicators To Measure Company Financial Performance Mockup PDF. This layout presents information on Return On Equity, Key Insights, Positive Return. It is also available for immediate download and adjustment. So, changes can be made in the color, design, graphics or any other component to create a unique layout.
This slide shows dashboard of finance KPIs . It covers working capital, cash conversion cycle, vendor payment error rate ,current assets and liabilities. Showcasing this set of slides titled Company Financial Performance Indicators Dashboard With Working Capital And Cash Conversion Icons PDF. The topics addressed in these templates are Current Working Capital, Current Liabilities, Working Capital. All the content presented in this PPT design is completely editable. Download it and make adjustments in color, background, font etc. as per your unique business setting.

This graph or chart is linked to excel, and changes automatically based on data. Just left click on it and select Edit Data. Pitch your topic with ease and precision using this Company Financial Performance Indicators Dashboard With Liquidity And Turnover Ratios Formats PDF. This layout presents information on Cash Balance, Days Inventory Outstanding, Days Payable Outstanding. It is also available for immediate download and adjustment. So, changes can be made in the color, design, graphics or any other component to create a unique layout.
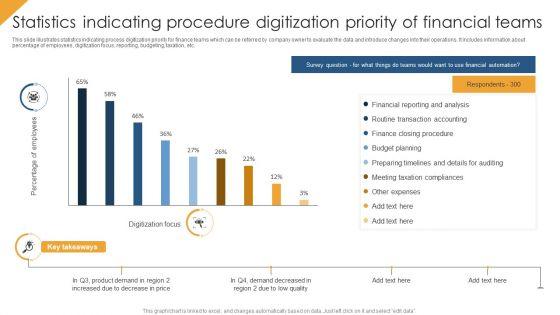

This slide illustrates statistics indicating process digitization priority for finance teams which can be referred by company owner to evaluate the data and introduce changes into their operations. It includes information about percentage of employees, digitization focus, reporting, budgeting, taxation, etc. Showcasing this set of slides titled Statistics Indicating Procedure Digitization Priority Of Financial Teams Themes PDF. The topics addressed in these templates are Budget Planning, Financial Reporting And Analysis, Other Expenses. All the content presented in this PPT design is completely editable. Download it and make adjustments in color, background, font etc. as per your unique business setting.
This slide illustrates finance process dashboard indicating yearly revenue analysis which contains gross profit margin, operating profit ratio, net profit, revenue and cost of goods sold cogs operating expenses, etc. It can be referred by company owners who can compare it with previous years performance and make related decisions for future. Showcasing this set of slides titled Financial Procedure Dashboard Indicating Yearly Revenue Analysis Icons PDF. The topics addressed in these templates are Operating Profit Percentage, Net Profit Percentage, Operating Profit Ratio. All the content presented in this PPT design is completely editable. Download it and make adjustments in color, background, font etc. as per your unique business setting.


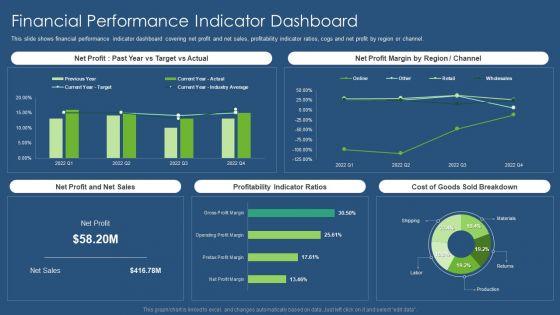
This slide shows financial performance indicator dashboard covering net profit and net sales, profitability indicator ratios, cogs and net profit by region or channel. Deliver and pitch your topic in the best possible manner with this Financial Performance Indicator Dashboard Company Performance Evaluation Using KPI Structure PDF. Use them to share invaluable insights on Financial Performance, Indicator Dashboard, Profitability Indicator and impress your audience. This template can be altered and modified as per your expectations. So, grab it now.
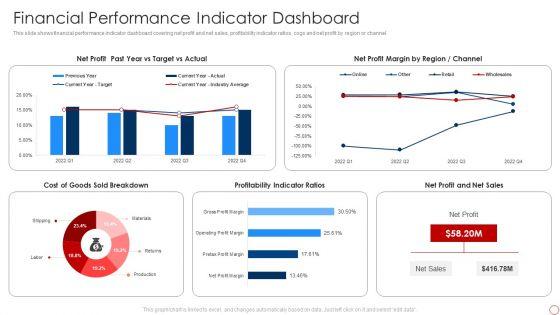

This slide shows financial performance indicator dashboard covering net profit and net sales, profitability indicator ratios, cogs and net profit by region or channel. Deliver and pitch your topic in the best possible manner with this Kpis For Evaluating Business Sustainability Financial Performance Indicator Dashboard Demonstration PDF. Use them to share invaluable insights on Net Profit, Net Profit Margin, Profitability Indicator Ratios and impress your audience. This template can be altered and modified as per your expectations. So, grab it now.

This slide shows financial performance indicator dashboard covering net profit and net sales, profitability indicator ratios, cogs and net profit by region or channel.Deliver an awe inspiring pitch with this creative Enterprise Sustainability Performance Metrics Financial Performance Indicator Dashboard Themes PDF bundle. Topics like Profitability Indicator, Sold Breakdown, Target Actual can be discussed with this completely editable template. It is available for immediate download depending on the needs and requirements of the user.


This slide shows financial performance indicator dashboard covering net profit and net sales, profitability indicator ratios, cogs and net profit by region or channel. Deliver an awe inspiring pitch with this creative Metrics To Measure Business Performance Financial Performance Indicator Dashboard Pictures PDF bundle. Topics like Net Profit, Net Sales, Cost Goods, Sold Breakdown can be discussed with this completely editable template. It is available for immediate download depending on the needs and requirements of the user.
Persuade your audience using this Market Indicators Icon To Interpret Financial Information Rules PDF This PPT design covers three stages, thus making it a great tool to use. It also caters to a variety of topics including Market Indicators, Icon To Interpret, Financial Information Download this PPT design now to present a convincing pitch that not only emphasizes the topic but also showcases your presentation skills.

The slide provides the 2029 and 2020 data of various Key performance indicators KPIs of accounting. Major KPIs include free cash flow, accounts payable, invoice errors, net discount, days sale outstanding, days payable outstanding, operating cycle days etc. Deliver an awe inspiring pitch with this creative Summary Financial Current Performance Of Key Accounting Indicators Template PDF bundle. Topics like Free Cash Flows, Accounts Payable, Percentage Of Invoice Errors, Net Discount can be discussed with this completely editable template. It is available for immediate download depending on the needs and requirements of the user.


Showcasing this set of slides titled financial statement indicating company book value mockup pdf. The topics addressed in these templates are book value statement, assets, liabilities. All the content presented in this PPT design is completely editable. Download it and make adjustments in color, background, font etc. as per your unique business setting.
This slide shows financial performance indicator dashboard covering net profit and net sales, profitability indicator ratios, cogs and net profit by region or channel. Deliver an awe inspiring pitch with this creative sustainability calculation with kpi financial performance indicator dashboard infographics pdf bundle. Topics like net profit margin, net profit and net sales, profitability indicator ratios, sold breakdown can be discussed with this completely editable template. It is available for immediate download depending on the needs and requirements of the user.
The slide shows key Performance Indicator KPI which will help the company to track the success of Accounting and Finance Transformation. Major KPIs include revenue, operating profit margin, net profit margin, invoice errors, net discount etc. Deliver an awe inspiring pitch with this creative roadmap for financial accounting transformation key performance indicators to track the success of accounting icons pdf bundle. Topics like revenue, operating profit margin, net profit margin, invoice errors, net discount can be discussed with this completely editable template. It is available for immediate download depending on the needs and requirements of the user.
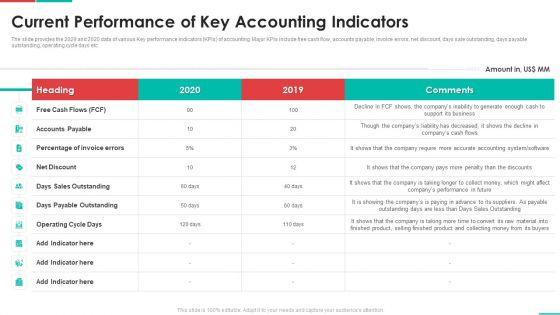

The slide provides the 2029 and 2020 data of various Key performance indicators KPIs of accounting. Major KPIs include free cash flow, accounts payable, invoice errors, net discount, days sale outstanding, days payable outstanding, operating cycle days etc. Deliver an awe inspiring pitch with this creative roadmap for financial accounting transformation current performance of key accounting indicators elements pdf bundle. Topics like accounts payable, operating cycle days, days payable outstanding, net discount can be discussed with this completely editable template. It is available for immediate download depending on the needs and requirements of the user.
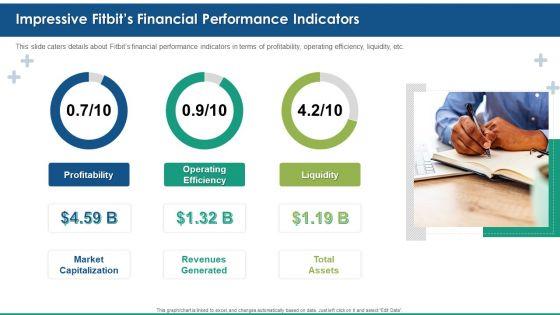

This slide caters details about Fitbits financial performance indicators in terms of profitability, operating efficiency, liquidity, etc. Deliver and pitch your topic in the best possible manner with this fitbit venture capital investment elevator impressive fitbits financial performance indicators structure pdf. Use them to share invaluable insights on profitability, operating efficiency, liquidity and impress your audience. This template can be altered and modified as per your expectations. So, grab it now.
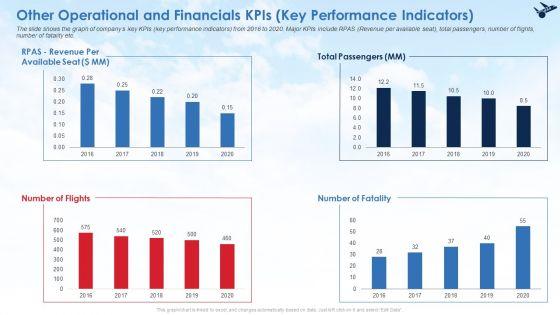
The slide shows the graph of companys key KPIs key performance indicators from 2016 to 2020. Major KPIs include RPAS Revenue per available seat, total passengers, number of flights, number of fatality etc. Deliver an awe inspiring pitch with this creative other operational and financials kpis key performance indicators ideas pdf bundle. Topics like other operational and financials kpis key performance indicators can be discussed with this completely editable template. It is available for immediate download depending on the needs and requirements of the user.
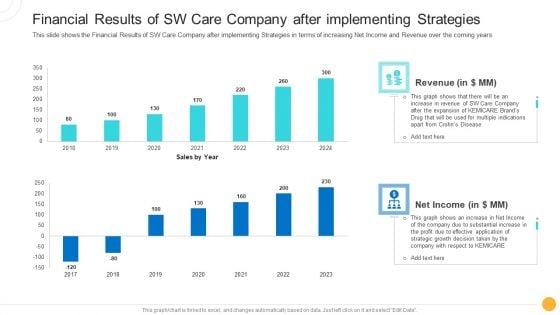

This slide shows the Financial Results of SW Care Company after implementing Strategies in terms of increasing Net Income and Revenue over the coming years. Deliver and pitch your topic in the best possible manner with this drug indicator extension in a pharmaceuticals company financial results of sw care company after implementing strategies designs pdf. Use them to share invaluable insights on revenue, net income and impress your audience. This template can be altered and modified as per your expectations. So, grab it now.
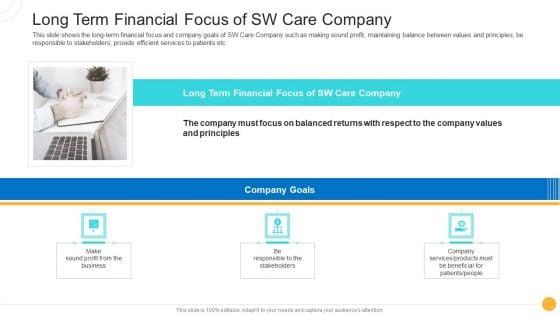
This slide shows the long-term financial focus and company goals of SW Care Company such as making sound profit, maintaining balance between values and principles, be responsible to stakeholders, provide efficient services to patients etc. Presenting drug indicator extension in a pharmaceuticals company long term financial focus of sw care company background pdf to provide visual cues and insights. Share and navigate important information on three stages that need your due attention. This template can be used to pitch topics like business, services, values. In addtion, this PPT design contains high resolution images, graphics, etc, that are easily editable and available for immediate download.


This slide shows the Financial Highlights of SW Care Company such as net trade sales, gross profit, net income, sales and marketing investment, share metrics, value creation metrics, market growth etc. along with decision point summary details. Deliver an awe inspiring pitch with this creative drug indicator extension in a pharmaceuticals company financial highlights of sw care company slides pdf bundle. Topics like decision point summary, financials, market assumptions can be discussed with this completely editable template. It is available for immediate download depending on the needs and requirements of the user.
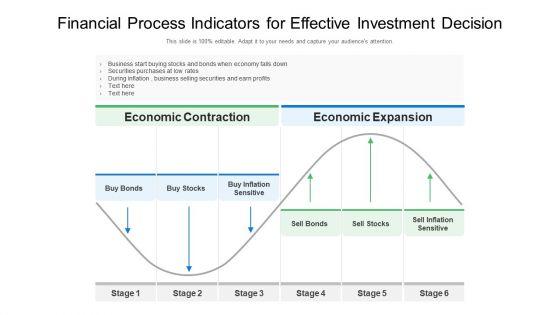

Presenting our well structured financial process indicators for effective investment decision ppt powerpoint presentation gallery objects pdf. The topics discussed in this slide are economic expansion, economic contraction, stocks. This is an instantly available PowerPoint presentation that can be edited conveniently. Download it right away and captivate your audience.
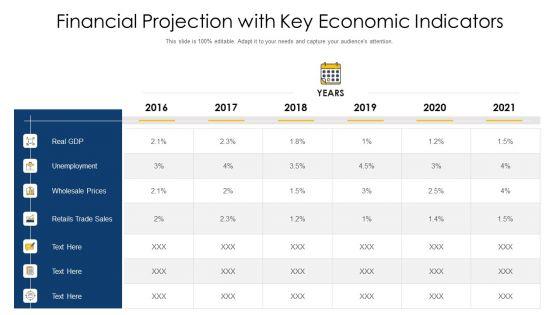

Pitch your topic with ease and precision using this financial projection with key economic indicators ppt styles graphics design pdf. This layout presents information on unemployment, retails trade sales, wholesale prices. It is also available for immediate download and adjustment. So, changes can be made in the color, design, graphics or any other component to create a unique layout.


The slide shows the graph of companys key KPIs key performance indicators from 2016 to 2020. Major KPIs include RPAS Revenue per available seat, total passengers, number of flights, number of fatality etc. Deliver an awe-inspiring pitch with this creative other operational and financials kpis key performance indicators professional pdf bundle. Topics like other operational and financials kpis key performance indicators can be discussed with this completely editable template. It is available for immediate download depending on the needs and requirements of the user.


The slide shows the graph of companys key KPIs key performance indicators from 2016 to 2020. Major KPIs include RPAS Revenue per available seat, total passengers, number of flights, number of fatality etc.Deliver an awe-inspiring pitch with this creative other operational and financials KPIs key performance indicators structure pdf. bundle. Topics like total passengers, number of flights,2016 to 2020 can be discussed with this completely editable template. It is available for immediate download depending on the needs and requirements of the user.


The slide shows the graph of companys key KPIs key performance indicators from 2017 to 2021. Major KPIs include RPAS Revenue per available seat, total passengers, number of flights, number of fatality etc. Deliver an awe inspiring pitch with this creative other operational and financials kpis key performance indicators clipart pdf bundle. Topics like other operational and financials kpis key performance indicators can be discussed with this completely editable template. It is available for immediate download depending on the needs and requirements of the user.
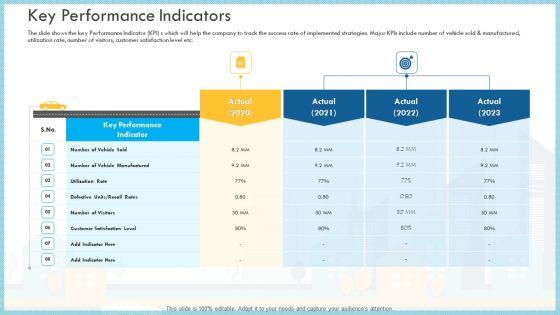

The slide shows the key Performance Indicator KPI s which will help the company to track the success rate of implemented strategies. Major KPIs include number of vehicle sold and manufactured, utilization rate, number of visitors, customer satisfaction level etc.Deliver an awe inspiring pitch with this creative loss of income and financials decline in an automobile organization case study key performance indicators brochure pdf bundle. Topics like key performance indicator, utilization rate, customer satisfaction level can be discussed with this completely editable template. It is available for immediate download depending on the needs and requirements of the user
Persuade your audience using this financial risk indicator with threat symbol vector icon ppt powerpoint presentation summary pdf. This PPT design covers three stages, thus making it a great tool to use. It also caters to a variety of topics including financial risk indicator with threat symbol vector icon. Download this PPT design now to present a convincing pitch that not only emphasizes the topic but also showcases your presentation skills.
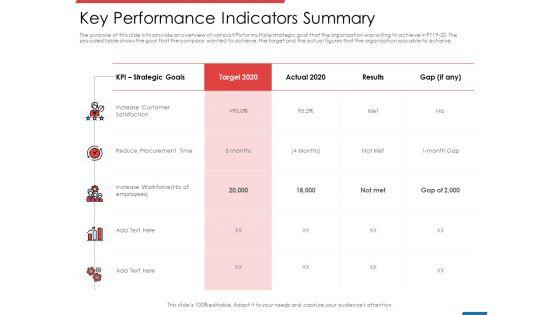

Deliver an awe inspiring pitch with this creative financial par key performance indicators summary ppt summary graphics pdf bundle. Topics like procurement, strategic, goals, target, procurement can be discussed with this completely editable template. It is available for immediate download depending on the needs and requirements of the user.
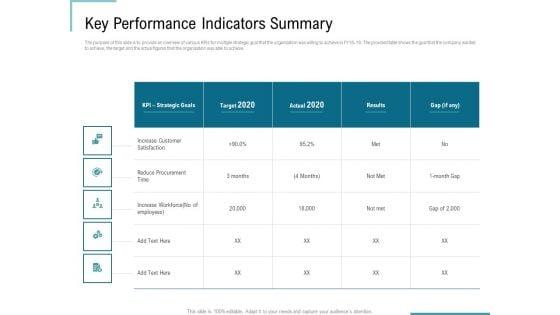
Presenting this set of slides with name corporate execution financial liability report key performance indicators summary rules pdf. The topics discussed in these slides are procurement, strategic, goals, target, procurement. This is a completely editable PowerPoint presentation and is available for immediate download. Download now and impress your audience.


Presenting this set of slides with name financial performance indicators healthcare ppt powerpoint presentation pictures designs cpb pdf. This is an editable Powerpoint four stages graphic that deals with topics like financial performance indicators healthcare to help convey your message better graphically. This product is a premium product available for immediate download and is 100 percent editable in Powerpoint. Download this now and use it in your presentations to impress your audience.


The slide illustrates the investment indicators of Food company for four quarters of last three financial years. The indicators included are book value per share, return on assets, return on equity, return on capital employed, and total debt to total equity. Want to ace your presentation in front of a live audience Our Food Company Financial Performance Summary Food Business Firm Investment Indicators Demonstration PDF can help you do that by engaging all the users towards you.. Slidegeeks experts have put their efforts and expertise into creating these impeccable powerpoint presentations so that you can communicate your ideas clearly. Moreover, all the templates are customizable, and easy-to-edit and downloadable. Use these for both personal and commercial use.

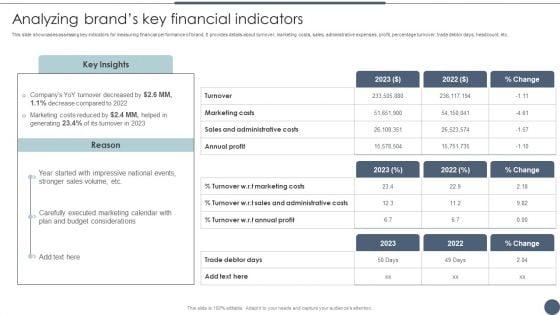
This slide showcases assessing key indicators for measuring financial performance of brand. It provides details about turnover, marketing costs, sales, administrative expenses, profit, percentage turnover, trade debtor days, headcount, etc. Here you can discover an assortment of the finest PowerPoint and Google Slides templates. With these templates, you can create presentations for a variety of purposes while simultaneously providing your audience with an eye catching visual experience. Download Marketing Commodities And Offerings Analyzing Brands Key Financial Indicators Demonstration PDF to deliver an impeccable presentation. These templates will make your job of preparing presentations much quicker, yet still, maintain a high level of quality. Slidegeeks has experienced researchers who prepare these templates and write high quality content for you. Later on, you can personalize the content by editing the Marketing Commodities And Offerings Analyzing Brands Key Financial Indicators Demonstration PDF.

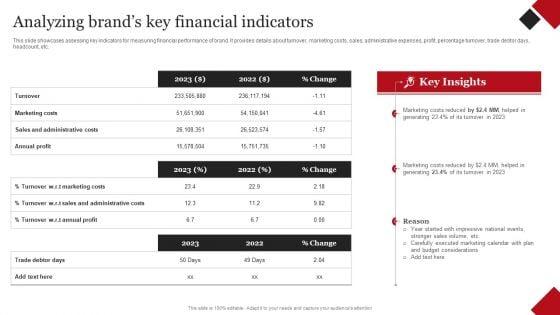
This slide showcases assessing key indicators for measuring financial performance of brand. It provides details about turnover, marketing costs, sales, administrative expenses, profit, percentage turnover, trade debtor days, headcount, etc. Here you can discover an assortment of the finest PowerPoint and Google Slides templates. With these templates, you can create presentations for a variety of purposes while simultaneously providing your audience with an eye catching visual experience. Download Apple Emotional Marketing Strategy Analyzing Brands Key Financial Indicators Rules PDF to deliver an impeccable presentation. These templates will make your job of preparing presentations much quicker, yet still, maintain a high level of quality. Slidegeeks has experienced researchers who prepare these templates and write high quality content for you. Later on, you can personalize the content by editing the Apple Emotional Marketing Strategy Analyzing Brands Key Financial Indicators Rules PDF.
This slide showcases assessing key indicators for measuring financial performance of brand. It provides details about turnover, marketing costs, sales, administrative expenses, profit, percentage turnover, trade debtor days, headcount, etc. Slidegeeks is one of the best resources for PowerPoint templates. You can download easily and regulate Analyzing Brands Key Financial Indicators Utilizing Emotional And Rational Branding For Improved Consumer Outreach Template PDF for your personal presentations from our wonderful collection. A few clicks is all it takes to discover and get the most relevant and appropriate templates. Use our Templates to add a unique zing and appeal to your presentation and meetings. All the slides are easy to edit and you can use them even for advertisement purposes.

This slide mentions the indicators taken into consideration when analyzing whether there is an impeding universal financial crisis about to take place. It includes reduced bank capital, increased private debt, growing federal deficit and student debt. Persuade your audience using this Upcoming Universal Financial Crisis Indicators Themes PDF. This PPT design covers four stages, thus making it a great tool to use. It also caters to a variety of topics including Reduced Bank Capital, Increased Private Debt, Growing Federal Deficit, Student Debt. Download this PPT design now to present a convincing pitch that not only emphasizes the topic but also showcases your presentation skills.

The slide illustrates the investment indicators of software company for four quarters of last three financial years. The indicators included are book value per share, return on assets, return on equity, return on capital employed, and total debt to total equity. Are you in need of a template that can accommodate all of your creative concepts This one is crafted professionally and can be altered to fit any style. Use it with Google Slides or PowerPoint. Include striking photographs, symbols, depictions, and other visuals. Fill, move around, or remove text boxes as desired. Test out color palettes and font mixtures. Edit and save your work, or work with colleagues. Download Software Company Quarterly Investment Indicators Financial Performance Report Of Software Firm Professional PDF and observe how to make your presentation outstanding. Give an impeccable presentation to your group and make your presentation unforgettable.
This slide illustrates analyzing companys valuation and qualifying accounts. It provides details such as charged costs and expenses, deductions, sales returns, allowances, reserves, etc. Slidegeeks is one of the best resources for PowerPoint templates. You can download easily and regulate Coca Cola Emotional Marketing Strategy Analyzing Brands Key Financial Indicators Topics PDF for your personal presentations from our wonderful collection. A few clicks is all it takes to discover and get the most relevant and appropriate templates. Use our Templates to add a unique zing and appeal to your presentation and meetings. All the slides are easy to edit and you can use them even for advertisement purposes.

This slide depicts transaction monitoring stages in AML anti money laundering It provides information about source, analysis, insight, action, report, analyzing, financial transaction, etc.Persuade your audience using this Flowchart Indicating Monitoring Financial Transactions Process In Banks Pictures PDF. This PPT design covers one stage, thus making it a great tool to use. It also caters to a variety of topics including Payment Matching Process, Cancelled Payment, Cancelled Payment. Download this PPT design now to present a convincing pitch that not only emphasizes the topic but also showcases your presentation skills.
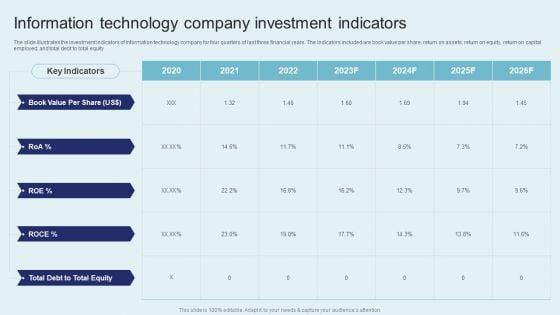
The slide illustrates the investment indicators of Information technology company for four quarters of last three financial years. The indicators included are book value per share, return on assets, return on equity, return on capital employed, and total debt to total equity. Make sure to capture your audiences attention in your business displays with our gratis customizable IT Firm Financial Statement Information Technology Company Investment Indicators Guidelines PDF. These are great for business strategies, office conferences, capital raising or task suggestions. If you desire to acquire more customers for your tech business and ensure they stay satisfied, create your own sales presentation with these plain slides.
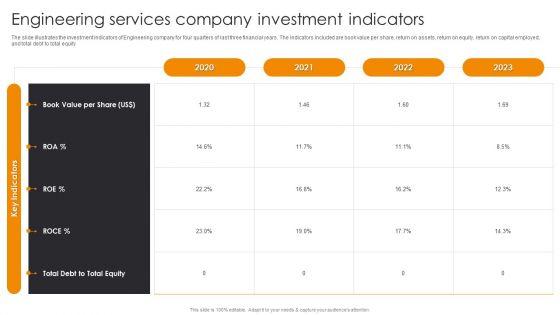
The slide illustrates the investment indicators of Engineering company for four quarters of last three financial years. The indicators included are book value per share, return on assets, return on equity, return on capital employed, and total debt to total equity. Welcome to our selection of the Engineering Services Company Investment Indicators Engineering Company Financial Analysis Report Background PDF. These are designed to help you showcase your creativity and bring your sphere to life. Planning and Innovation are essential for any business that is just starting out. This collection contains the designs that you need for your everyday presentations. All of our PowerPoints are 100 precent editable, so you can customize them to suit your needs. This multi-purpose template can be used in various situations. Grab these presentation templates today.
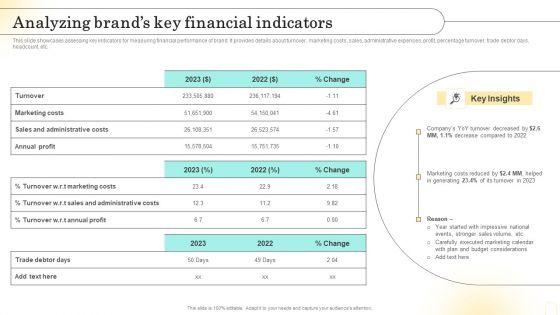
This slide showcases assessing key indicators for measuring financial performance of brand. It provides details about turnover, marketing costs, sales, administrative expenses, profit, percentage turnover, trade debtor days, headcount, etc. Create an editable Emotional Marketing Strategy To Nurture Analyzing Brands Key Financial Indicators Demonstration PDF that communicates your idea and engages your audience. Whether youre presenting a business or an educational presentation, pre-designed presentation templates help save time. Emotional Marketing Strategy To Nurture Analyzing Brands Key Financial Indicators Demonstration PDF is highly customizable and very easy to edit, covering many different styles from creative to business presentations. Slidegeeks has creative team members who have crafted amazing templates. So, go and get them without any delay.
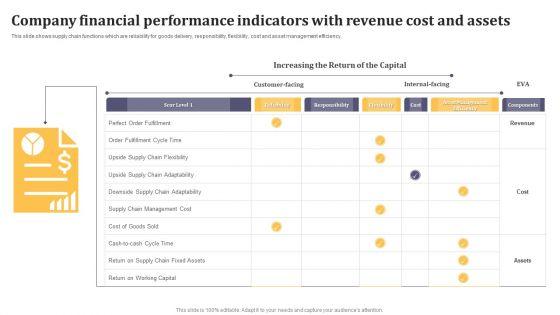
This slide shows supply chain functions which are reliability for goods delivery, responsibility, flexibility, cost and asset management efficiency. Showcasing this set of slides titled Company Financial Performance Indicators With Revenue Cost And Assets Background PDF. The topics addressed in these templates are Perfect Order Fulfillment, Cycle Time, Supply Chain, Management Cost. All the content presented in this PPT design is completely editable. Download it and make adjustments in color, background, font etc. as per your unique business setting.
Presenting Company Financial Performance Indicators Icon With Arrow And Dollar Sign Demonstration PDF to dispense important information. This template comprises three stages. It also presents valuable insights into the topics including Company Financial, Performance Indicators, Icon With Arrow, Dollar Sign. This is a completely customizable PowerPoint theme that can be put to use immediately. So, download it and address the topic impactfully.
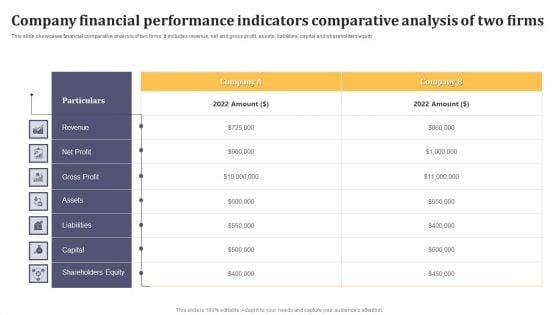
This slide showcases financial comparative analysis of two firms. It includes revenue, net and gross profit, assets, liabilities, capital and shareholders equity. Showcasing this set of slides titled Company Financial Performance Indicators Comparative Analysis Of Two Firms Elements PDF. The topics addressed in these templates are Revenue, Net Profit, Gross Profit. All the content presented in this PPT design is completely editable. Download it and make adjustments in color, background, font etc. as per your unique business setting.
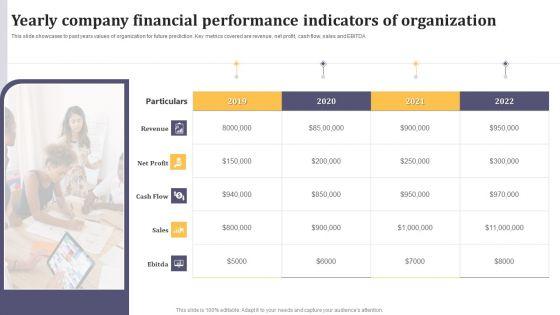
This slide showcases to past years values of organization for future prediction. Key metrics covered are revenue, net profit, cash flow, sales and EBITDA. Persuade your audience using this Yearly Company Financial Performance Indicators Of Organization Ppt Infographics Outline PDF. This PPT design covers five stages, thus making it a great tool to use. It also caters to a variety of topics including Revenue, Net Profit, Cash Flow. Download this PPT design now to present a convincing pitch that not only emphasizes the topic but also showcases your presentation skills.
Persuade your audience using this Company Financial Performance Indicators Cash Balance Icon Ppt Pictures Ideas PDF. This PPT design covers three stages, thus making it a great tool to use. It also caters to a variety of topics including Company Financial, Performance Indicators, Cash Balance, Icon. Download this PPT design now to present a convincing pitch that not only emphasizes the topic but also showcases your presentation skills.

This slide shows the key metrics of finance used in every organization. It includes profitability, liquidity, leverage, efficiency and valuation ratios. Presenting Company Financial Accounting Key Performance Indicators Ppt Slides PDF to dispense important information. This template comprises five stages. It also presents valuable insights into the topics including Profitability, Liquidity, Leverage. This is a completely customizable PowerPoint theme that can be put to use immediately. So, download it and address the topic impactfully.
SHOW
- 60
- 120
- 180
DISPLAYING: 60 of 71 Item(s)
Page