AI PPT Maker
Templates
PPT Bundles
Design Services
Business PPTs
Business Plan
Management
Strategy
Introduction PPT
Roadmap
Self Introduction
Timelines
Process
Marketing
Agenda
Technology
Medical
Startup Business Plan
Cyber Security
Dashboards
SWOT
Proposals
Education
Pitch Deck
Digital Marketing
KPIs
Project Management
Product Management
Artificial Intelligence
Target Market
Communication
Supply Chain
Google Slides
Research Services
 One Pagers
All Categories
Graphical performance PowerPoint Presentation Templates and Google Slides
SHOW
- 60
- 120
- 180
DISPLAYING: 60 of 579 Item(s)
Page


Slide 1 of 7
This is a performance management guidelines powerpoint graphics. This is a five stage process. The stages in this process are competency integration, kpi, business objectives linkage, recognition, total compensation.


Slide 1 of 7
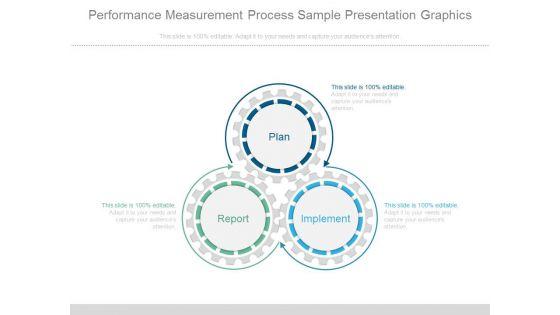
This is a performance measurement process sample presentation graphics. This is a three stage process. The stages in this process are plan, report, implement.


Slide 1 of 7
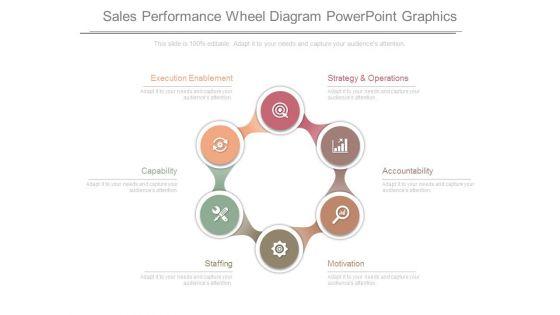
This is a sales performance wheel diagram powerpoint graphics. This is a six stage process. The stages in this process are strategy and operations, accountability, motivation, staffing, capability, execution enablement.


Slide 1 of 7
This is a high performance coaching template powerpoint graphics. This is a three stage process. The stages in this process are choices, achievement, direction, beliefs, resources, motivation.


Slide 1 of 7
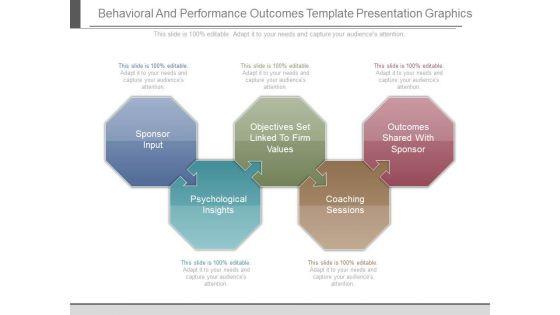
This is a behavioral and performance outcomes template presentation graphics. This is a five stage process. The stages in this process are sponsor input, psychological insights, objectives set linked to firm values, coaching sessions, outcomes shared with sponsor.


Slide 1 of 7
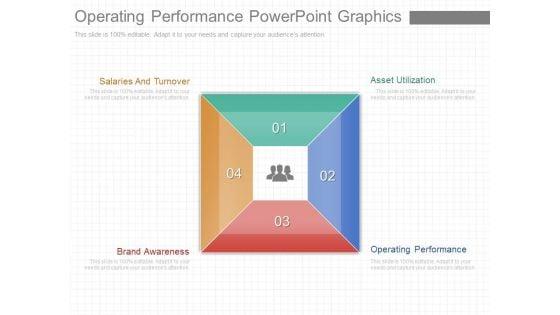
This is a operating performance powerpoint graphics. This is a four stage process. The stages in this process are salaries and turnover, brand awareness, asset utilization, operating performance.


Slide 1 of 6
Presenting this set of slides with name metrics performance benchmark ppt powerpoint presentation outline graphics template cpb. This is a three stage process. The stages in this process are metrics performance benchmark. This is a completely editable PowerPoint presentation and is available for immediate download. Download now and impress your audience.
Slide 1 of 6
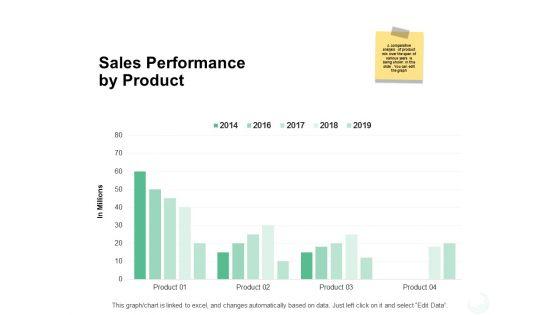
Presenting this set of slides with name sales performance by product ppt powerpoint presentation outline graphics download. The topics discussed in these slides are finance, marketing, management, investment, analysis. This is a completely editable PowerPoint presentation and is available for immediate download. Download now and impress your audience.
Slide 1 of 6
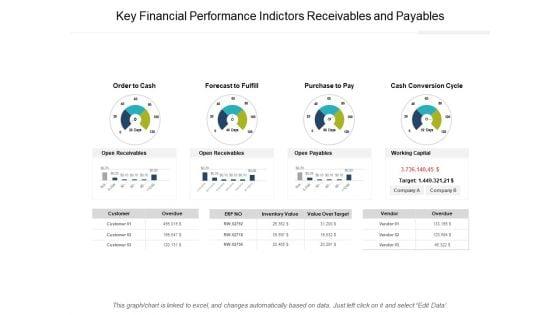
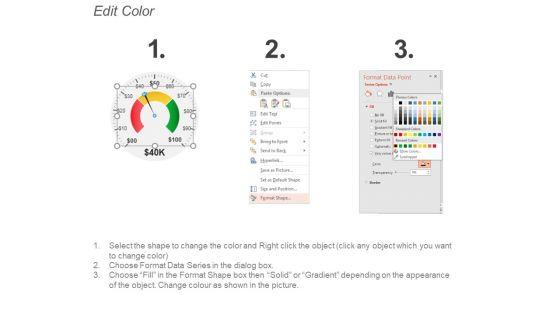
Presenting this set of slides with name key financial performance indictors receivables and payables ppt powerpoint presentation layouts graphics example. The topics discussed in these slides are cash flow, fund flow, trading cycle. This is a completely editable PowerPoint presentation and is available for immediate download. Download now and impress your audience.


Slide 1 of 6
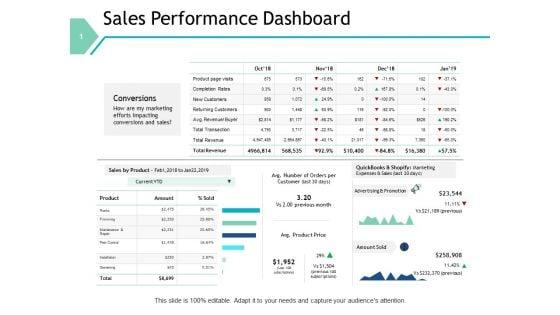
This is a sales performance dashboard marketing ppt powerpoint presentation slides graphics design. This is a four stage process. The stages in this process are compare, marketing, business, management, planning.
Slide 1 of 6
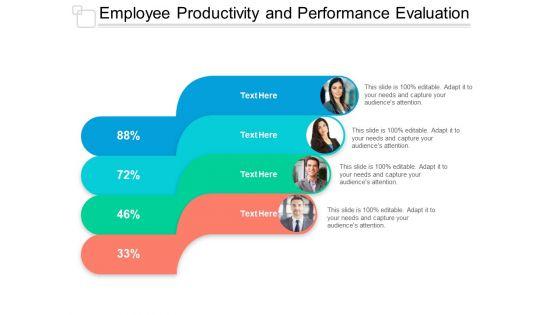
This is a employee productivity and performance evaluation ppt powerpoint presentation professional graphics. This is a four stage process. The stages in this process are employee engagement, employee performance, employee evaluation.



Slide 1 of 6
This is a cost performance index ppt powerpoint presentation inspiration graphics example. This is a three stage process. The stages in this process are business, management, marketing, percentage, product.
Slide 1 of 5
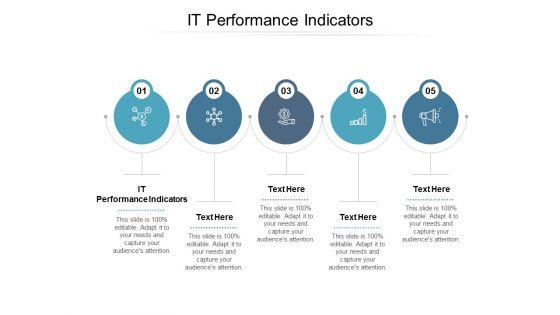
Presenting this set of slides with name it performance indicators ppt powerpoint presentation styles graphic tips cpb. This is an editable Powerpoint five stages graphic that deals with topics like it performance indicators to help convey your message better graphically. This product is a premium product available for immediate download and is 100 percent editable in Powerpoint. Download this now and use it in your presentations to impress your audience.


Slide 1 of 5
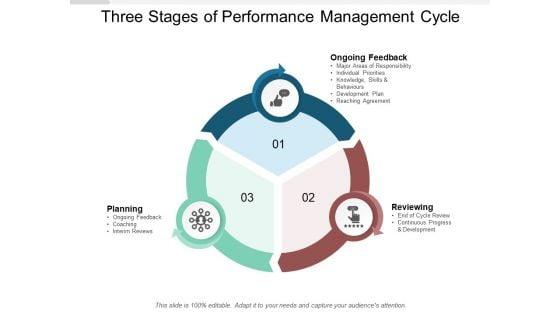
Presenting this set of slides with name three stages of performance management cycle ppt powerpoint presentation inspiration graphic tips. This is a three stage process. The stages in this process are annual performance review, process, business performance. This is a completely editable PowerPoint presentation and is available for immediate download. Download now and impress your audience.


Slide 1 of 5
Presenting this set of slides with name project performance management system ppt powerpoint presentation outline graphics download. This is a five stage process. The stages in this process are project funnel, performance management, planning. This is a completely editable PowerPoint presentation and is available for immediate download. Download now and impress your audience.
Slide 1 of 5
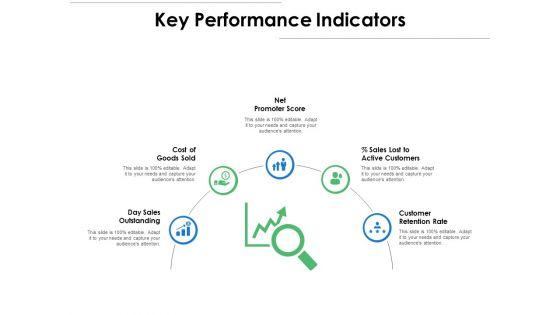
Presenting this set of slides with name key performance indicators ppt powerpoint presentation show graphics design. This is a five stage process. The stages in this process are business, management, planning, strategy, marketing. This is a completely editable PowerPoint presentation and is available for immediate download. Download now and impress your audience.


Slide 1 of 5
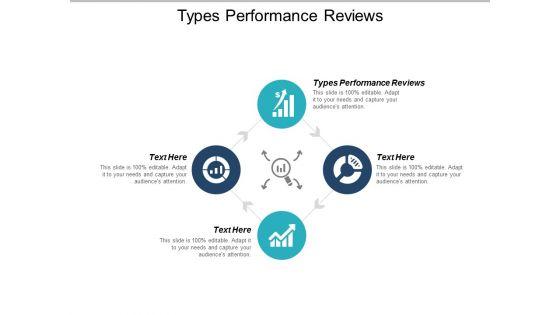
Presenting this set of slides with name types performance reviews ppt powerpoint presentation infographics graphics cpb. This is an editable Powerpoint four stages graphic that deals with topics like types performance reviews to help convey your message better graphically. This product is a premium product available for immediate download and is 100 percent editable in Powerpoint. Download this now and use it in your presentations to impress your audience.



Slide 1 of 5
Presenting this set of slides with name measuring individual performance ppt powerpoint presentation layouts graphics template cpb. This is an editable Powerpoint five stages graphic that deals with topics like measuring individual performance to help convey your message better graphically. This product is a premium product available for immediate download and is 100 percent editable in Powerpoint. Download this now and use it in your presentations to impress your audience.


Slide 1 of 5
Presenting this set of slides with name employee performance report ppt powerpoint presentation slides graphics download cpb. This is an editable Powerpoint two stages graphic that deals with topics like employee performance report to help convey your message better graphically. This product is a premium product available for immediate download and is 100 percent editable in Powerpoint. Download this now and use it in your presentations to impress your audience.


Slide 1 of 5
Presenting this set of slides with name employee management performance ppt powerpoint presentation portfolio graphics pictures cpb. This is an editable Powerpoint four stages graphic that deals with topics like employee management performance to help convey your message better graphically. This product is a premium product available for immediate download and is 100 percent editable in Powerpoint. Download this now and use it in your presentations to impress your audience.


Slide 1 of 5
Presenting this set of slides with name financial performance key trends ppt powerpoint presentation pictures graphic tips. This is a seven stage process. The stages in this process are affiliations, financial, investments, avoid overbuilding, data analytics. This is a completely editable PowerPoint presentation and is available for immediate download. Download now and impress your audience.


Slide 1 of 5
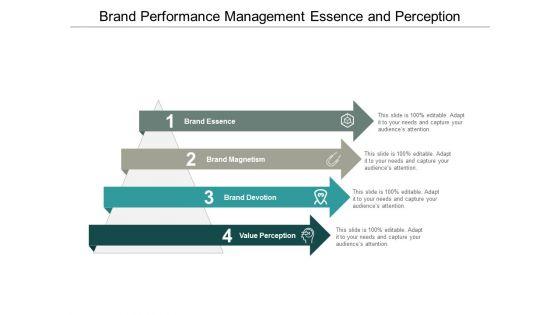
Presenting this set of slides with name brand performance management essence and perception ppt powerpoint presentation inspiration graphics template. This is a four stage process. The stages in this process are brand tracking, brand awareness research, brand equity. This is a completely editable PowerPoint presentation and is available for immediate download. Download now and impress your audience.


Slide 1 of 5
Presenting this set of slides with name thank you staff performance assessment and planning ppt powerpoint presentation gallery graphics pictures. This is a one stage process. The stages in this process are thank you. This is a completely editable PowerPoint presentation and is available for immediate download. Download now and impress your audience.

Slide 1 of 5
Presenting this set of slides with name thank you performance analysis in energy sector ppt powerpoint presentation slides graphic tips. This is a one stage process. The stages in this process are thank you. This is a completely editable PowerPoint presentation and is available for immediate download. Download now and impress your audience.

Slide 1 of 5
Presenting this set of slides with name productivity performance ppt powerpoint presentation infographic template graphics download cpb. This is a two stage process. The stages in this process are productivity performance. This is a completely editable PowerPoint presentation and is available for immediate download. Download now and impress your audience.
Slide 1 of 5
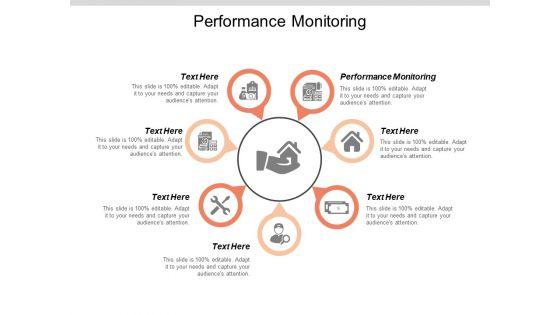
Presenting this set of slides with name performance monitoring ppt powerpoint presentation professional graphics pictures cpb. This is a seven stage process. The stages in this process are performance monitoring. This is a completely editable PowerPoint presentation and is available for immediate download. Download now and impress your audience.


Slide 1 of 5
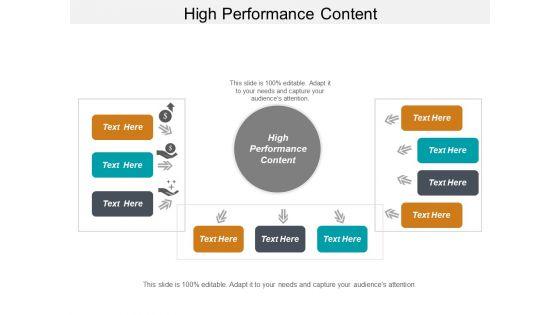
Presenting this set of slides with name high performance content ppt powerpoint presentation outline graphics example cpb. The topics discussed in these slides are high performance content. This is a completely editable PowerPoint presentation and is available for immediate download. Download now and impress your audience.


Slide 1 of 5
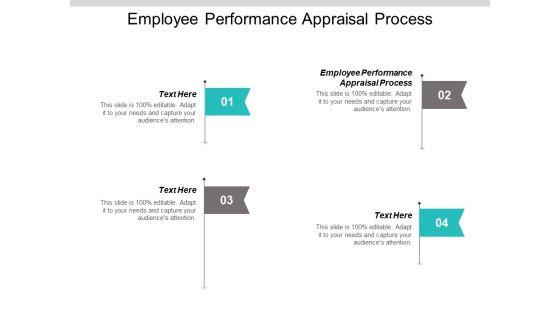
Presenting this set of slides with name employee performance appraisal process ppt powerpoint presentation layouts graphics download cpb. This is a four stage process. The stages in this process are employee performance appraisal process. This is a completely editable PowerPoint presentation and is available for immediate download. Download now and impress your audience.
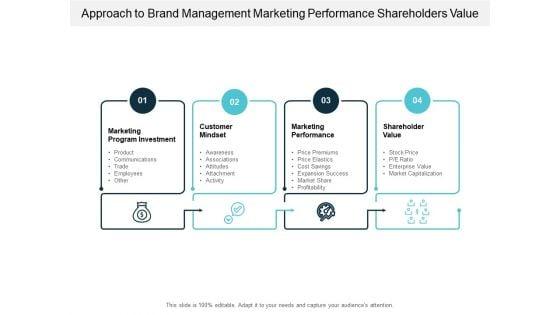


Slide 1 of 5
Presenting this set of slides with name approach to brand management marketing performance shareholders value ppt powerpoint presentation pictures graphic tips. This is a four stage process. The stages in this process are brand value chain, brand equity management, processing. This is a completely editable PowerPoint presentation and is available for immediate download. Download now and impress your audience.

Slide 1 of 5
This is a performance media placement ppt powerpoint presentation show graphics design cpb. This is a five stage process. The stages in this process are performance media placement.
Slide 1 of 5
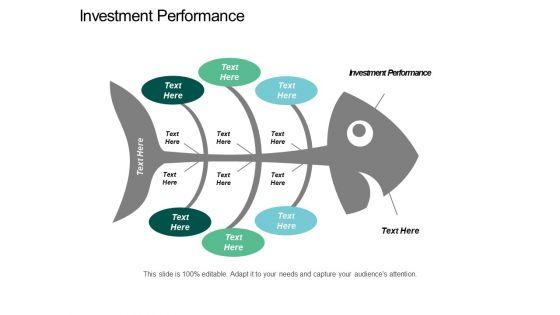
This is a investment performance ppt powerpoint presentation infographics graphic images cpb. This is a six stage process. The stages in this process are investment performance.
Slide 1 of 5
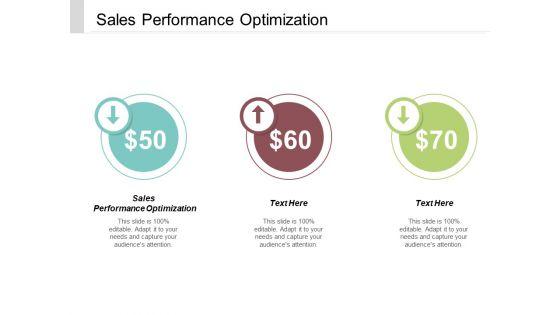
This is a sales performance optimization ppt powerpoint presentation slides graphics cpb. This is a three stage process. The stages in this process are sales performance optimization.



Slide 1 of 5
This is a business process performance management ppt powerpoint presentation outline graphics pictures cpb. This is a six stage process. The stages in this process are business process performance management.
Slide 1 of 5
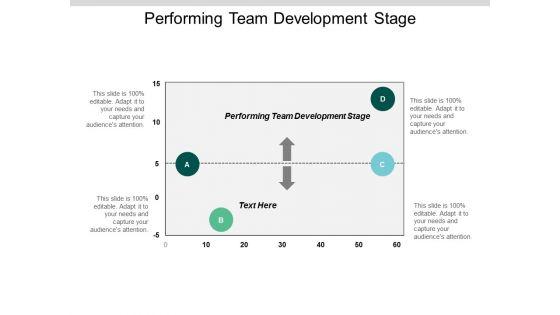
This is a performing team development stage ppt powerpoint presentation show graphics tutorials cpb. This is a four stage process. The stages in this process are performing team development stage.


Slide 1 of 5
This is a thank you closing the strategy to performance gap ppt powerpoint presentation styles graphic tips. This is a one stage process. The stages in this process are thank you, risk matrix business, management, planning, strategy.

Slide 1 of 5
This is a product performance management ppt powerpoint presentation slides graphics download cpb. This is a four stage process. The stages in this process are product performance management.


Slide 1 of 5
This is a performance evaluation system potential assessment ppt powerpoint presentation layouts graphics pictures. This is a nine stage process. The stages in this process are employee engagement, employee performance, employee evaluation.


Slide 1 of 5
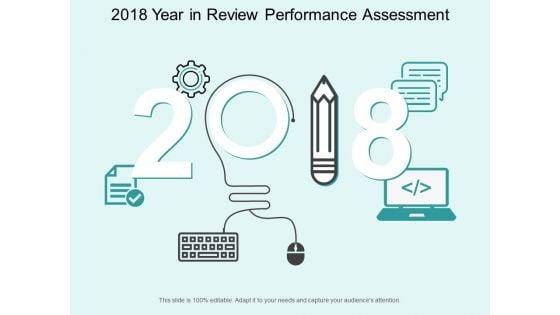
This is a 2018 year in review performance assessment ppt powerpoint presentation layouts graphics example. This is a four stage process. The stages in this process are year in review, yearly highlights, countdowns.


Slide 1 of 5
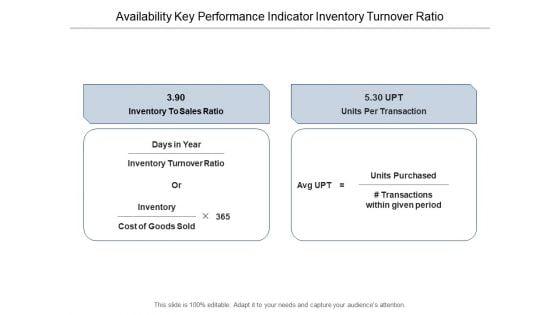
This is a availability key performance indicator inventory turnover ratio ppt powerpoint presentation layouts graphics download. This is a two stage process. The stages in this process are availability kpi, availability dashboard, availability metrics.
Slide 1 of 5
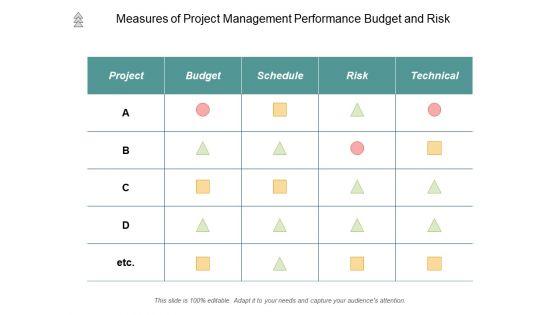
This is a measures of project management performance budget and risk ppt powerpoint presentation outline graphics design. This is a four stage process. The stages in this process are project dashboard, project kpis, project metrics.

Slide 1 of 5
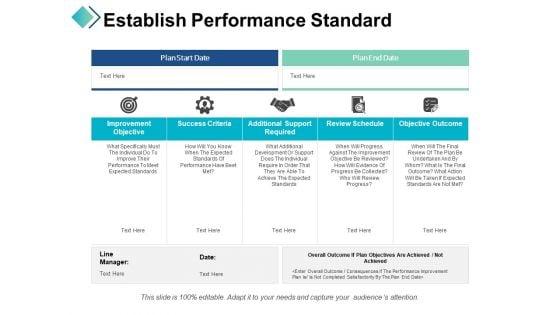
This is a establish performance standard ppt powerpoint presentation show graphics template. This is a five stage process. The stages in this process are.



Slide 1 of 5
This is a performance evaluation review guidelines ppt powerpoint presentation gallery graphic images. This is a five stage process. The stages in this process are management, strategy, analysis, business, marketing.


Slide 1 of 5
This is a business performance management tools ppt powerpoint presentation show graphics cpb. This is a thirteen stage process. The stages in this process are business performance management tools.


Slide 1 of 5
This is a project progress work performance report ppt powerpoint presentation professional graphics template. This is a five stage process. The stages in this process are weekly progress reports, weekly performance reports, weekly progress tracking.


Slide 1 of 5
This is a benchmarking tools performance knowledge competence vision development ppt powerpoint presentation portfolio graphics pictures. This is a eight stage process. The stages in this process are best practice, best technique, best procedure.


Slide 1 of 5
This is a performance bonus plans ppt powerpoint presentation layouts graphics example. This is a three stage process. The stages in this process are performance bonus plans.



Slide 1 of 5
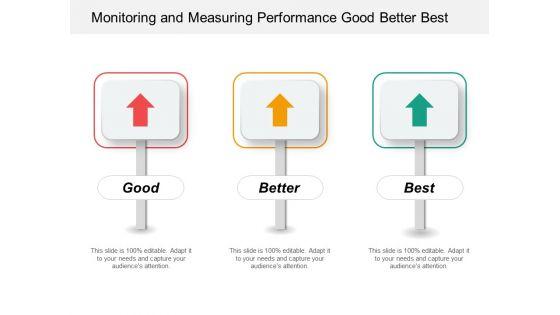
This is a monitoring and measuring performance good better best ppt powerpoint presentation gallery graphics. This is a three stage process. The stages in this process are good better best, good great superb, good great excellent.
Slide 1 of 5
This is a performance indicators of business icons ppt powerpoint presentation infographics graphics template. This is a four stage process. The stages in this process are dashboard, kpi, metrics.


Slide 1 of 5
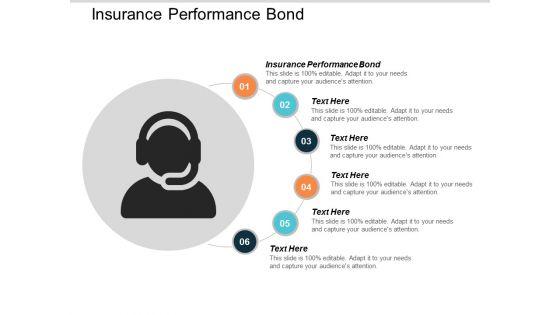
This is a insurance performance bond ppt powerpoint presentation infographic template graphics cpb. This is a six stage process. The stages in this process are insurance performance bond.



Slide 1 of 5
Daily Weekly Monthly Performance Management Plan Ppt Powerpoint Presentation Gallery Graphics Design
This is a daily weekly monthly performance management plan ppt powerpoint presentation gallery graphics design. This is a three stage process. The stages in this process are six sigma, operating rhythm, business rhythm.

Slide 1 of 5
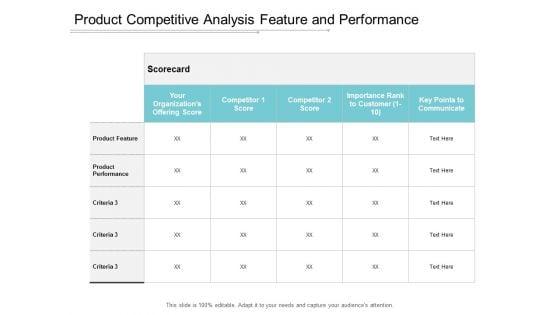
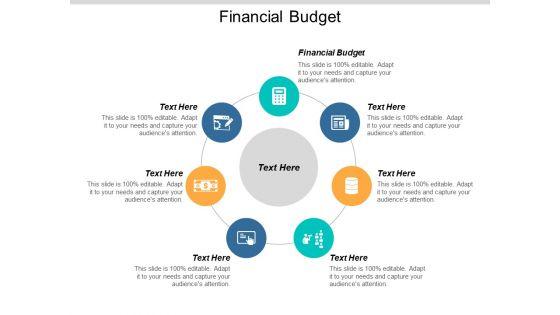
This is a product competitive analysis feature and performance ppt powerpoint presentation show graphics design. This is a five stage process. The stages in this process are competitive analysis, product differentiation, product competition.


Slide 1 of 5
This is a performance evaluation of order cycle ppt powerpoint presentation layouts graphics. This is a seven stage process. The stages in this process are supply chain management, order fulfilment.
Slide 1 of 5
This is a performance compensation ppt powerpoint presentation portfolio graphic tips cpb. This is a seven stage process. The stages in this process are performance compensation.


Slide 1 of 5
This is a employee performance review form ppt powerpoint presentation infographics graphic images cpb. This is a one stage process. The stages in this process are employee performance review form.


Slide 1 of 5
This is a continuous performance monitoring assessment and review ppt powerpoint presentation pictures graphic images. This is a four stage process. The stages in this process are monitoring controls, continuous controls, ccm.


Slide 1 of 5
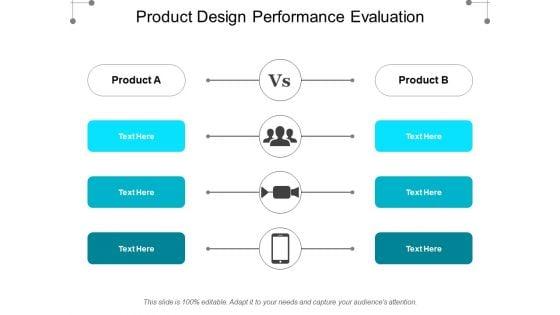
This is a product design performance evaluation ppt powerpoint presentation inspiration graphic images. This is a two stage process. The stages in this process are compare, comparison of two, competitive analysis.


Slide 1 of 5
This is a performance dashboard ppt powerpoint presentation model graphics example. This is a four stage process. The stages in this process are finance, marketing, analysis, business, investment.
Slide 1 of 5
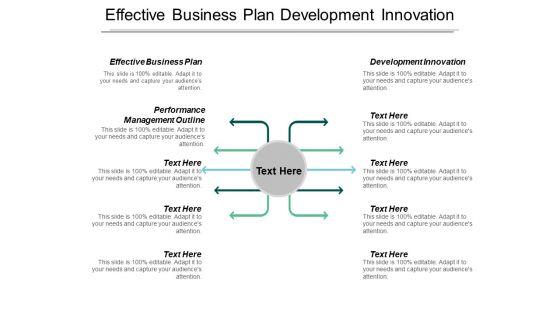
This is a effective business plan development innovation performance management outline ppt powerpoint presentation outline graphics design. This is a ten stage process. The stages in this process are effective business plan, development innovation, performance management outline.
Slide 1 of 5
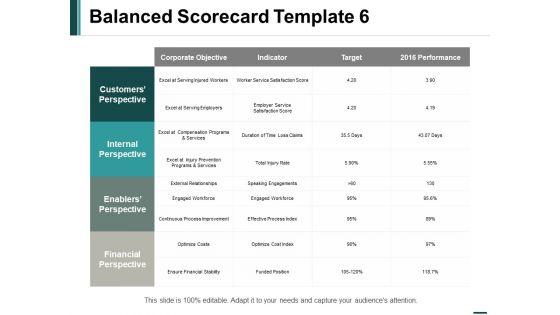
This is a balanced scorecard performance ppt powerpoint presentation professional graphics template. This is a four stage process. The stages in this process are business, management, strategy, marketing, financial.
Slide 1 of 5
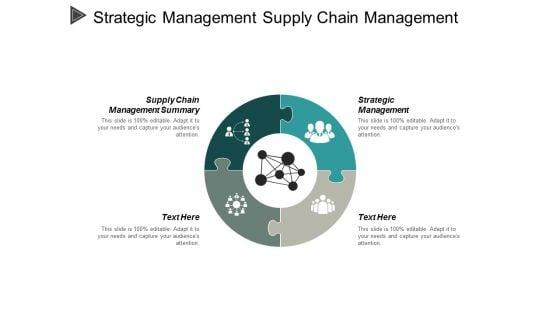
This is a strategic management supply chain management summary performance management ppt powerpoint presentation outline graphics. This is a four stage process. The stages in this process are strategic management, supply chain management summary, performance management.
SHOW
- 60
- 120
- 180
DISPLAYING: 60 of 579 Item(s)
Page
