AI PPT Maker
Templates
PPT Bundles
Design Services
Business PPTs
Business Plan
Management
Strategy
Introduction PPT
Roadmap
Self Introduction
Timelines
Process
Marketing
Agenda
Technology
Medical
Startup Business Plan
Cyber Security
Dashboards
SWOT
Proposals
Education
Pitch Deck
Digital Marketing
KPIs
Project Management
Product Management
Artificial Intelligence
Target Market
Communication
Supply Chain
Google Slides
Research Services
 One Pagers
All Categories
Investment-chart PowerPoint Presentation Templates and Google Slides
16 Item(s)




Slide 1 of 7
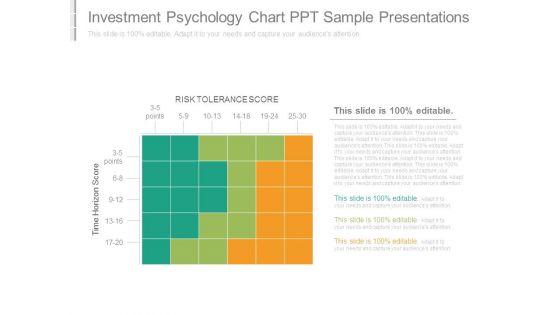
This is a investment psychology chart ppt sample presentations. This is a three stage process. The stages in this process are risk tolerance score, time horizon score.




Slide 1 of 7
This is a return on investment triangle chart ppt slides download. This is a three stage process. The stages in this process are cost, roi, time.


Slide 1 of 7
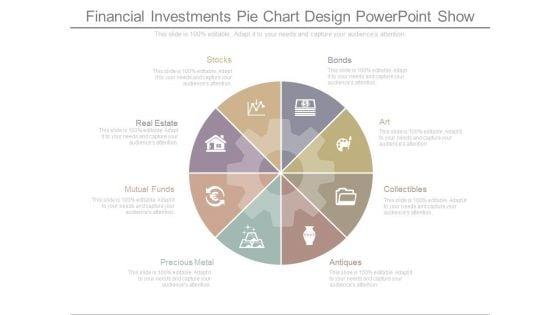
This is a financial investments pie chart design powerpoint show. This is a eight stage process. The stages in this process are stocks, real estate, mutual funds, precious metal, bonds, art, collectibles, antiques.


Slide 1 of 7
This is a wealth investment process chart ppt model. This is a six stage process. The stages in this process are investment committee, review of all portfolio, review of all mutual funds, client life goals and planning goals, analysis of intermediate, asset class weighting policy, buy and sell procedure.
Slide 1 of 7
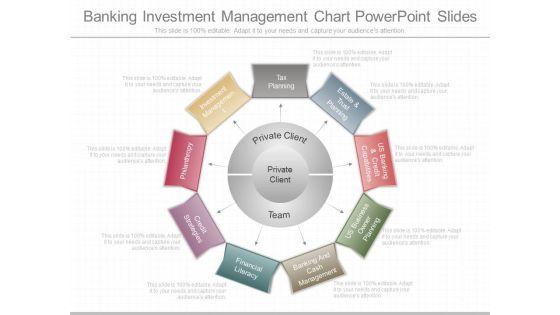
This is a banking investment management chart powerpoint slides. This is a nine stage process. The stages in this process are tax planning, estate and trust planning, us banking and credit capabilities, us business owner planning, banking and cash management, financial literacy, credit strategies, philanthropy, investment management, private client, private client, team.


Slide 1 of 5
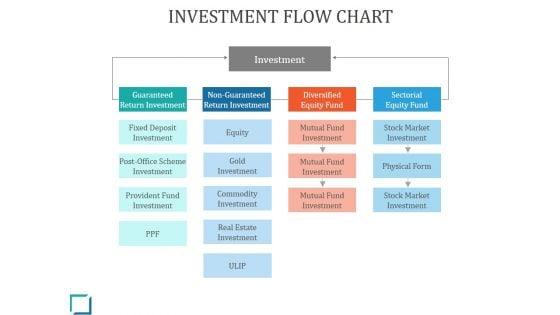
This is a investment flow chart ppt powerpoint presentation themes. This is a five stage process. The stages in this process are investment, equity, gold investment, physical form, provident fund investment.
Slide 1 of 4
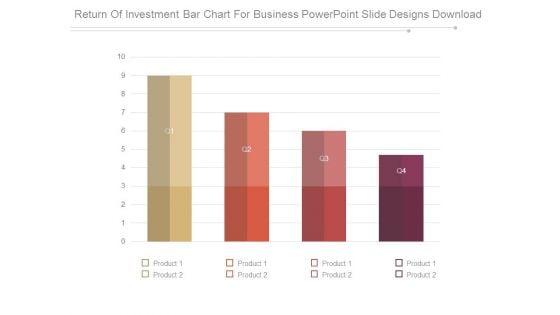
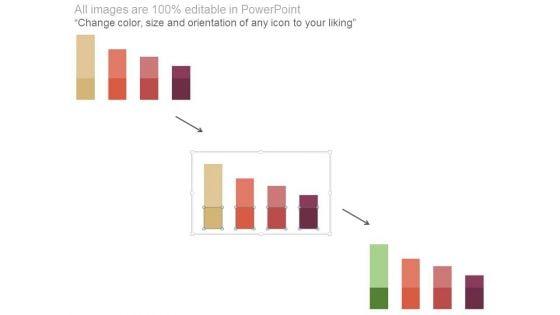
This is a return of investment bar chart for business powerpoint slide designs download. This is a four stage process. The stages in this process are product.


Slide 1 of 2
The following slide shows equity crowdfunding chart indicating funds raised by firms in USA and united kingdom UK. This data can be referred by international investors to analyze about growth of this industry, which furthermore will attract a greater number of interested parties from various nations.Showcasing this set of slides titled Investment Crowdfunding Chart Indicating Funds Raised By Firms Demonstration PDF. The topics addressed in these templates are Crowdfunding Witnessed, United Kingdom, Companies Raise. All the content presented in this PPT design is completely editable. Download it and make adjustments in color, background, font etc. as per your unique business setting.
Slide 1 of 2
Persuade your audience using this financial planning with investment chart vector icon inspiration pdf. This PPT design covers three stages, thus making it a great tool to use. It also caters to a variety of topics including financial planning with investment chart vector icon. Download this PPT design now to present a convincing pitch that not only emphasizes the topic but also showcases your presentation skills.
Slide 1 of 2
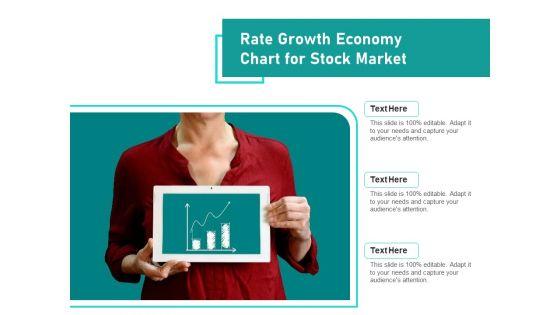
Persuade your audience using this woman holding rate growth investment chart on mobile tablet ppt powerpoint presentation model guide pdf. This PPT design covers one stages, thus making it a great tool to use. It also caters to a variety of topics including woman holding rate growth investment chart on mobile tablet. Download this PPT design now to present a convincing pitch that not only emphasizes the topic but also showcases your presentation skills.
Slide 1 of 2
Persuade your audience using this money investment growth chart vector icon ppt powerpoint presentation slides influencers pdf. This PPT design covers three stages, thus making it a great tool to use. It also caters to a variety of topics including money investment growth chart vector icon. Download this PPT design now to present a convincing pitch that not only emphasizes the topic but also showcases your presentation skills.
Slide 1 of 2
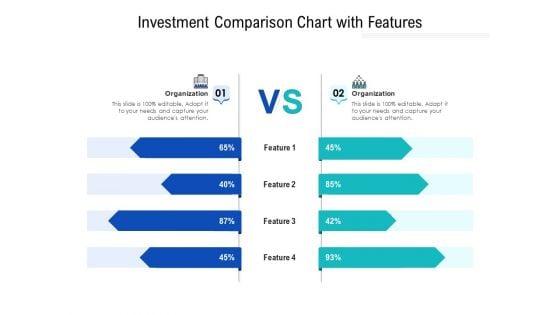
Persuade your audience using this investment comparison chart with features ppt powerpoint presentation file structure pdf. This PPT design covers two stages, thus making it a great tool to use. It also caters to a variety of topics including investment comparison chart with features. Download this PPT design now to present a convincing pitch that not only emphasizes the topic but also showcases your presentation skills.
Slide 1 of 2
Presenting this set of slides with name trading and investment business chart vector icon ppt powerpoint presentation portfolio visuals pdf. This is a three stage process. The stages in this process are trading and investment business chart vector icon. This is a completely editable PowerPoint presentation and is available for immediate download. Download now and impress your audience.


Slide 1 of 2
Presenting this set of slides with name seed investment column chart ppt pictures designs pdf. The topics discussed in these slides are product 1, product 2. This is a completely editable PowerPoint presentation and is available for immediate download. Download now and impress your audience.


Slide 1 of 2
Presenting this set of slides with name emotional investing chart ppt powerpoint presentation portfolio model cpb pdf. This is an editable Powerpoint one stages graphic that deals with topics like emotional investing chart to help convey your message better graphically. This product is a premium product available for immediate download and is 100 percent editable in Powerpoint. Download this now and use it in your presentations to impress your audience.


Slide 1 of 10
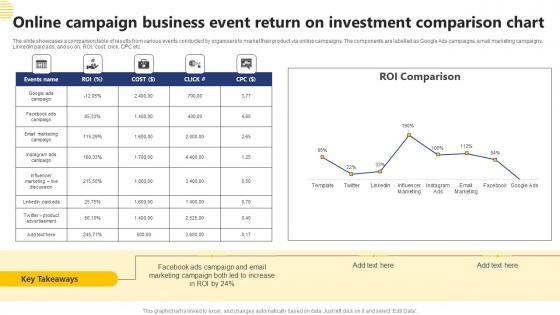
The slide showcases a comparison table of results from various events conducted by organisers to market their product via online campaigns. The components are labelled as Google Ads campaigns, email marketing campaigns, LinkedIn paid ads, and so on. ROI, cost, click, CPC etc. Pitch your topic with ease and precision using this Online Campaign Business Event Return On Investment Comparison Chart Demonstration Pdf This layout presents information on Google Ads Campaign, Email Marketing Campaign It is also available for immediate download and adjustment. So, changes can be made in the color, design, graphics or any other component to create a unique layout. The slide showcases a comparison table of results from various events conducted by organisers to market their product via online campaigns. The components are labelled as Google Ads campaigns, email marketing campaigns, LinkedIn paid ads, and so on. ROI, cost, click, CPC etc.
16 Item(s)
