AI PPT Maker
Templates
PPT Bundles
Design Services
Business PPTs
Business Plan
Management
Strategy
Introduction PPT
Roadmap
Self Introduction
Timelines
Process
Marketing
Agenda
Technology
Medical
Startup Business Plan
Cyber Security
Dashboards
SWOT
Proposals
Education
Pitch Deck
Digital Marketing
KPIs
Project Management
Product Management
Artificial Intelligence
Target Market
Communication
Supply Chain
Google Slides
Research Services
 One Pagers
All Categories
Information Visuals PowerPoint Presentation Templates and Google Slides
34 Item(s)





Slide 1 of 47
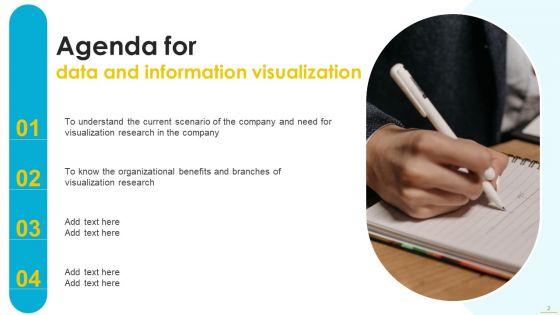
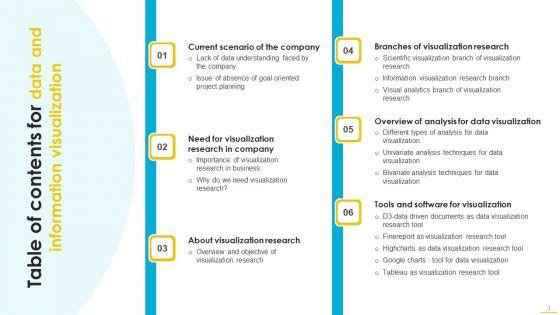
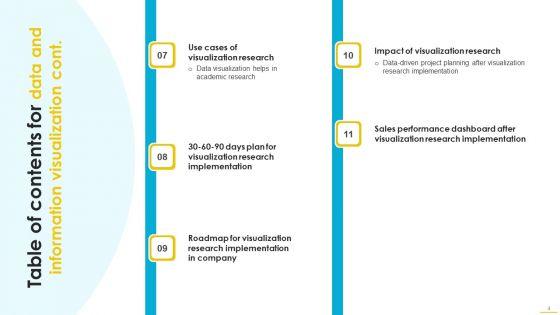
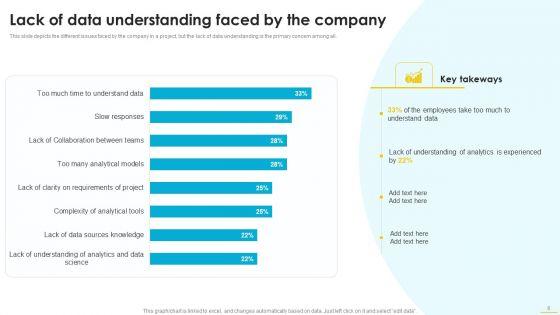
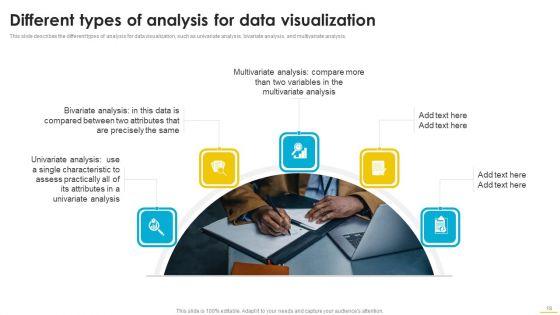
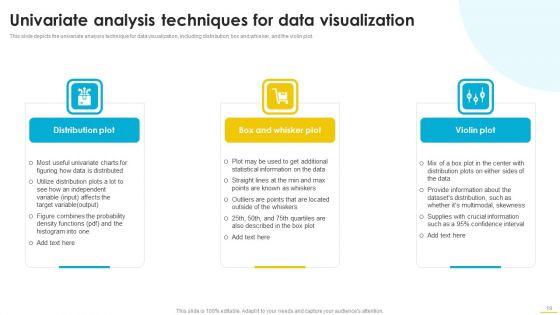
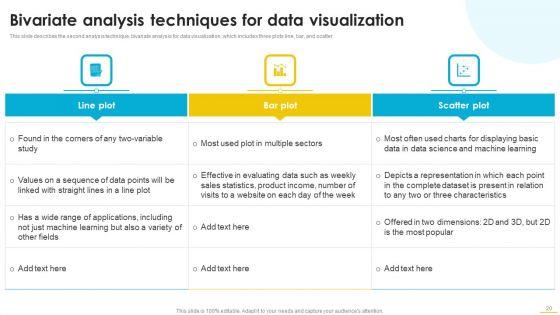
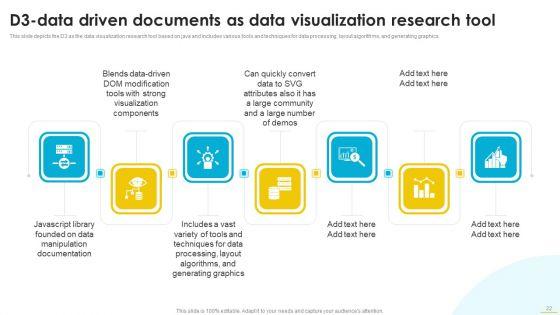
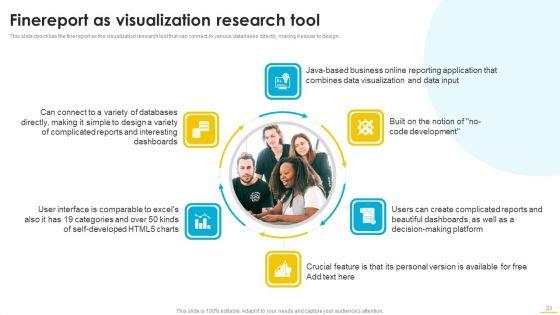
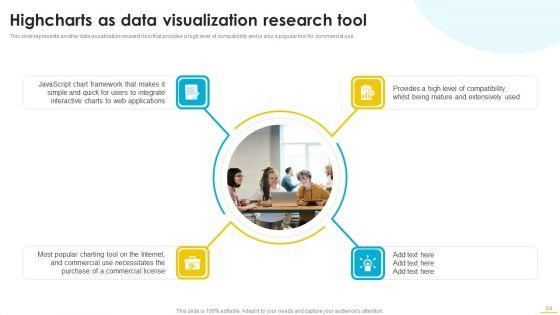
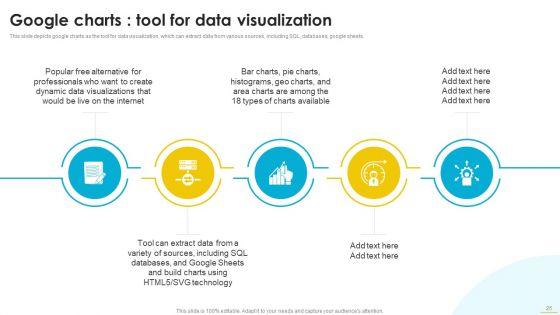
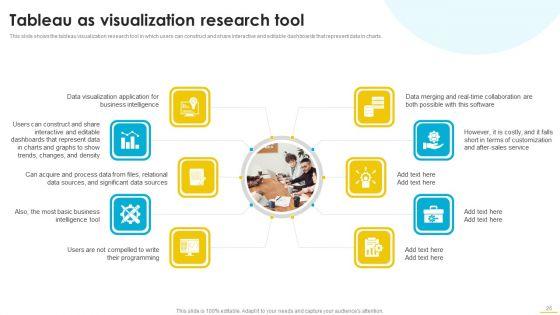
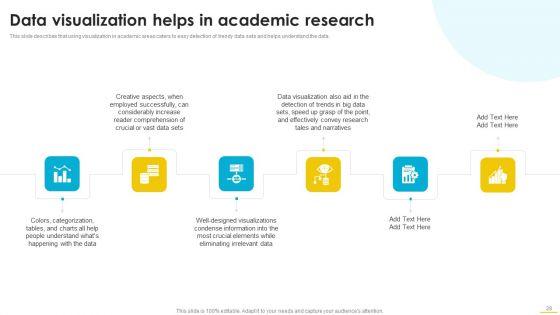
This presentation slide from our repository helps you draw or design a business idea that address the audiences pain points and simplifies their experience. This Data And Information Visualization Ppt PowerPoint Presentation Complete With Slides provides a comprehensive yet easy to comprehend document to draw attention to your value proposition. Help audience navigate your business with this forty seven slide complete deck. Draw an actionable customer service flow chart to win and retain your customers back. The presentation template is also equipped to do this with its 100 percent editable and customizable capability. Download now.

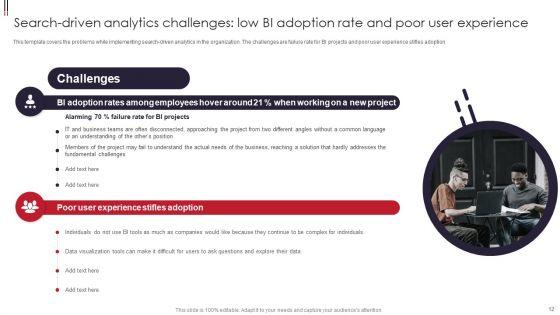


Slide 1 of 40
Induce strategic thinking by presenting this complete deck. Enthrall your audience by deploying this thought provoking PPT deck. It can be downloaded in both standard and widescreen aspect ratios, thus making it a complete package to use and deploy. Convey your thoughts and actions using the forty slides presented in this complete deck. Additionally, feel free to alter its components like color, graphics, design, etc, to create a great first impression. Grab it now by clicking on the download button below.
Slide 1 of 5
Presenting this set of slides with name information visualization vector icon ppt powerpoint presentation ideas microsoft. This is a three stage process. The stages in this process are data visualization icon, research analysis, business focus. This is a completely editable PowerPoint presentation and is available for immediate download. Download now and impress your audience.

Slide 1 of 2
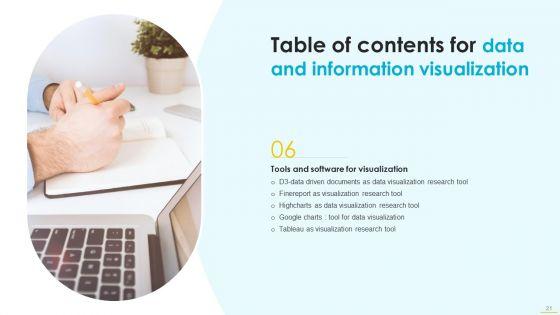
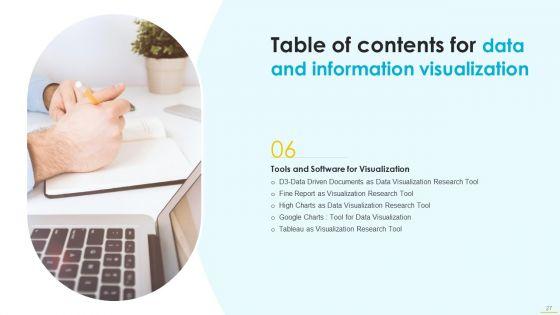
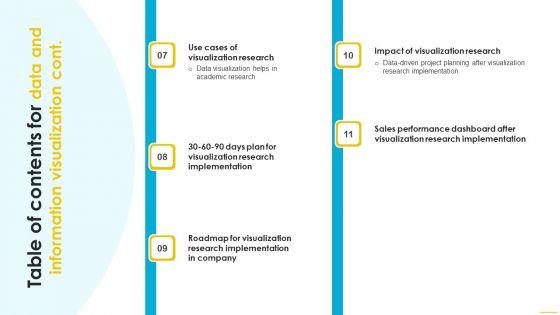
Explore a selection of the finest Table Of Contents For Data And Information Visualization Background PDF here. With a plethora of professionally designed and pre made slide templates, you can quickly and easily find the right one for your upcoming presentation. You can use our Table Of Contents For Data And Information Visualization Background PDF to effectively convey your message to a wider audience. Slidegeeks has done a lot of research before preparing these presentation templates. The content can be personalized and the slides are highly editable. Grab templates today from Slidegeeks.


Slide 1 of 2
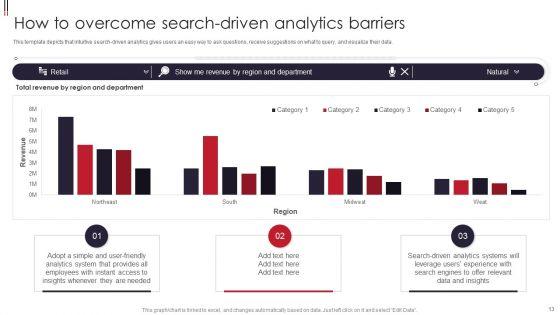
This template depicts that intuitive search-driven analytics gives users an easy way to ask questions, receive suggestions on what to query, and visualize their data. Deliver an awe inspiring pitch with this creative Information Visualizations Playbook How To Overcome Search Driven Analytics Barriers Guidelines PDF bundle. Topics like Analytics System, Data And Insights, Search Driven Analytics can be discussed with this completely editable template. It is available for immediate download depending on the needs and requirements of the user.

Slide 1 of 2
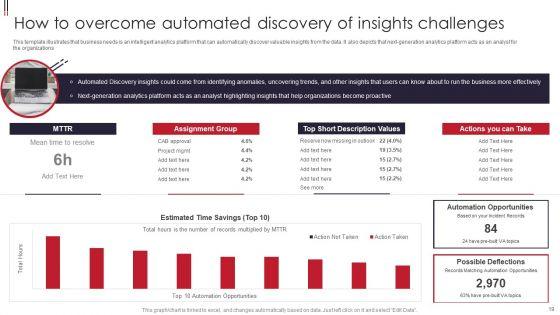
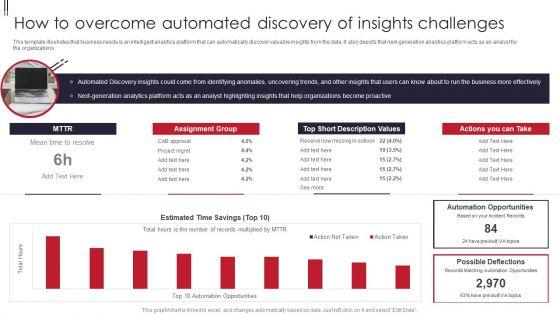
This template illustrates that business needs is an intelligent analytics platform that can automatically discover valuable insights from the data. It also depicts that next-generation analytics platform acts as an analyst for the organizations. Deliver and pitch your topic in the best possible manner with this Information Visualizations Playbook How To Overcome Automated Discovery Of Insights Challenges Designs PDF. Use them to share invaluable insights on Short Description Values, Automation Opportunities, Short Description Values, Analytics Platform and impress your audience. This template can be altered and modified as per your expectations. So, grab it now.


Slide 1 of 2
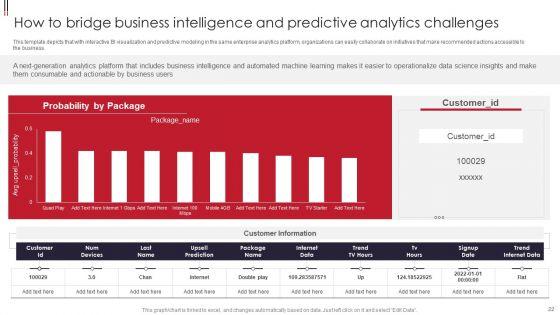
This template depicts that with interactive BI visualization and predictive modeling in the same enterprise analytics platform, organizations can easily collaborate on initiatives that make recommended actions accessible to the business. Deliver and pitch your topic in the best possible manner with this Information Visualizations Playbook How To Bridge Business Intelligence And Predictive Analytics Challenges Themes PDF. Use them to share invaluable insights on Business Users, Operationalize Data Science, Num Devices and impress your audience. This template can be altered and modified as per your expectations. So, grab it now.


Slide 1 of 2
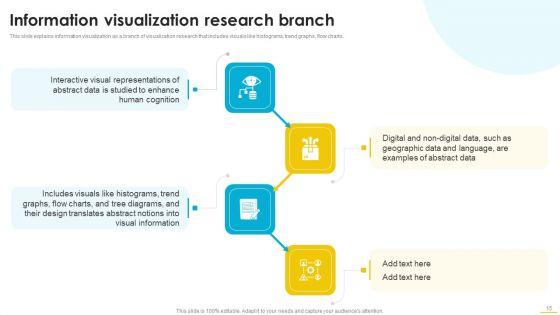
This slide explains information visualization as a branch of visualization research that includes visuals like histograms, trend graphs, flow charts.Presenting Departments Of Visualization Research Information Visualization Research Branch Clipart PDF to provide visual cues and insights. Share and navigate important information on four stages that need your due attention. This template can be used to pitch topics like Interactive Visual, Representations Of Abstract, Information In addtion, this PPT design contains high resolution images, graphics, etc, that are easily editable and available for immediate download.
Slide 1 of 2
This slide explains information visualization as a branch of visualization research that includes visuals like histograms, trend graphs, flow charts. Presenting graphical representation of research it information visualization research branch icons pdf to provide visual cues and insights. Share and navigate important information on four stages that need your due attention. This template can be used to pitch topics like geographic, information, design. In addtion, this PPT design contains high resolution images, graphics, etc, that are easily editable and available for immediate download.


Slide 1 of 9
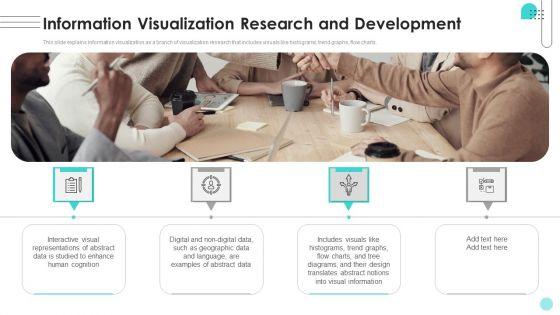
This slide explains information visualization as a branch of visualization research that includes visuals like histograms, trend graphs, flow charts. Here you can discover an assortment of the finest PowerPoint and Google Slides templates. With these templates, you can create presentations for a variety of purposes while simultaneously providing your audience with an eye-catching visual experience. Download Information Visualization Research And Development Ppt Infographics Gallery PDF to deliver an impeccable presentation. These templates will make your job of preparing presentations much quicker, yet still, maintain a high level of quality. Slidegeeks has experienced researchers who prepare these templates and write high-quality content for you. Later on, you can personalize the content by editing the Information Visualization Research And Development Ppt Infographics Gallery PDF.


Slide 1 of 9
Introducing our well designed Icons Slides For Data And Information Visualization Pictures PDF set of slides. The slide displays editable icons to enhance your visual presentation. The icons can be edited easily. So customize according to your business to achieve a creative edge. Download and share it with your audience.


Slide 1 of 9
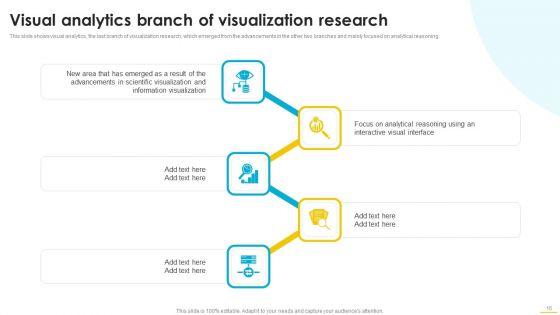
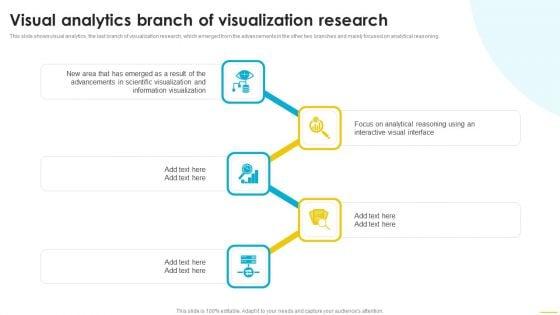
This slide shows visual analytics, the last branch of visualization research, which emerged from the advancements in the other two branches and mainly focused on analytical reasoning. Make sure to capture your audiences attention in your business displays with our gratis customizable Data And Information Visualization Visual Analytics Branch Of Visualization Research Designs PDF. These are great for business strategies, office conferences, capital raising or task suggestions. If you desire to acquire more customers for your tech business and ensure they stay satisfied, create your own sales presentation with these plain slides.


Slide 1 of 9
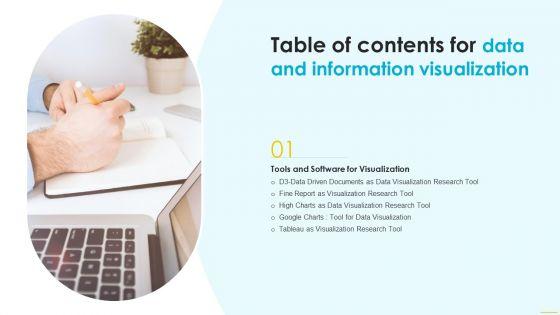
Whether you have daily or monthly meetings, a brilliant presentation is necessary. Table Of Contents For Data And Information Visualization Tool Structure PDF can be your best option for delivering a presentation. Represent everything in detail using Table Of Contents For Data And Information Visualization Tool Structure PDF and make yourself stand out in meetings. The template is versatile and follows a structure that will cater to your requirements. All the templates prepared by Slidegeeks are easy to download and edit. Our research experts have taken care of the corporate themes as well. So, give it a try and see the results.


Slide 1 of 9
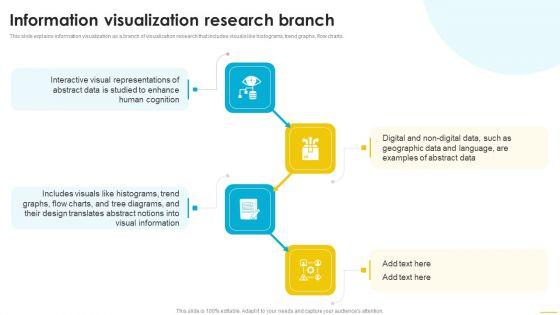
This slide explains information visualization as a branch of visualization research that includes visuals like histograms, trend graphs, flow charts. Slidegeeks is here to make your presentations a breeze with Information Visualization Research Branch Template PDF With our easy to use and customizable templates, you can focus on delivering your ideas rather than worrying about formatting. With a variety of designs to choose from, you are sure to find one that suits your needs. And with animations and unique photos, illustrations, and fonts, you can make your presentation pop. So whether you are giving a sales pitch or presenting to the board, make sure to check out Slidegeeks first.


Slide 1 of 9
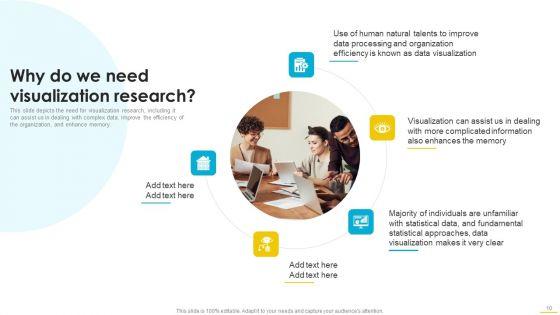
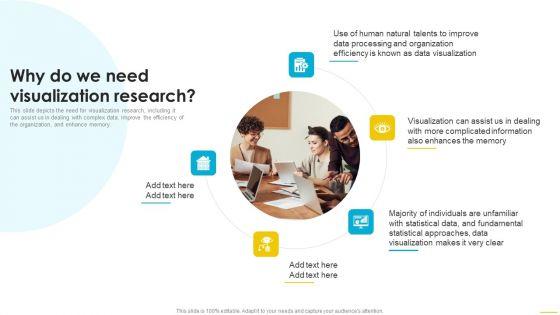
This slide depicts the need for visualization research, including it can assist us in dealing with complex data, improve the efficiency of the organization, and enhance memory. Slidegeeks is one of the best resources for PowerPoint templates. You can download easily and regulate Data And Information Visualization Why Do We Need Visualization Research Summary PDF for your personal presentations from our wonderful collection. A few clicks is all it takes to discover and get the most relevant and appropriate templates. Use our Templates to add a unique zing and appeal to your presentation and meetings. All the slides are easy to edit and you can use them even for advertisement purposes.


Slide 1 of 9
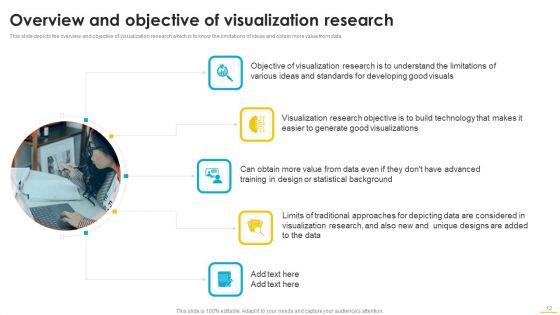
This slide depicts the overview and objective of visualization research which is to know the limitations of ideas and obtain more value from data. Create an editable Data And Information Visualization Overview And Objective Of Visualization Research Microsoft PDF that communicates your idea and engages your audience. Whether you are presenting a business or an educational presentation, pre designed presentation templates help save time. Data And Information Visualization Overview And Objective Of Visualization Research Microsoft PDF is highly customizable and very easy to edit, covering many different styles from creative to business presentations. Slidegeeks has creative team members who have crafted amazing templates. So, go and get them without any delay.


Slide 1 of 9
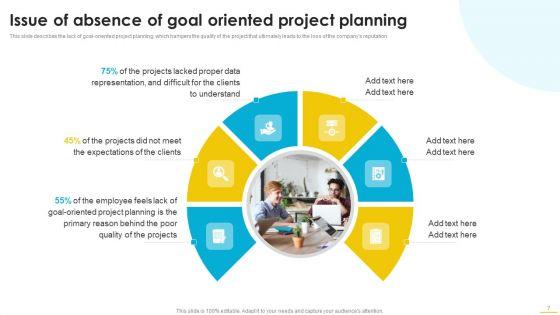
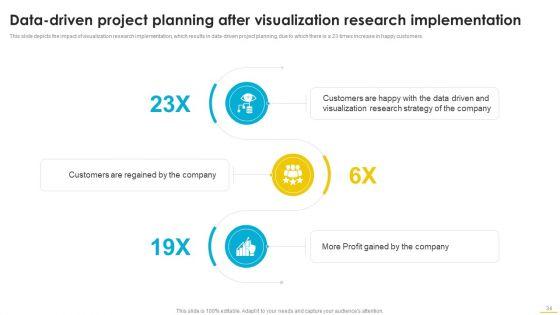
This slide describes the lack of goal oriented project planning, which hampers the quality of the project that ultimately leads to the loss of the companys reputation. Boost your pitch with our creative Data And Information Visualization Issue Of Absence Of Goal Oriented Project Planning Demonstration PDF. Deliver an awe inspiring pitch that will mesmerize everyone. Using these presentation templates you will surely catch everyones attention. You can browse the ppts collection on our website. We have researchers who are experts at creating the right content for the templates. So you do not have to invest time in any additional work. Just grab the template now and use them.


Slide 1 of 9
Find a pre designed and impeccable Agenda For Data And Information Visualization Icons PDF. The templates can ace your presentation without additional effort. You can download these easy to edit presentation templates to make your presentation stand out from others. So, what are you waiting for Download the template from Slidegeeks today and give a unique touch to your presentation.


Slide 1 of 9
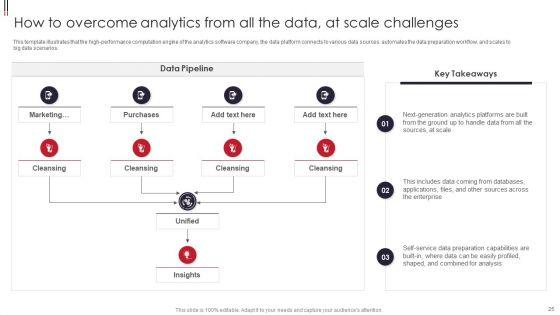
This template illustrates that the high performance computation engine of the analytics software company, the data platform connects to various data sources, automates the data preparation workflow, and scales to big data scenarios. Deliver an awe inspiring pitch with this creative Information Visualizations Playbook How To Overcome Analytics From All The Data At Scale Challenges Mockup PDF bundle. Topics like Purchases, Marketing, Data Pipeline can be discussed with this completely editable template. It is available for immediate download depending on the needs and requirements of the user.


Slide 1 of 9
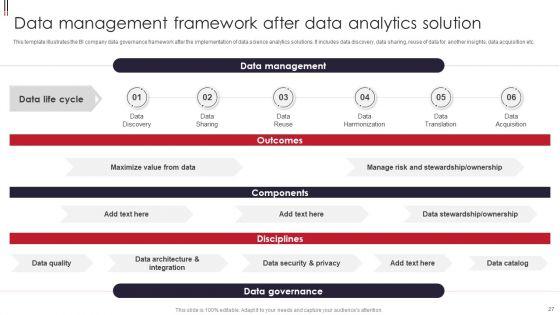
Deliver an awe inspiring pitch with this creative Information Visualizations Playbook Data Management Framework After Data Analytics Solution Formats PDF bundle. Topics like Data Discovery, Data Sharing, Data Harmonization can be discussed with this completely editable template. It is available for immediate download depending on the needs and requirements of the user.


Slide 1 of 9
Presenting our innovatively structured Icons Slide For Information Visualizations Playbook Microsoft PDF set of slides. The slides contain a hundred percent editable icons. You can replace these icons without any inconvenience. Therefore, pick this set of slides and create a striking presentation.


Slide 1 of 9
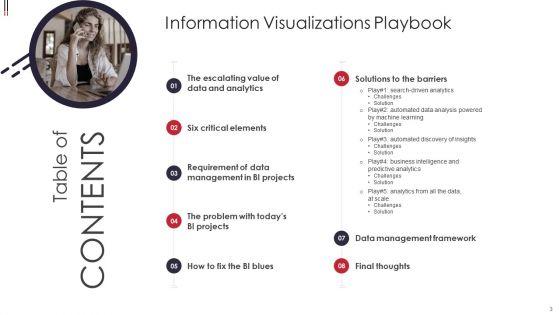
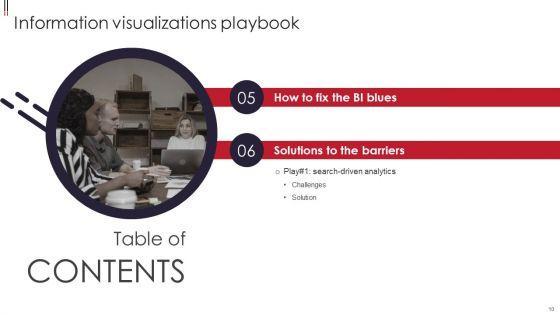
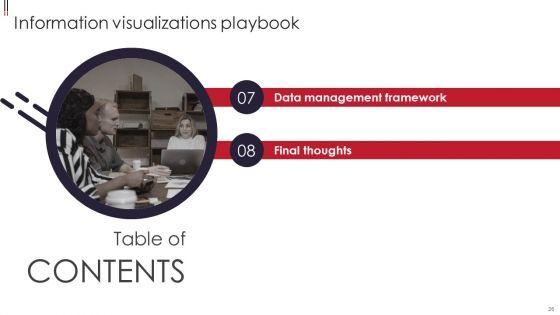
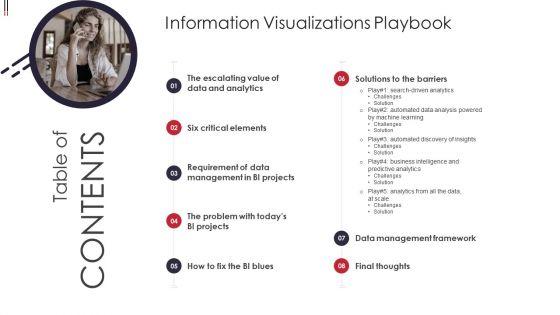
This is a Table Of Contents Information Visualizations Playbook Pictures PDF template with various stages. Focus and dispense information on eight stages using this creative set, that comes with editable features. It contains large content boxes to add your information on topics like Data And Analytics, Six Critical Elements, Data Management Framework. You can also showcase facts, figures, and other relevant content using this PPT layout. Grab it now.


Slide 1 of 9
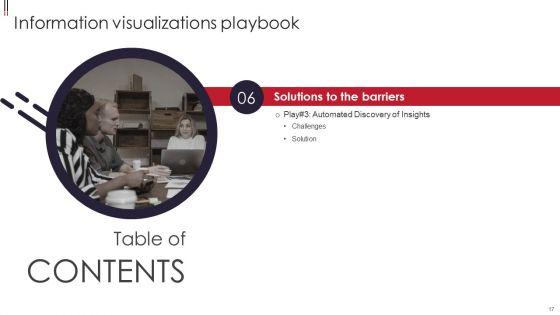
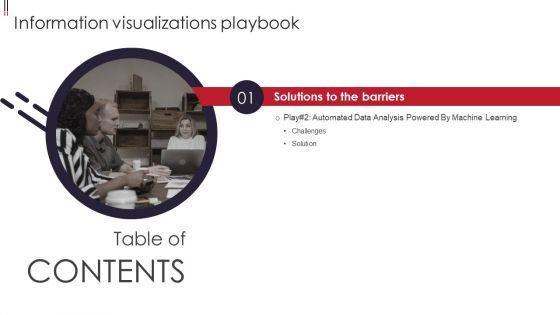
Presenting Table Of Contents Information Visualizations Playbook Data Pictures PDF to provide visual cues and insights. Share and navigate important information on one stages that need your due attention. This template can be used to pitch topics like Automated Data Analysis, Information Visualizations Playbook. In addtion, this PPT design contains high resolution images, graphics, etc, that are easily editable and available for immediate download.


Slide 1 of 9
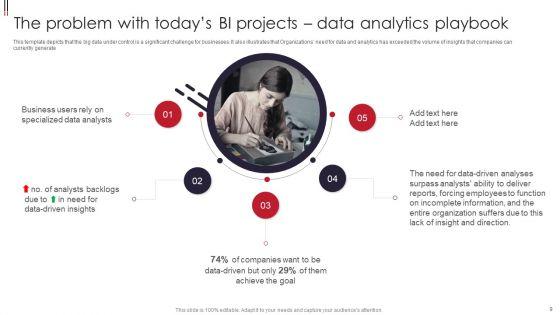
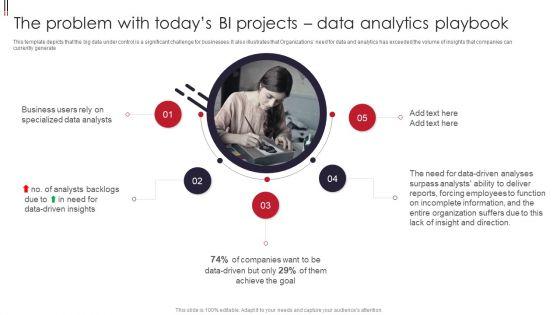
This template depicts that the big data under control is a significant challenge for businesses. It also illustrates that Organizations need for data and analytics has exceeded the volume of insights that companies can currently generate. Presenting Information Visualizations Playbook The Problem With Todays BI Projects Data Analytics Playbook Portrait PDF to provide visual cues and insights. Share and navigate important information on five stages that need your due attention. This template can be used to pitch topics like Business Users, Specialized Data Analysts, Data Driven Insights. In addtion, this PPT design contains high resolution images, graphics, etc, that are easily editable and available for immediate download.


Slide 1 of 9
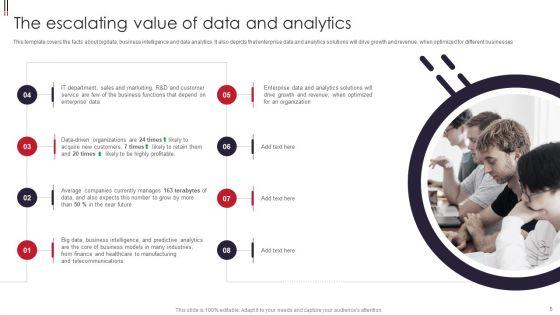
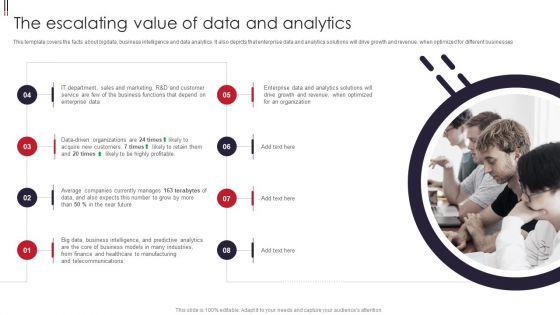
This template covers the facts about bigdata, business intelligence and data analytics. It also depicts that enterprise data and analytics solutions will drive growth and revenue, when optimized for different businesses. This is a Information Visualizations Playbook The Escalating Value Of Data And Analytics Portrait PDF template with various stages. Focus and dispense information on eight stages using this creative set, that comes with editable features. It contains large content boxes to add your information on topics like Data Driven Organizations, Acquire New Customers, Profitable. You can also showcase facts, figures, and other relevant content using this PPT layout. Grab it now.


Slide 1 of 9
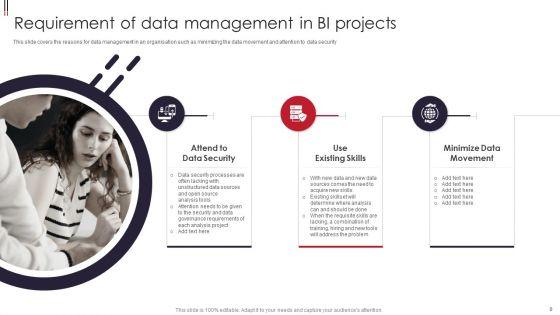
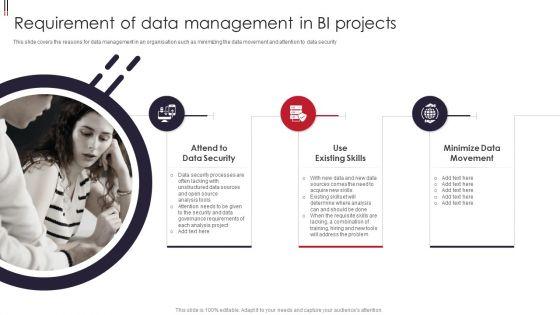
This slide covers the reasons for data management in an organisation such as minimizing the data movement and attention to data security Presenting Information Visualizations Playbook Requirement Of Data Management In BI Projects Ideas PDF to provide visual cues and insights. Share and navigate important information on three stages that need your due attention. This template can be used to pitch topics like Data Security, Use Existing Skills, Minimize Data Movement. In addtion, this PPT design contains high resolution images, graphics, etc, that are easily editable and available for immediate download.


Slide 1 of 9
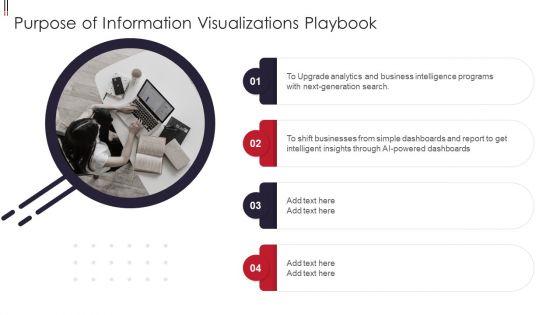
Information Visualizations Playbook Purpose Of Information Visualizations Playbook Demonstration PDF
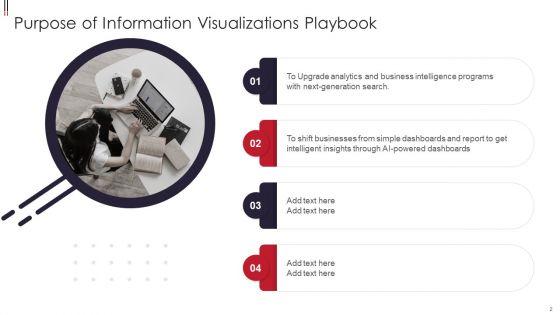
This is a Information Visualizations Playbook Purpose Of Information Visualizations Playbook Demonstration PDF template with various stages. Focus and dispense information on four stages using this creative set, that comes with editable features. It contains large content boxes to add your information on topics like Analytics And Business, Dashboards. You can also showcase facts, figures, and other relevant content using this PPT layout. Grab it now.


Slide 1 of 9
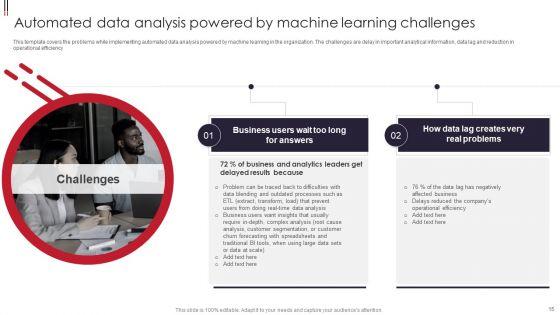
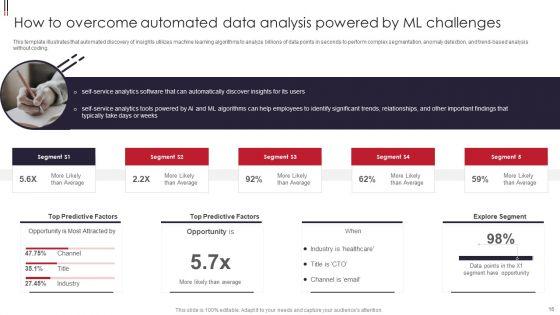
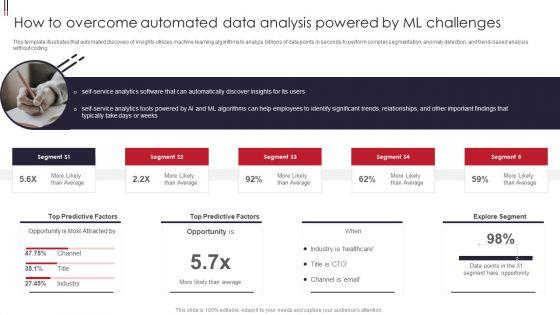
This template illustrates that automated discovery of insights utilizes machine learning algorithms to analyze billions of data points in seconds to perform complex segmentation, anomaly detection, and trend based analysis without coding. Presenting Information Visualizations Playbook How To Overcome Automated Data Analysis Powered By Ml Challenges Professional PDF to provide visual cues and insights. Share and navigate important information on five stages that need your due attention. This template can be used to pitch topics like Average, Opportunity, Analytics Tools. In addtion, this PPT design contains high resolution images, graphics, etc, that are easily editable and available for immediate download.


Slide 1 of 9
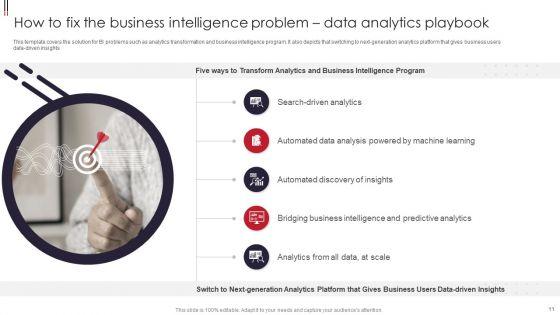
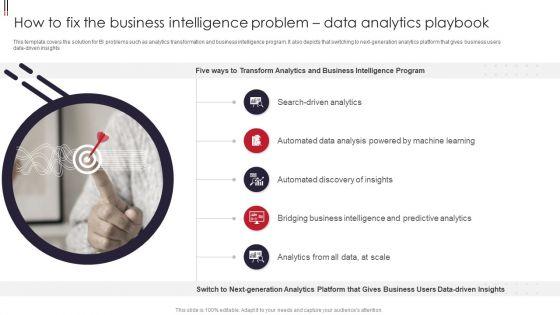
This template covers the solution for BI problems such as analytics transformation and business intelligence program. It also depicts that switching to next generation analytics platform that gives business users data driven insights. This is a Information Visualizations Playbook How To Fix The Business Intelligence Problem Data Analytics Playbook Guidelines PDF template with various stages. Focus and dispense information on five stages using this creative set, that comes with editable features. It contains large content boxes to add your information on topics like Search Driven Analytics, Bridging Business Intelligence, Predictive Analytics. You can also showcase facts, figures, and other relevant content using this PPT layout. Grab it now.


Slide 1 of 9
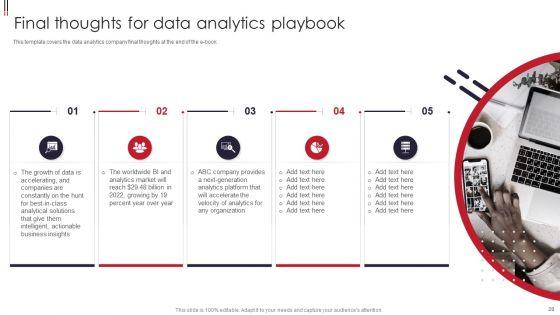
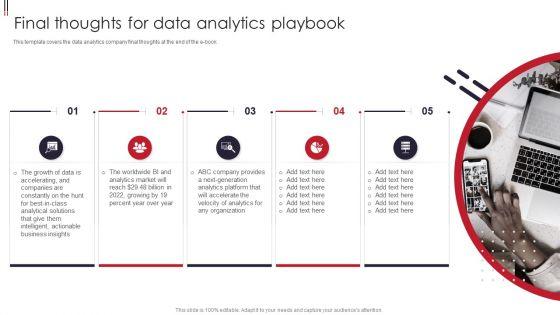
This template covers the data analytics company final thoughts at the end of the e book. Presenting Information Visualizations Playbook Final Thoughts For Data Analytics Playbook Pictures PDF to provide visual cues and insights. Share and navigate important information on five stages that need your due attention. This template can be used to pitch topics like Organization, Business Insights, Growth. In addtion, this PPT design contains high resolution images, graphics, etc, that are easily editable and available for immediate download.


Slide 1 of 9
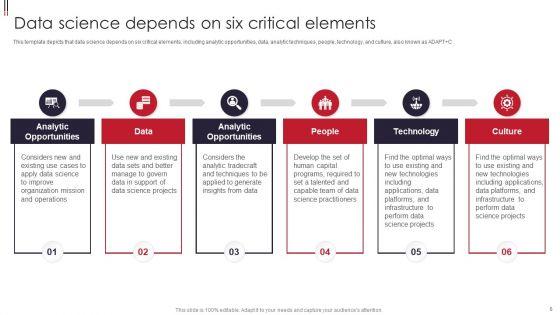
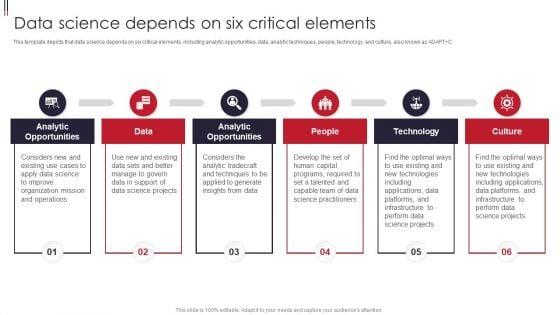
This template depicts that data science depends on six critical elements, including analytic opportunities, data, analytic techniques, people, technology, and culture, also known as ADAPT C. This is a Information Visualizations Playbook Data Science Depends On Six Critical Elements Structure PDF template with various stages. Focus and dispense information on six stages using this creative set, that comes with editable features. It contains large content boxes to add your information on topics like Data, Analytic Opportunities, Technology. You can also showcase facts, figures, and other relevant content using this PPT layout. Grab it now.


Slide 1 of 9
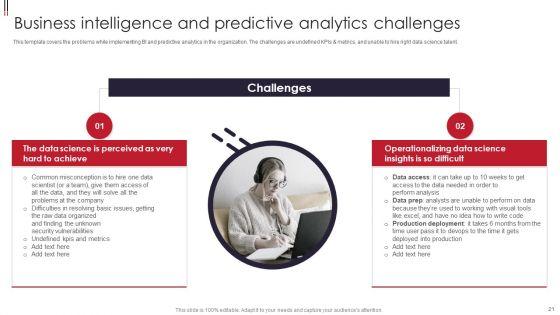
This template covers the problems while implementing BI and predictive analytics in the organization. The challenges are undefined KPIs and metrics, and unable to hire right data science talent. Presenting Information Visualizations Playbook Business Intelligence And Predictive Analytics Challenges Icons PDF to provide visual cues and insights. Share and navigate important information on two stages that need your due attention. This template can be used to pitch topics like Raw Data Organized, Security Vulnerabilities, Perform Analysis. In addtion, this PPT design contains high resolution images, graphics, etc, that are easily editable and available for immediate download.


Slide 1 of 9
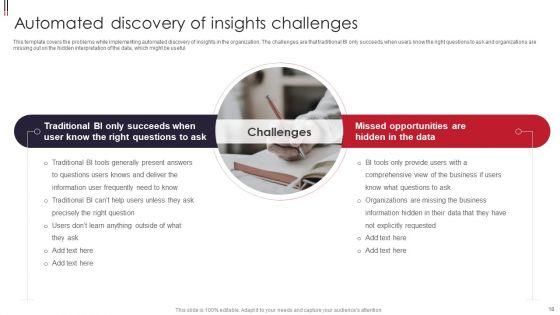
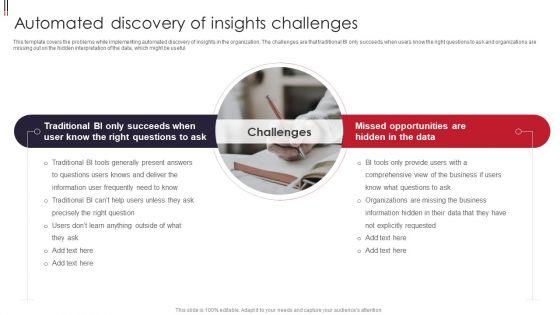
This template covers the problems while implementing automated discovery of insights in the organization. The challenges are that traditional BI only succeeds when users know the right questions to ask and organizations are missing out on the hidden interpretation of the data, which might be useful. This is a Information Visualizations Playbook Automated Discovery Of Insights Challenges Pictures PDF template with various stages. Focus and dispense information on two stages using this creative set, that comes with editable features. It contains large content boxes to add your information on topics like Information User, Organizations, Opportunities. You can also showcase facts, figures, and other relevant content using this PPT layout. Grab it now.


Slide 1 of 9
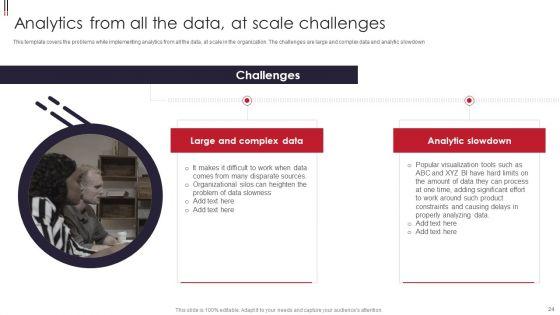
This template covers the problems while implementing analytics from all the data, at scale in the organization. The challenges are large and complex data and analytic slowdown. Presenting Information Visualizations Playbook Analytics From All The Data At Scale Challenges Structure PDF to provide visual cues and insights. Share and navigate important information on two stages that need your due attention. This template can be used to pitch topics like Complex Data, Analytic Slowdown. In addtion, this PPT design contains high resolution images, graphics, etc, that are easily editable and available for immediate download.
34 Item(s)
