AI PPT Maker
Templates
PPT Bundles
Design Services
Business PPTs
Business Plan
Management
Strategy
Introduction PPT
Roadmap
Self Introduction
Timelines
Process
Marketing
Agenda
Technology
Medical
Startup Business Plan
Cyber Security
Dashboards
SWOT
Proposals
Education
Pitch Deck
Digital Marketing
KPIs
Project Management
Product Management
Artificial Intelligence
Target Market
Communication
Supply Chain
Google Slides
Research Services
 One Pagers
All Categories
Integrated Dashboard PowerPoint Presentation Templates and Google Slides
10 Item(s)



Slide 1 of 6
Presenting this set of slides with name leadership integration dashboard performance management ppt powerpoint presentation ideas skills. The topics discussed in these slides are leadership transition, dashboard performance, planning. This is a completely editable PowerPoint presentation and is available for immediate download. Download now and impress your audience.


Slide 1 of 2
This slide presents a dashboard for monthly procurement activities in an organization. It includes number of suppliers, contract attainted, supplier share, top supplier report, average procurement cycle time, etc. Slidegeeks is here to make your presentations a breeze with Integration Automation Dashboard For Monthly Procurement Process Automated Introduction PDF With our easy-to-use and customizable templates, you can focus on delivering your ideas rather than worrying about formatting. With a variety of designs to choose from, youre sure to find one that suits your needs. And with animations and unique photos, illustrations, and fonts, you can make your presentation pop. So whether youre giving a sales pitch or presenting to the board, make sure to check out Slidegeeks first.
Slide 1 of 2
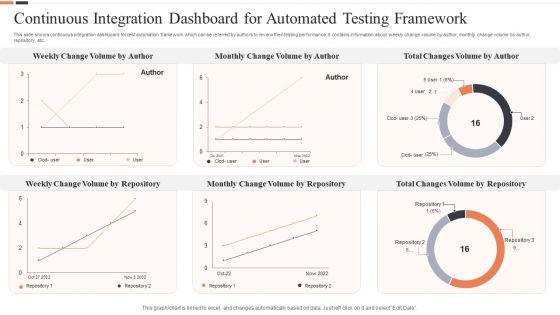
This slide shows continuous integration dashboard for test automation framework which can be referred by authors to review their testing performance. It contains information about weekly change volume by author, monthly change volume by author, repository, etc. Pitch your topic with ease and precision using this Continuous Integration Dashboard For Automated Testing Framework Ppt Layouts Layout Ideas PDF. This layout presents information on Total Changes Volume, Monthly Change Volume, Weekly Change Volume. It is also available for immediate download and adjustment. So, changes can be made in the color, design, graphics or any other component to create a unique layout.
Slide 1 of 2
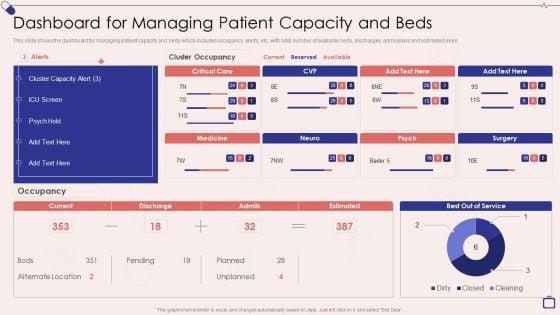
This slide shows the dashboard for managing patient capacity and beds which includes occupancy, alerts, etc, with total number of available beds, discharges, admissions and estimated ones.Deliver and pitch your topic in the best possible manner with this Implementing Integrated Software Dashboard For Managing Patient Capacity And Beds Download PDF. Use them to share invaluable insights on Alternate Location, Cluster Occupancy, Cluster Capacity and impress your audience. This template can be altered and modified as per your expectations. So, grab it now.
Slide 1 of 2
Pitch your topic with ease and precision using this Acquisition Integration Performance Dashboard Icon Clipart PDF This layout presents information on Acquisition Integration, Performance, Dashboard Icon It is also available for immediate download and adjustment. So, changes can be made in the color, design, graphics or any other component to create a unique layout.

Slide 1 of 2
This slide provides information regarding the SecOps dashboard which is used to track and monitor various vulnerabilities identified. Deliver and pitch your topic in the best possible manner with this security and process integration secops dashboard to track vulnerabilities mockup pdf. Use them to share invaluable insights on assets, vulnerabilities, severity and impress your audience. This template can be altered and modified as per your expectations. So, grab it now.

Slide 1 of 2
Presenting this set of slides with name web server integration dashboard ppt powerpoint presentation infographics deck cpb. This is an editable Powerpoint three stages graphic that deals with topics like web server integration dashboard to help convey your message better graphically. This product is a premium product available for immediate download and is 100 percent editable in Powerpoint. Download this now and use it in your presentations to impress your audience.

Slide 1 of 2
Presenting this set of slides with name cloud integration dashboard ppt powerpoint presentation background designs cpb. This is an editable Powerpoint four stages graphic that deals with topics like cloud integration dashboard to help convey your message better graphically. This product is a premium product available for immediate download and is 100 percent editable in Powerpoint. Download this now and use it in your presentations to impress your audience.


Slide 1 of 10
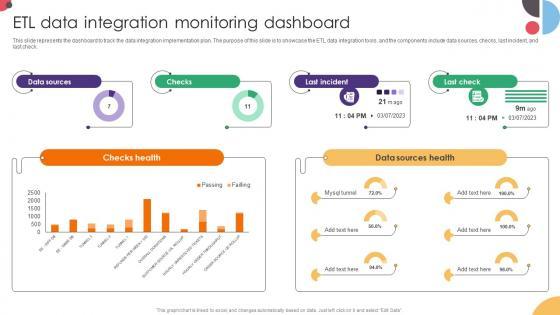
This slide represents the dashboard to track the data integration implementation plan. The purpose of this slide is to showcase the ETL data integration tools, and the components include data sources, checks, last incident, and last check. Are you searching for a ETL Data Integration Monitoring Dashboard Data Integration Strategies For Business that is uncluttered, straightforward, and original Its easy to edit, and you can change the colors to suit your personal or business branding. For a presentation that expresses how much effort you have put in, this template is ideal With all of its features, including tables, diagrams, statistics, and lists, its perfect for a business plan presentation. Make your ideas more appealing with these professional slides. Download ETL Data Integration Monitoring Dashboard Data Integration Strategies For Business from Slidegeeks today. This slide represents the dashboard to track the data integration implementation plan. The purpose of this slide is to showcase the ETL data integration tools, and the components include data sources, checks, last incident, and last check.


Slide 1 of 10
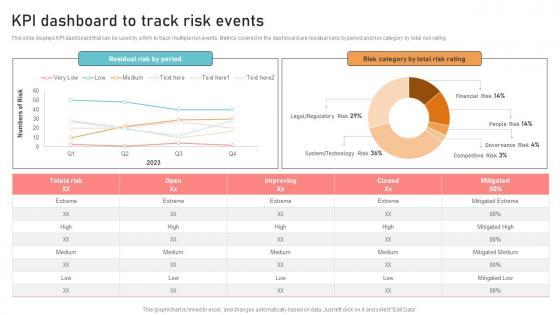
This slide displays KPI dashboard that can be used by a firm to track multiple risk events. Metrics covered in the dashboard are residual risks by period and risk category by total risk rating. Crafting an eye catching presentation has never been more straightforward. Let your presentation shine with this tasteful yet straightforward Optimizing Business Integration KPI Dashboard To Track Risk Events Designs Pdf template. It offers a minimalistic and classy look that is great for making a statement. The colors have been employed intelligently to add a bit of playfulness while still remaining professional. Construct the ideal Optimizing Business Integration KPI Dashboard To Track Risk Events Designs Pdf that effortlessly grabs the attention of your audience. Begin now and be certain to wow your customers. This slide displays KPI dashboard that can be used by a firm to track multiple risk events. Metrics covered in the dashboard are residual risks by period and risk category by total risk rating.
10 Item(s)
