AI PPT Maker
Templates
PPT Bundles
Design Services
Business PPTs
Business Plan
Management
Strategy
Introduction PPT
Roadmap
Self Introduction
Timelines
Process
Marketing
Agenda
Technology
Medical
Startup Business Plan
Cyber Security
Dashboards
SWOT
Proposals
Education
Pitch Deck
Digital Marketing
KPIs
Project Management
Product Management
Artificial Intelligence
Target Market
Communication
Supply Chain
Google Slides
Research Services
 One Pagers
All Categories
Interactive dashboard PowerPoint Presentation Templates and Google Slides
16 Item(s)






Slide 1 of 12
If designing a presentation takes a lot of your time and resources and you are looking for a better alternative, then this interactive medium mobile dashboard ppt powerpoint presentation complete deck is the right fit for you. This is a prefabricated set that can help you deliver a great presentation on the topic. All the twelve slides included in this sample template can be used to present a birds-eye view of the topic. These slides are also fully editable, giving you enough freedom to add specific details to make this layout more suited to your business setting. Apart from the content, all other elements like color, design, theme are also replaceable and editable. This helps in designing a variety of presentations with a single layout. Not only this, you can use this PPT design in formats like PDF, PNG, and JPG once downloaded. Therefore, without any further ado, download and utilize this sample presentation as per your liking.
Slide 1 of 4
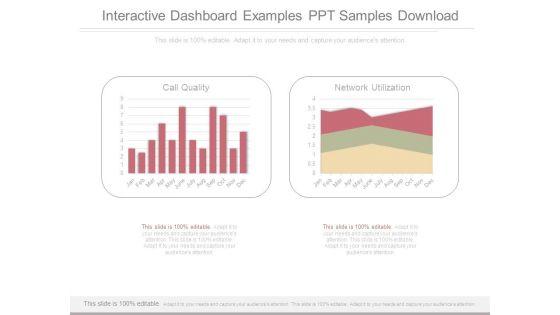
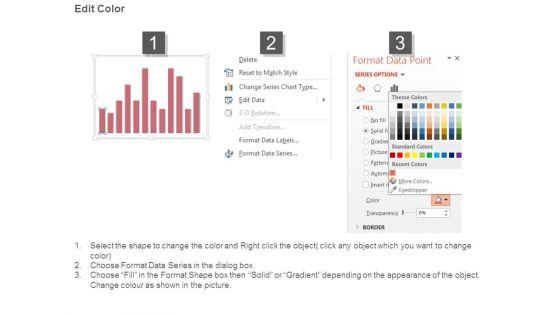
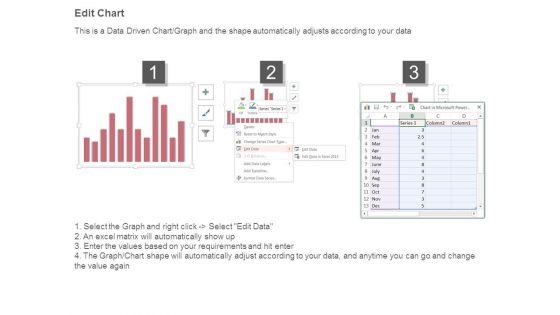
This is a interactive dashboard examples ppt samples download. This is a two stage process. The stages in this process are call quality, network utilization.
Slide 1 of 2
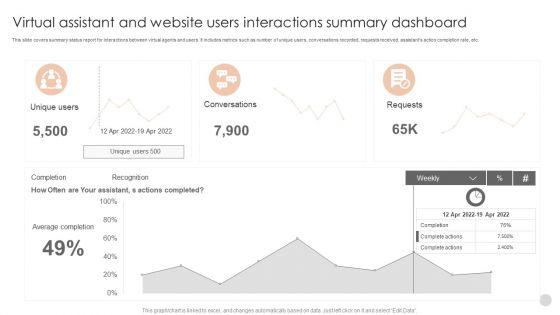
This slide covers summary status report for interactions between virtual agents and users. It includes metrics such as number of unique users, conversations recorded, requests received, assistants action completion rate, etc.Showcasing this set of slides titled Virtual Assistant And Website Users Interactions Summary Dashboard Formats PDF. The topics addressed in these templates are Actions Completed, Conversations, Complete Actions. All the content presented in this PPT design is completely editable. Download it and make adjustments in color, background, font etc. as per your unique business setting.
Slide 1 of 2
This slide covers the KPI dashboard for analyzing referral campaign results. It includes metrics such as total revenue generated, monthly recurring revenue, new customers, clicks, cancelled customers, paying customers, etc. Deliver an awe inspiring pitch with this creative Online Customer Interaction Referral Program Performance Tracking Dashboard Sample PDF bundle. Topics like Revenue Generated, Recurring Revenue, Paying Customers can be discussed with this completely editable template. It is available for immediate download depending on the needs and requirements of the user.
Slide 1 of 2
This slide covers the KPI dashboard for measuring digital campaign results. It includes metrics such as Ad cost, clicks, impressions, CTR, cost per click, conversions, conversion rate, cost per click, cost per thousand impressions, etc. Deliver and pitch your topic in the best possible manner with this Online Customer Interaction Online Ad Campaign Performance Tracking Dashboard Demonstration PDF. Use them to share invaluable insights on Conversations, Impressions, Conversation Rate and impress your audience. This template can be altered and modified as per your expectations. So, grab it now.
Slide 1 of 2
This slide covers the KPI dashboard for analyzing customer loyalty campaign results. It includes metrics such as revenue, liability, NQP accrued, transaction count, members, redemption ratio, etc.Deliver an awe inspiring pitch with this creative Online Customer Interaction Loyalty Program Performance Tracking Dashboard Rules PDF bundle. Topics like Revenue Liability, Transaction Count, Redemption Ratio can be discussed with this completely editable template. It is available for immediate download depending on the needs and requirements of the user.
Slide 1 of 2
This slide covers a touchpoint dashboard with different customer journey stages. It also includes a detailed evaluation of each stage on the basis of experience, importance, etc. Deliver and pitch your topic in the best possible manner with this Online Customer Interaction KPI Dashboard For Tracking Consumer Journey Touchpoints Information PDF. Use them to share invaluable insights on Consumer Journey, Purchasing, Consumer Service and impress your audience. This template can be altered and modified as per your expectations. So, grab it now.
Slide 1 of 2
This slide covers the KPI dashboard for analyzing the company website. It includes metrics such as conversions, conversion rate, sessions, stickiness, bounce rate, engagement, etc. Deliver an awe inspiring pitch with this creative Online Customer Interaction Dashboard For Tracking Website Performance Diagrams PDF bundle. Topics like Conversions Rate, Conversions, Engagement can be discussed with this completely editable template. It is available for immediate download depending on the needs and requirements of the user.
Slide 1 of 2
This slide covers the KPI dashboard for analyzing online content. It includes metrics such as blog visitors, pageviews, newsletter conversion rate, new signups, new customers, etc. Deliver an awe inspiring pitch with this creative Online Customer Interaction Dashboard For Tracking Digital Content Performance Topics PDF bundle. Topics like Newsletter Signups, Purchase Amount, Blog Visitors can be discussed with this completely editable template. It is available for immediate download depending on the needs and requirements of the user.
Slide 1 of 2
This slide covers the KPI dashboard for analyzing the performance of client support department. It includes metrics such as first call resolution, unresolved calls, average response rate, the best day to call, average time to solve issues, etc. Deliver and pitch your topic in the best possible manner with this Online Customer Interaction Dashboard For Tracking Customer Service Team Performance Infographics PDF. Use them to share invaluable insights on Response Time, Issue Solving, Call Resolution and impress your audience. This template can be altered and modified as per your expectations. So, grab it now.
Slide 1 of 2
Showcasing this set of slides titled interactive dashboard for website analytics vector icon ppt powerpoint presentation icon background images pdf. The topics addressed in these templates are interactive dashboard for website analytics vector icon. All the content presented in this PPT design is completely editable. Download it and make adjustments in color, background, font etc. as per your unique business setting.

Slide 1 of 2
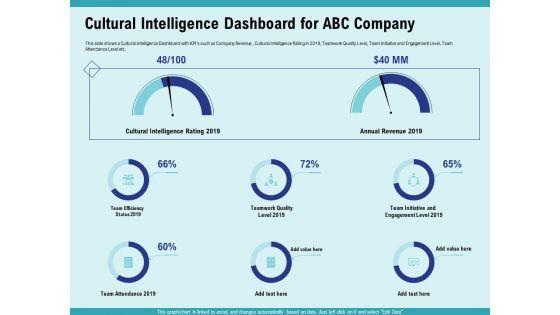
Presenting this set of slides with name cultural intelligence productive team enhanced interaction cultural intelligence dashboard for abc company brochure pdf. The topics discussed in these slides are efficiency, teamwork, team initiative, engagement, value. This is a completely editable PowerPoint presentation and is available for immediate download. Download now and impress your audience.
Slide 1 of 2
Interactive Dashboard Architecture Vector Icon Ppt PowerPoint Presentation File Background Image PDF
Presenting this set of slides with name interactive dashboard architecture vector icon ppt powerpoint presentation file background image pdf. This is a three stage process. The stages in this process are interactive dashboard architecture vector icon. This is a completely editable PowerPoint presentation and is available for immediate download. Download now and impress your audience.

Slide 1 of 2
Presenting this set of slides with name data strategy roadmap including insights and interactive dashboard ppt powerpoint presentation file elements pdf. This is a eight stage process. The stages in this process are sources, developing, decisions. This is a completely editable PowerPoint presentation and is available for immediate download. Download now and impress your audience.


Slide 1 of 9
This slide covers the KPI dashboard for analyzing social media channels. It includes metrics such as social media followers, Facebook daily reach, Facebook engaged users and page impressions, etc. Deliver and pitch your topic in the best possible manner with this Online Customer Interaction Dashboard For Tracking Social Media Platforms Infographics PDF. Use them to share invaluable insights on Awareness, Daily Reach, Impression Final and impress your audience. This template can be altered and modified as per your expectations. So, grab it now.


Slide 1 of 9
This slide shows KPI dashboard for assessing performance of social media platforms. It provides information about followers, likes, clicks, shares, impressions, engaged users, new followers, etc. The Kpi Dashboard For Tracking Enhance Client Engagement With Interactive Advertising Background Pdf is a compilation of the most recent design trends as a series of slides. It is suitable for any subject or industry presentation, containing attractive visuals and photo spots for businesses to clearly express their messages. This template contains a variety of slides for the user to input data, such as structures to contrast two elements, bullet points, and slides for written information. Slidegeeks is prepared to create an impression. This slide shows KPI dashboard for assessing performance of social media platforms. It provides information about followers, likes, clicks, shares, impressions, engaged users, new followers, etc.
16 Item(s)
