 AI PPT Maker
 Templates
 PPT Bundles
 Design Services
 Business PPTs
 Business Plan
 Management
 Strategy
 Introduction PPT
 Roadmap
 Self Introduction
 Timelines
 Process
 Marketing
 Agenda
 Technology
 Medical
 Startup Business Plan
 Cyber Security
 Dashboards
 SWOT
SWOT Proposals
 Education
 Pitch Deck
 Digital Marketing
 KPIs
KPIs Project Management
 Product Management
 Artificial Intelligence
 Target Market
 Communication
 Supply Chain
 Google Slides
 Research Services
 One Pagers
 All Categories
Key-statistics PowerPoint Presentation Templates and Google Slides
SHOW
- 60
- 120
- 180
DISPLAYING: 60 of 900 Item(s)
Page


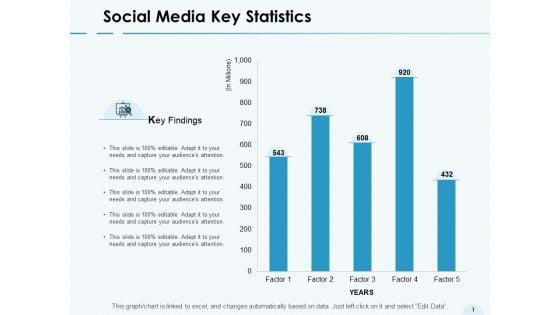


Presenting this set of slides with name social media key statistics bar graph ppt powerpoint presentation inspiration images. The topics discussed in these slides are marketing, business, management, planning, strategy. This is a completely editable PowerPoint presentation and is available for immediate download. Download now and impress your audience.
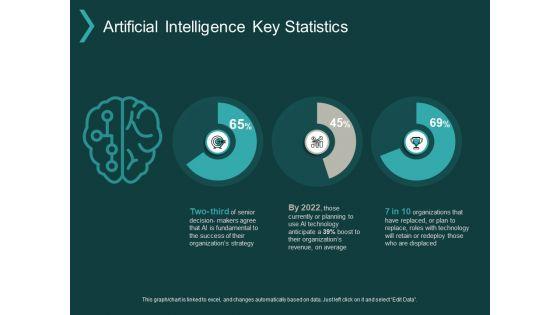


Presenting this set of slides with name artificial intelligence key statistics ppt powerpoint presentation file clipart. The topics discussed in these slides are finance, marketing, management, investment, analysis. This is a completely editable PowerPoint presentation and is available for immediate download. Download now and impress your audience.
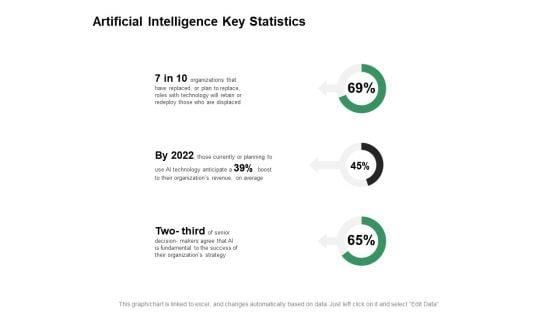


Presenting this set of slides with name artificial intelligence key statistics ppt powerpoint presentation ideas. The topics discussed in these slides are finance, marketing, management, investment, analysis. This is a completely editable PowerPoint presentation and is available for immediate download. Download now and impress your audience.


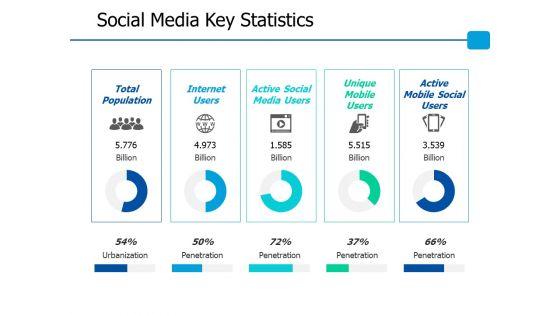


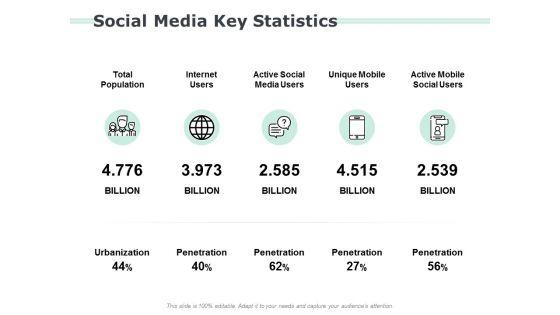


Presenting this set of slides with name social media key statistics ppt powerpoint presentation model sample. This is a five stage process. The stages in this process are financial, marketing, management, investment, analysis. This is a completely editable PowerPoint presentation and is available for immediate download. Download now and impress your audience.
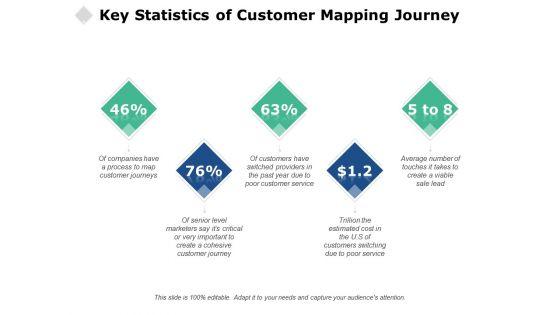


Presenting this set of slides with name key statistics of customer mapping journey ppt powerpoint presentation file skills. This is a five stage process. The stages in this process are business, management, planning, strategy, marketing. This is a completely editable PowerPoint presentation and is available for immediate download. Download now and impress your audience.
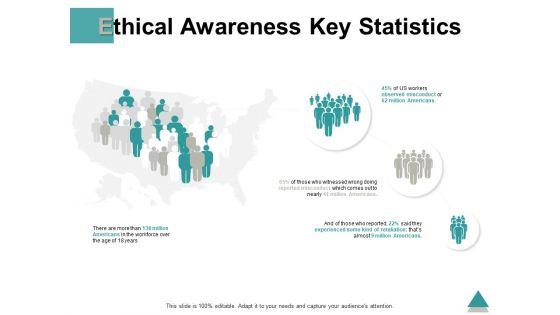


Presenting this set of slides with name ethical awareness key statistics ppt powerpoint presentation infographics sample. This is a four stage process. The stages in this process are business, management, planning, strategy, marketing. This is a completely editable PowerPoint presentation and is available for immediate download. Download now and impress your audience.
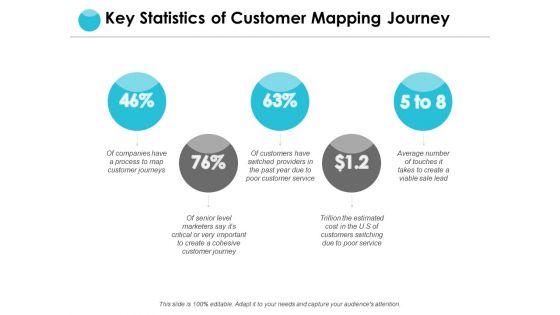


Presenting this set of slides with name key statistics of customer mapping journey ppt powerpoint presentation file model. This is a five stage process. The stages in this process are finance, marketing, management, investment, analysis. This is a completely editable PowerPoint presentation and is available for immediate download. Download now and impress your audience.


Presenting this set of slides with name ethical awareness key statistics ppt powerpoint presentation pictures rules. The topics discussed in these slides are ethical, awareness, statistics, business, management. This is a completely editable PowerPoint presentation and is available for immediate download. Download now and impress your audience.


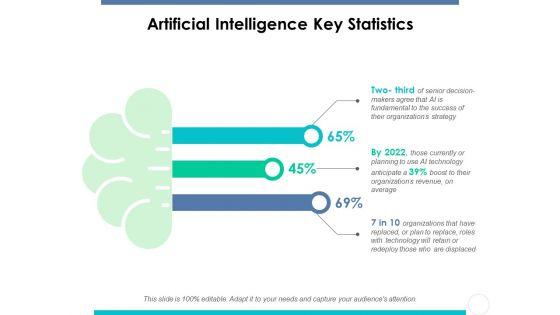
Artificial Intelligence Key Statistics Ppt PowerPoint Presentation Professional Example Introduction
Presenting this set of slides with name artificial intelligence key statistics ppt powerpoint presentation professional example introduction. This is a three stage process. The stages in this process are security, skills, management, marketing, planning. This is a completely editable PowerPoint presentation and is available for immediate download. Download now and impress your audience.
Presenting this set of slides with name artificial intelligence key statistics ppt powerpoint presentation model icon. This is a three stage process. The stages in this process are business, management, planning, strategy, marketing. This is a completely editable PowerPoint presentation and is available for immediate download. Download now and impress your audience.
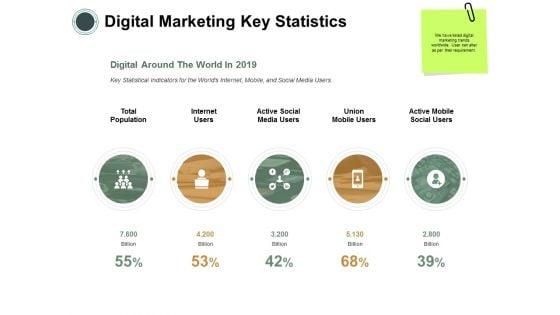


Presenting this set of slides with name digital marketing key statistics ppt powerpoint presentation styles graphics example. This is a five stage process. The stages in this process are business, management, planning, strategy, marketing. This is a completely editable PowerPoint presentation and is available for immediate download. Download now and impress your audience.
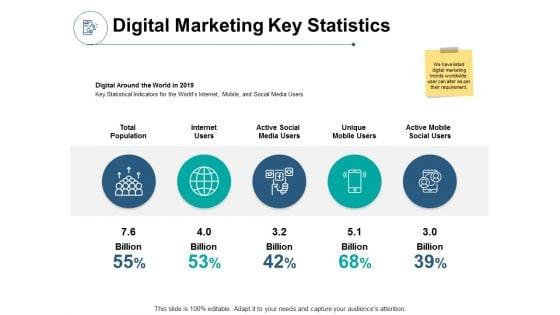


Presenting this set of slides with name digital marketing key statistics ppt powerpoint presentation infographics summary. This is a five stage process. The stages in this process are business, management, planning, strategy, marketing. This is a completely editable PowerPoint presentation and is available for immediate download. Download now and impress your audience.


Cultural Intelligence Key Statistics Ppt PowerPoint Presentation Infographic Template Slide Portrait
This is a cultural intelligence key statistics ppt powerpoint presentation infographic template slide portrait. This is a four stage process. The stages in this process are business, marketing, management.


This slide provides an overview of the advertising channels used by marketers that helped them to drive conversion. The channels covered are social media marketing, paid display advertising, email marketing and search engine optimization. The best PPT templates are a great way to save time, energy, and resources. Slidegeeks have 100 percent editable powerpoint slides making them incredibly versatile. With these quality presentation templates, you can create a captivating and memorable presentation by combining visually appealing slides and effectively communicating your message. Download Direct Response Marketing Guide Ultimate Success Key Statistics Of Direct Response Microsoft PDF from Slidegeeks and deliver a wonderful presentation.
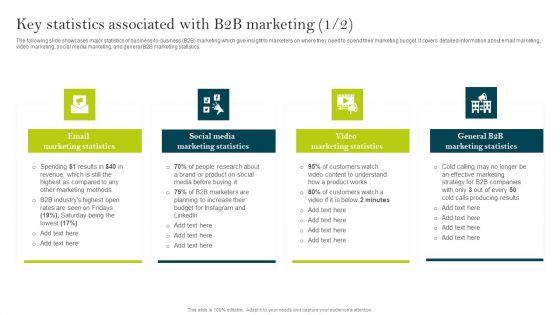

The following slide showcases major statistics of business-to-business B2B marketing which give insight to marketers on where they need to spend their marketing budget. It covers detailed information about email marketing, video marketing, social media marketing, and general B2B marketing statistics. If you are looking for a format to display your unique thoughts, then the professionally designed Key Statistics Associated With B2B Marketing Ppt PowerPoint Presentation File Background Images PDF is the one for you. You can use it as a Google Slides template or a PowerPoint template. Incorporate impressive visuals, symbols, images, and other charts. Modify or reorganize the text boxes as you desire. Experiment with shade schemes and font pairings. Alter, share or cooperate with other people on your work. Download Key Statistics Associated With B2B Marketing Ppt PowerPoint Presentation File Background Images PDF and find out how to give a successful presentation. Present a perfect display to your team and make your presentation unforgettable.
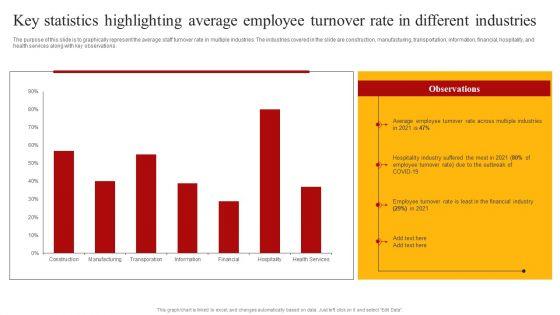

The purpose of this slide is to graphically represent the average staff turnover rate in multiple industries. The industries covered in the slide are construction, manufacturing, transportation, information, financial, hospitality, and health services along with key observations. Want to ace your presentation in front of a live audience Our Staff Retention Techniques To Minimize Hiring Expenses Key Statistics Highlighting Average Employee Turnover Clipart PDF can help you do that by engaging all the users towards you. Slidegeeks experts have put their efforts and expertise into creating these impeccable powerpoint presentations so that you can communicate your ideas clearly. Moreover, all the templates are customizable, and easy to edit and downloadable. Use these for both personal and commercial use.
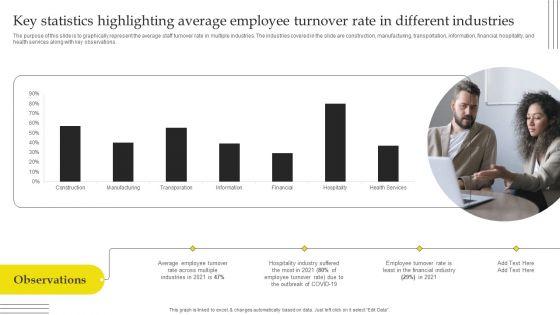

The purpose of this slide is to graphically represent the average staff turnover rate in multiple industries. The industries covered in the slide are construction, manufacturing, transportation, information, financial, hospitality, and health services along with key observations. Want to ace your presentation in front of a live audience Our Effective Strategies For Retaining Healthcare Staff Key Statistics Highlighting Average Employee Turnover Rate Brochure PDF can help you do that by engaging all the users towards you. Slidegeeks experts have put their efforts and expertise into creating these impeccable powerpoint presentations so that you can communicate your ideas clearly. Moreover, all the templates are customizable, and easy to edit and downloadable. Use these for both personal and commercial use.
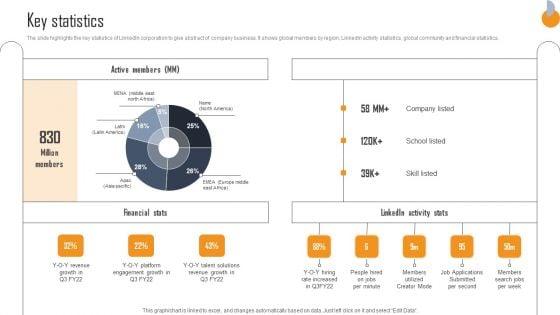

The slide highlights the key statistics of LinkedIn corporation to give abstract of company business. It shows global members by region, LinkedIn activity statistics, global community and financial statistics. Make sure to capture your audiences attention in your business displays with our gratis customizable Business Connection Network Company Outline Key Statistics Designs PDF. These are great for business strategies, office conferences, capital raising or task suggestions. If you desire to acquire more customers for your tech business and ensure they stay satisfied, create your own sales presentation with these plain slides.
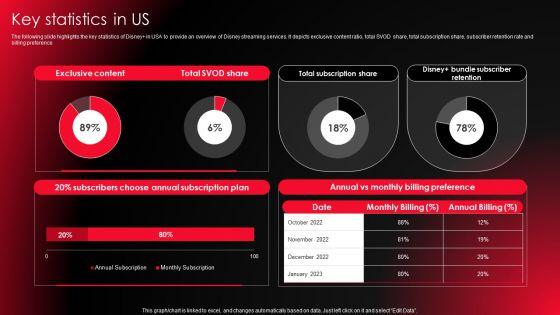

The following slide highlights the key statistics of Disney in USA to provide an overview of Disney streaming services. It depicts exclusive content ratio, total SVOD share, total subscription share, subscriber retention rate and billing preference Find highly impressive Company Profile For Online Video Service Provider Key Statistics In US Structure PDF on Slidegeeks to deliver a meaningful presentation. You can save an ample amount of time using these presentation templates. No need to worry to prepare everything from scratch because Slidegeeks experts have already done a huge research and work for you. You need to download Company Profile For Online Video Service Provider Key Statistics In US Structure PDF for your upcoming presentation. All the presentation templates are 100 percent editable and you can change the color and personalize the content accordingly. Download now.
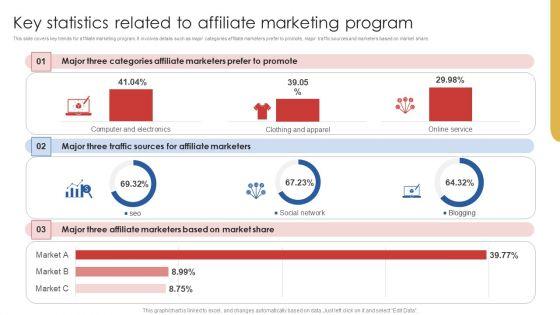

This slide covers key trends for affiliate marketing program. It involves details such as major categories affiliate marketers prefer to promote, major traffic sources and marketers based on market share. Boost your pitch with our creative Key Statistics Related To Affiliate Marketing Program Introduction PDF. Deliver an awe-inspiring pitch that will mesmerize everyone. Using these presentation templates you will surely catch everyones attention. You can browse the ppts collection on our website. We have researchers who are experts at creating the right content for the templates. So you do not have to invest time in any additional work. Just grab the template now and use them.
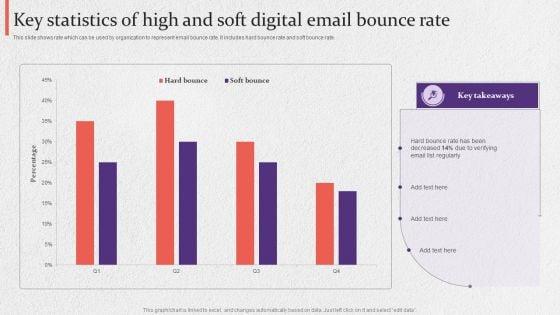
This slide shows rate which can be used by organization to represent email bounce rate. It includes hard bounce rate and soft bounce rate. Pitch your topic with ease and precision using this Key Statistics Of High And Soft Digital Email Bounce Rate Summary PDF. This layout presents information on Key Statistics, Soft Digital, Email Bounce Rate. It is also available for immediate download and adjustment. So, changes can be made in the color, design, graphics or any other component to create a unique layout.
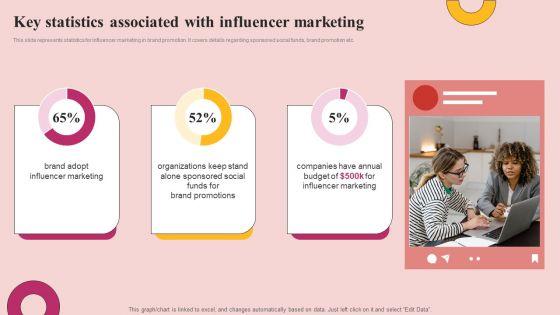

This slide represents statistics for influencer marketing in brand promotion. It covers details regarding sponsored social funds, brand promotion etc. From laying roadmaps to briefing everything in detail, our templates are perfect for you. You can set the stage with your presentation slides. All you have to do is download these easy to edit and customizable templates. Key Statistics Associated With Influencer Marketing Topics PDF will help you deliver an outstanding performance that everyone would remember and praise you for. Do download this presentation today.
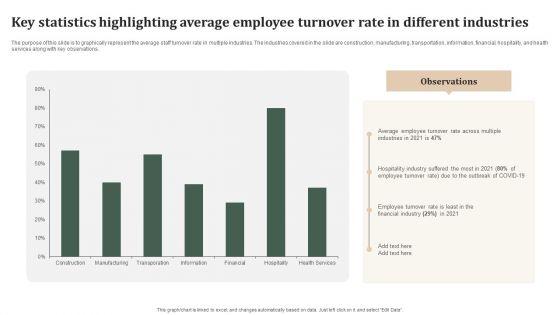

The purpose of this slide is to graphically represent the average staff turnover rate in multiple industries. The industries covered in the slide are construction, manufacturing, transportation, information, financial, hospitality, and health services along with key observations. Here you can discover an assortment of the finest PowerPoint and Google Slides templates. With these templates, you can create presentations for a variety of purposes while simultaneously providing your audience with an eye catching visual experience. Download Key Statistics Highlighting Average Employee Turnover Rate In Different Industries Template PDF to deliver an impeccable presentation. These templates will make your job of preparing presentations much quicker, yet still, maintain a high level of quality. Slidegeeks has experienced researchers who prepare these templates and write high quality content for you. Later on, you can personalize the content by editing the Key Statistics Highlighting Average Employee Turnover Rate In Different Industries Template PDF.

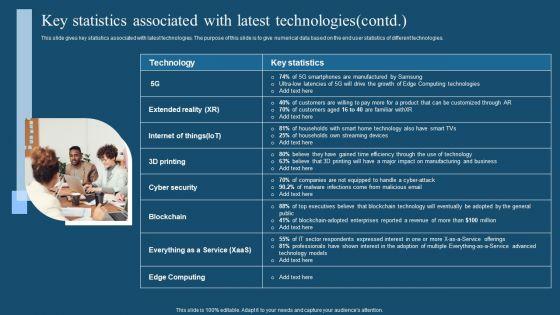
This slide gives key statistics associated with latest technologies. The purpose of this slide is to give numerical data based on the end user statistics of different technologies. The Recent Technologies In IT Industry Key Statistics Associated With Latest Technologies Graphics PDF is a compilation of the most recent design trends as a series of slides. It is suitable for any subject or industry presentation, containing attractive visuals and photo spots for businesses to clearly express their messages. This template contains a variety of slides for the user to input data, such as structures to contrast two elements, bullet points, and slides for written information. Slidegeeks is prepared to create an impression.
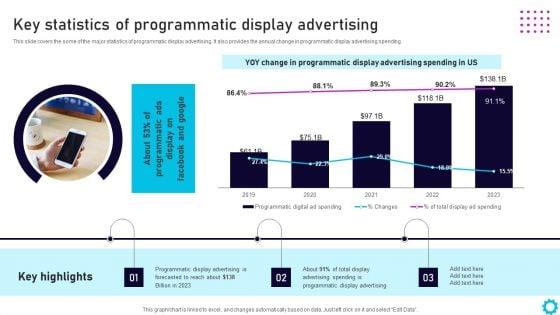
This slide covers the some of the major statistics of programmatic display advertising. It also provides the annual change in programmatic display advertising spending. Want to ace your presentation in front of a live audience Our Complete Guide For Display Key Statistics Of Programmatic Display Advertising Mockup PDF can help you do that by engaging all the users towards you.. Slidegeeks experts have put their efforts and expertise into creating these impeccable powerpoint presentations so that you can communicate your ideas clearly. Moreover, all the templates are customizable, and easy-to-edit and downloadable. Use these for both personal and commercial use.

The following slide exhibits major statistics illustrating the different risks faced by the real estate owners and managers in two years. Information covered in this slide is related to physical property damager, tenant risks, administrative risks, cyber risks and employment issues. Find highly impressive Successful Risk Administration Key Statistics Highlighting Various Risks Faced By Real Estate Summary PDF on Slidegeeks to deliver a meaningful presentation. You can save an ample amount of time using these presentation templates. No need to worry to prepare everything from scratch because Slidegeeks experts have already done a huge research and work for you. You need to download Successful Risk Administration Key Statistics Highlighting Various Risks Faced By Real Estate Summary PDF for your upcoming presentation. All the presentation templates are 100 percent editable and you can change the color and personalize the content accordingly. Download now.
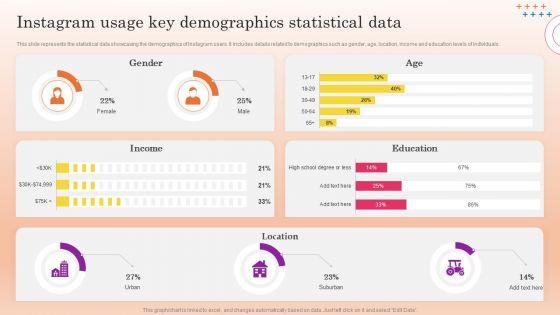
This slide represents the statistical data showcasing the demographics of Instagram users. It includes details related to demographics such as gender, age, location, income and education levels of individuals. Formulating a presentation can take up a lot of effort and time, so the content and message should always be the primary focus. The visuals of the PowerPoint can enhance the presenters message, so our Instagram Marketing To Increase Instagram Usage Key Demographics Statistical Data Demonstration PDF was created to help save time. Instead of worrying about the design, the presenter can concentrate on the message while our designers work on creating the ideal templates for whatever situation is needed. Slidegeeks has experts for everything from amazing designs to valuable content, we have put everything into Instagram Marketing To Increase Instagram Usage Key Demographics Statistical Data Demonstration PDF.
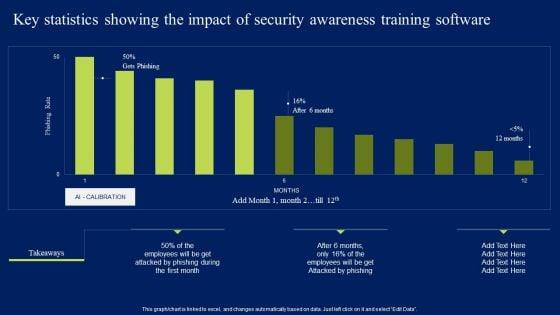

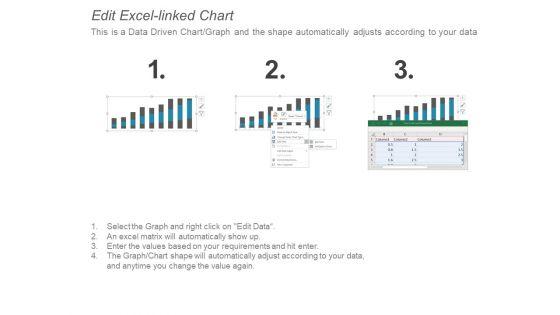
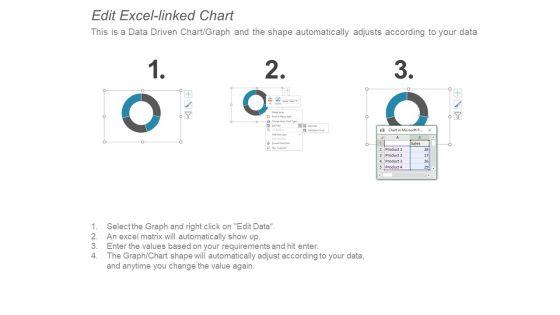
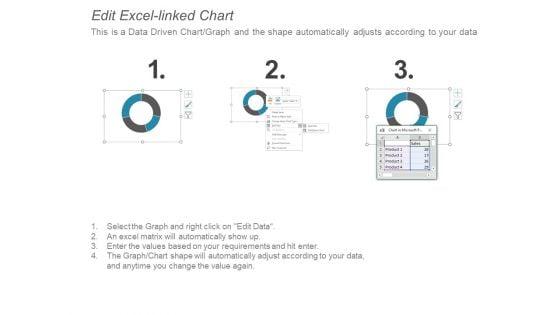
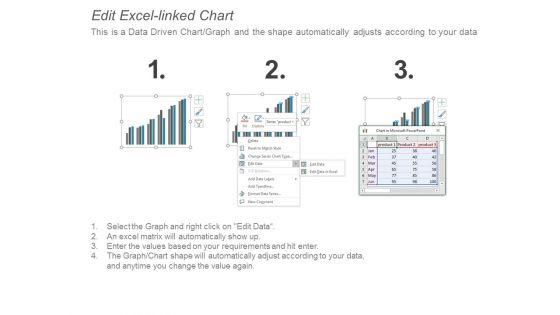
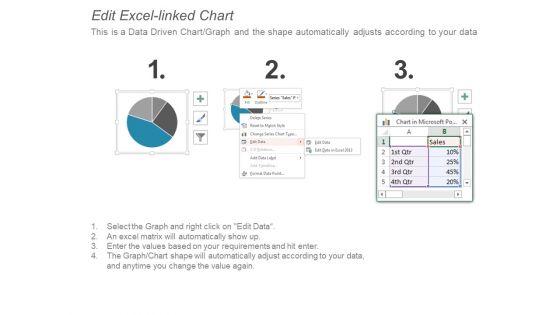
This graph or chart is linked to excel, and changes automatically based on data. Just left click on it and select Edit Data. Slidegeeks is one of the best resources for PowerPoint templates. You can download easily and regulate Key Statistics Showing The Impact Of Security Awareness Training Software Elements PDF for your personal presentations from our wonderful collection. A few clicks is all it takes to discover and get the most relevant and appropriate templates. Use our Templates to add a unique zing and appeal to your presentation and meetings. All the slides are easy to edit and you can use them even for advertisement purposes.
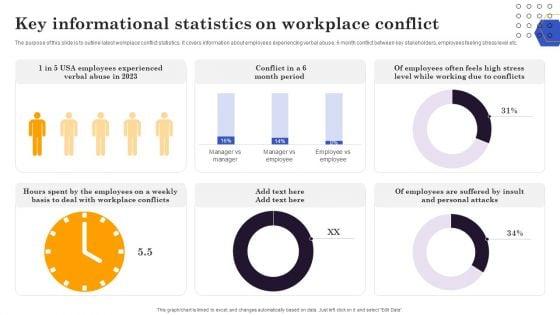
The purpose of this slide is to outline latest workplace conflict statistics. It covers information about employees experiencing verbal abuse, 6 month conflict between key stakeholders, employees feeling stress level etc. There are so many reasons you need a Conflict Resolution Method Key Informational Statistics On Workplace Conflict Elements PDF. The first reason is you can not spend time making everything from scratch, Thus, Slidegeeks has made presentation templates for you too. You can easily download these templates from our website easily.


The following slide outlines activity ratios which can be used by financial managers to analyze the organization efficiency in utilizing the assets. It contains detailed Information about inventory and total assets turnover ratio. Retrieve professionally designed Methods And Approaches To Assess Key Statistics Highlighting Major Types Of Activity Ratios Download PDF to effectively convey your message and captivate your listeners. Save time by selecting pre-made slideshows that are appropriate for various topics, from business to educational purposes. These themes come in many different styles, from creative to corporate, and all of them are easily adjustable and can be edited quickly. Access them as PowerPoint templates or as Google Slides themes. You do not have to go on a hunt for the perfect presentation because Slidegeeks got you covered from everywhere.
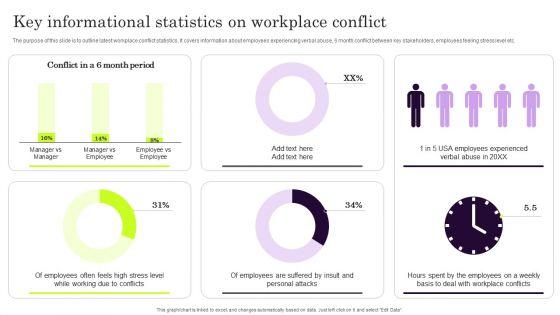

The purpose of this slide is to outline latest workplace conflict statistics. It covers information about employees experiencing verbal abuse, 6 month conflict between key stakeholders, employees feeling stress level etc. Take your projects to the next level with our ultimate collection of Key Informational Statistics On Workplace Conflict Portrait PDF. Slidegeeks has designed a range of layouts that are perfect for representing task or activity duration, keeping track of all your deadlines at a glance. Tailor these designs to your exact needs and give them a truly corporate look with your own brand colors they will make your projects stand out from the rest.

This slide shows statistics which can be used considered by organizations while developing a PR marketing campaign or plan. It includes stats related to PR firms, PR market revenue, PR agencies annual spend etc. Crafting an eye catching presentation has never been more straightforward. Let your presentation shine with this tasteful yet straightforward Public Relations Guide To Enhance Brand Credibility Key Statistics Related To Public Relations Portrait PDF template. It offers a minimalistic and classy look that is great for making a statement. The colors have been employed intelligently to add a bit of playfulness while still remaining professional. Construct the ideal Public Relations Guide To Enhance Brand Credibility Key Statistics Related To Public Relations Portrait PDF that effortlessly grabs the attention of your audience. Begin now and be certain to wow your customers.
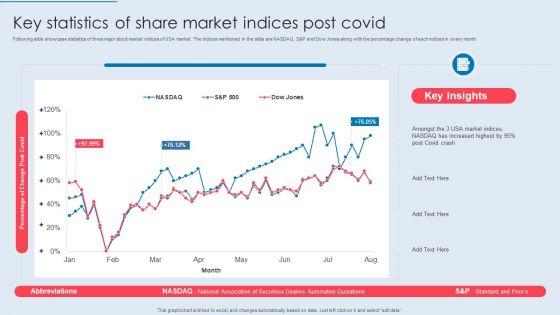
Following slide showcase statistics of three major stock market indices of USA market. The indices mentioned in the slide are NASDAQ, S and P and Dow Jones along with the percentage change of each indices in every month. Showcasing this set of slides titled Key Statistics Of Share Market Indices Post Covid Sample PDF. The topics addressed in these templates are Percentage Change Post Covid, Increased Highest, Indices Post Covid. All the content presented in this PPT design is completely editable. Download it and make adjustments in color, background, font etc. as per your unique business setting.


This modern and well arranged Implementing Cybersecurity Awareness Program To Prevent Attacks Key Statistics Showing The Impact Of Security Clipart PDF provides lots of creative possibilities. It is very simple to customize and edit with the Powerpoint Software. Just drag and drop your pictures into the shapes. All facets of this template can be edited with Powerpoint no extra software is necessary. Add your own material, put your images in the places assigned for them, adjust the colors, and then you can show your slides to the world, with an animated slide included.
SHOW
- 60
- 120
- 180
DISPLAYING: 60 of 900 Item(s)
Page