 AI PPT Maker
 Templates
 PPT Bundles
 Design Services
 Business PPTs
 Business Plan
 Management
 Strategy
 Introduction PPT
 Roadmap
 Self Introduction
 Timelines
 Process
 Marketing
 Agenda
 Technology
 Medical
 Startup Business Plan
 Cyber Security
 Dashboards
 SWOT
SWOT Proposals
 Education
 Pitch Deck
 Digital Marketing
 KPIs
KPIs Project Management
 Product Management
 Artificial Intelligence
 Target Market
 Communication
 Supply Chain
 Google Slides
 Research Services
 One Pagers
 All Categories
Kpi Analysis PowerPoint Presentation Templates and Google Slides
14 Item(s)
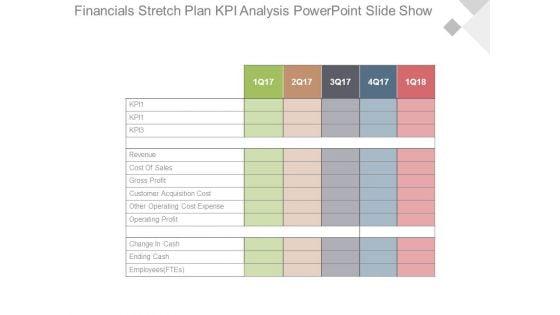


This is a financials stretch plan kpi analysis powerpoint slide show. This is a five stage process. The stages in this process are kpi1, kpi1, kpi3, revenue, cost of sales, gross profit, customer acquisition cost, other operating cost expense, operating profit, change in cash, ending cash, employees ftes.


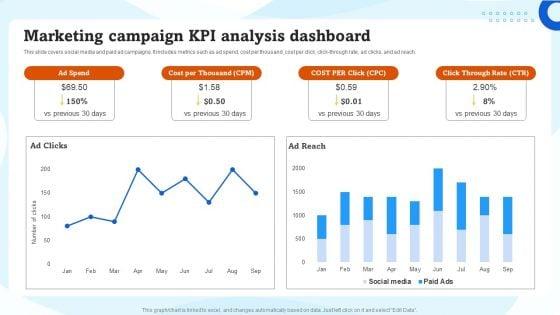
This slide covers social media and paid ad campaigns. It includes metrics such as ad spend, cost per thousand, cost per click, click-through rate, ad clicks, and ad reach. Coming up with a presentation necessitates that the majority of the effort goes into the content and the message you intend to convey. The visuals of a PowerPoint presentation can only be effective if it supplements and supports the story that is being told. Keeping this in mind our experts created Marketing Campaign KPI Analysis Dashboard Ppt Inspiration Example File PDF to reduce the time that goes into designing the presentation. This way, you can concentrate on the message while our designers take care of providing you with the right template for the situation.


This slide depicts the dashboard used to analyze the key performance indicators of the revenue planning process. The purpose of this template is to evaluate the revenue based on the actual and budget specified. It includes information related to the product, total, actual and budget revenue. Showcasing this set of slides titled KPI Analysis Of Revenue Planning Procedure Professional PDF. The topics addressed in these templates are Kpi Analysis, Revenue Planning Procedure. All the content presented in this PPT design is completely editable. Download it and make adjustments in color, background, font etc. as per your unique business setting.
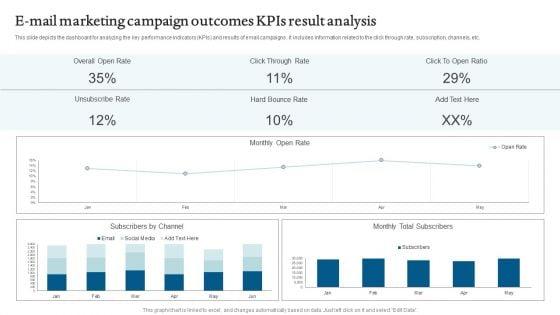

Showcasing this set of slides titled E Mail Marketing Campaign Outcomes Kpis Result Analysis Mockup PDF. The topics addressed in these templates are Marketing Campaign, Outcomes Kpis, Result Analysis. All the content presented in this PPT design is completely editable. Download it and make adjustments in color, background, font etc. as per your unique business setting.
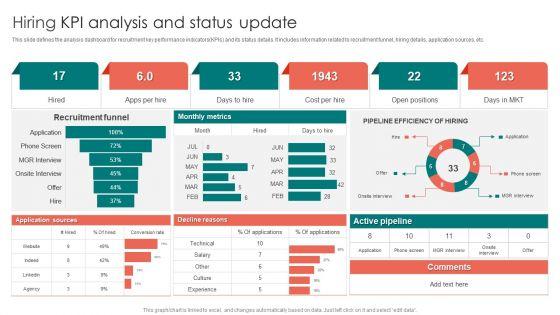
This slide defines the analysis dashboard for recruitment key performance indicators KPIs and its status details. It includes information related to recruitment funnel, hiring details, application sources, etc. Showcasing this set of slides titled Hiring KPI Analysis And Status Update Ppt PowerPoint Presentation Gallery Show PDF. The topics addressed in these templates are Recruitment Funnel, Monthly Metrics, Active Pipeline. All the content presented in this PPT design is completely editable. Download it and make adjustments in color, background, font etc. as per your unique business setting.
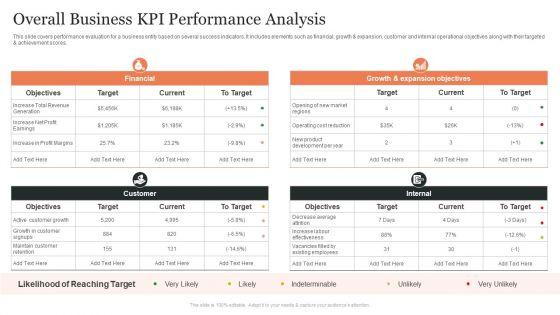


This slide covers performance evaluation for a business entity based on several success indicators. It includes elements such as financial, growth and expansion, customer and internal operational objectives along with their targeted and achievement scores. Pitch your topic with ease and precision using this Overall Business KPI Performance Analysis Ppt Show Professional PDF. This layout presents information on Internal, Customer, Financial. It is also available for immediate download and adjustment. So, changes can be made in the color, design, graphics or any other component to create a unique layout.

This slide covers the dashboard for analyzing the quality assurance service objectives it includes information related to the QA team, performance rating, average scores and results. Showcasing this set of slides titled Quality Assurance QA Services KPI Analysis Demonstration PDF. The topics addressed in these templates are Quality Assurance Team, Average Result Area, Result Assurance Objective. All the content presented in this PPT design is completely editable. Download it and make adjustments in color, background, font etc. as per your unique business setting.


The following slide showcases business sustainability resource planning sheet. It provides information about department, position, qualification required, experience required, current status. The best PPT templates are a great way to save time, energy, and resources. Slidegeeks have 100 percent editable powerpoint slides making them incredibly versatile. With these quality presentation templates, you can create a captivating and memorable presentation by combining visually appealing slides and effectively communicating your message. Download KPI Analysis Of HR Department On Power BI Ppt Powerpoint SS from Slidegeeks and deliver a wonderful presentation. The following slide showcases business sustainability resource planning sheet. It provides information about department, position, qualification required, experience required, current status.
Mentioned slide displays key parameters used to determine business growth and decline over the years. It includes key parameters such as website traffic, customers, employee turnover, customer conversion rate, number of websites designed annually, etc. Present like a pro with Comprehensive Guide For Website Business Progress Tracking Kpis Analysis. Create beautiful presentations together with your team, using our easy-to-use presentation slides. Share your ideas in real-time and make changes on the fly by downloading our templates. So whether you are in the office, on the go, or in a remote location, you can stay in sync with your team and present your ideas with confidence. With Slidegeeks presentation got a whole lot easier. Grab these presentations today. Mentioned slide displays key parameters used to determine business growth and decline over the years. It includes key parameters such as website traffic, customers, employee turnover, customer conversion rate, number of websites designed annually, etc.
Mentioned slide displays key parameters used to determine business growth and decline over the years. It includes key parameters such as website traffic, customers, employee turnover, customer conversion rate, number of websites designed annually, etc. Present like a pro with Managing Technical And Non Business Progress Tracking Kpis Analysis. Create beautiful presentations together with your team, using our easy-to-use presentation slides. Share your ideas in real-time and make changes on the fly by downloading our templates. So whether you are in the office, on the go, or in a remote location, you can stay in sync with your team and present your ideas with confidence. With Slidegeeks presentation got a whole lot easier. Grab these presentations today. Mentioned slide displays key parameters used to determine business growth and decline over the years. It includes key parameters such as website traffic, customers, employee turnover, customer conversion rate, number of websites designed annually, etc.
Mentioned slide displays key parameters used to determine business growth and decline over the years. It includes key parameters such as website traffic, customers, employee turnover, customer conversion rate, number of websites designed annually, etc. Do you have an important presentation coming up Are you looking for something that will make your presentation stand out from the rest Look no further than Web Consulting Business Business Progress Tracking Kpis Analysis. With our professional designs, you can trust that your presentation will pop and make delivering it a smooth process. And with Slidegeeks, you can trust that your presentation will be unique and memorable. So why wait Grab Web Consulting Business Business Progress Tracking Kpis Analysis today and make your presentation stand out from the rest Mentioned slide displays key parameters used to determine business growth and decline over the years. It includes key parameters such as website traffic, customers, employee turnover, customer conversion rate, number of websites designed annually, etc.
14 Item(s)