AI PPT Maker
Templates
PPT Bundles
Design Services
Business PPTs
Business Plan
Management
Strategy
Introduction PPT
Roadmap
Self Introduction
Timelines
Process
Marketing
Agenda
Technology
Medical
Startup Business Plan
Cyber Security
Dashboards
SWOT
Proposals
Education
Pitch Deck
Digital Marketing
KPIs
Project Management
Product Management
Artificial Intelligence
Target Market
Communication
Supply Chain
Google Slides
Research Services
 One Pagers
All Categories
Management metrics PowerPoint Presentation Templates and Google Slides
SHOW
- 60
- 120
- 180
DISPLAYING: 60 of 659 Item(s)
Page




















Slide 1 of 68
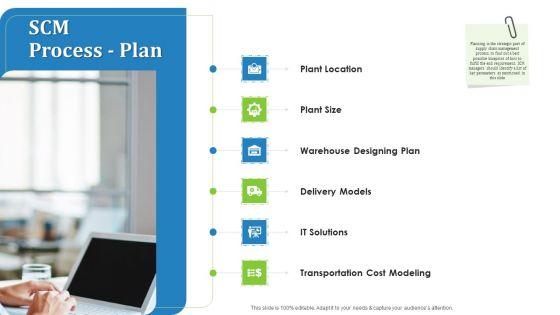
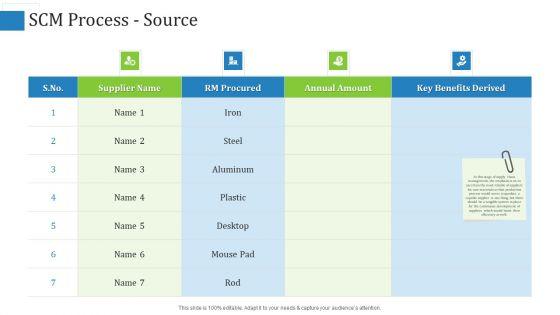
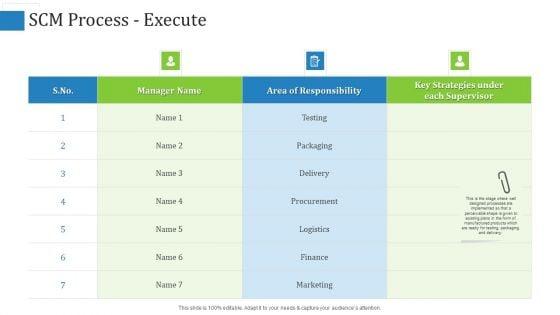
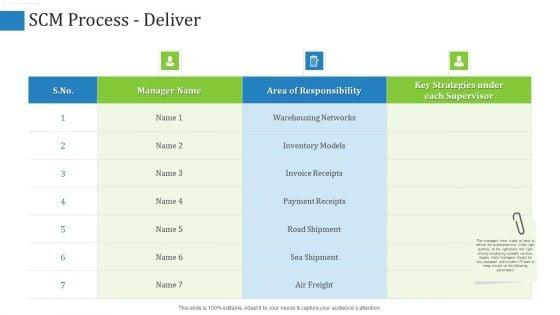
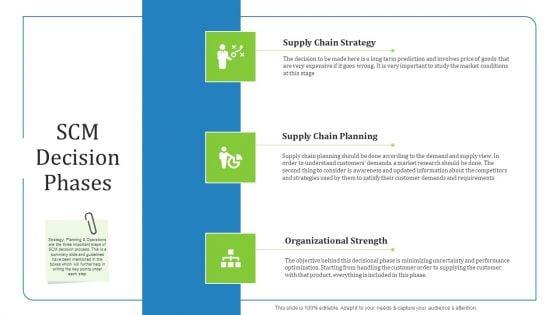
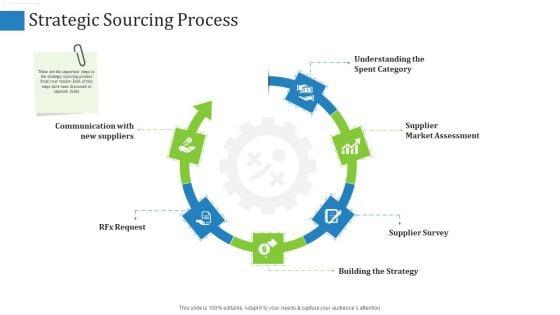
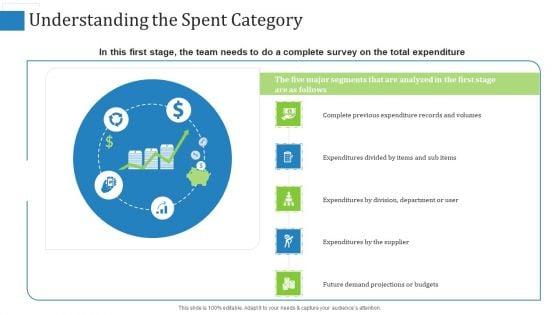
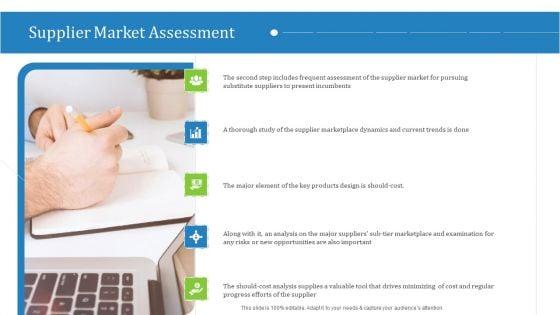
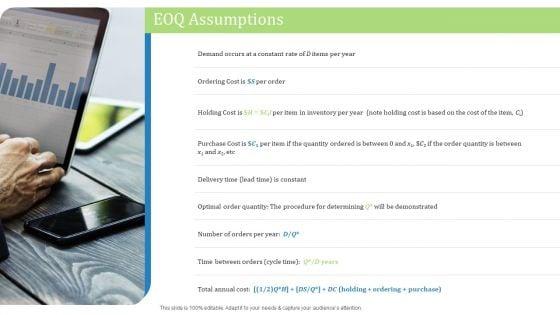
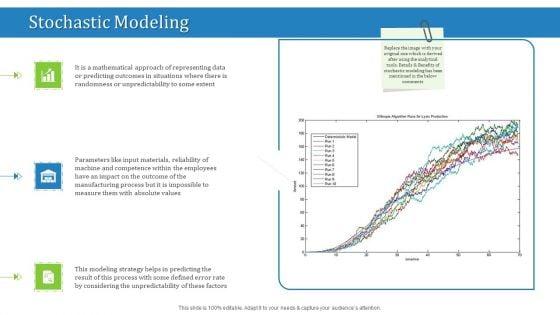
This complete deck acts as a great communication tool. It helps you in conveying your business message with personalized sets of graphics, icons etc. Comprising a set of sixty eight slides, this complete deck can help you persuade your audience. It also induces strategic thinking as it has been thoroughly researched and put together by our experts. Not only is it easily downloadable but also editable. The color, graphics, theme any component can be altered to fit your individual needs. So grab it now.




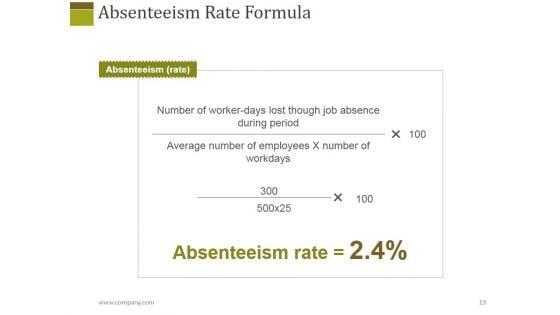


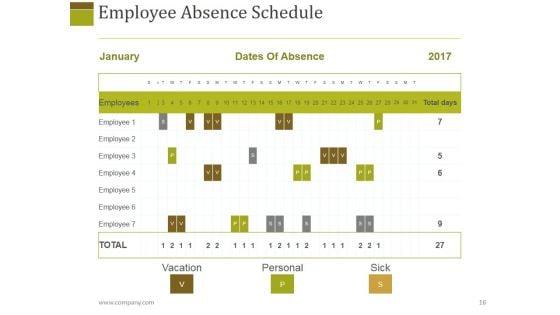


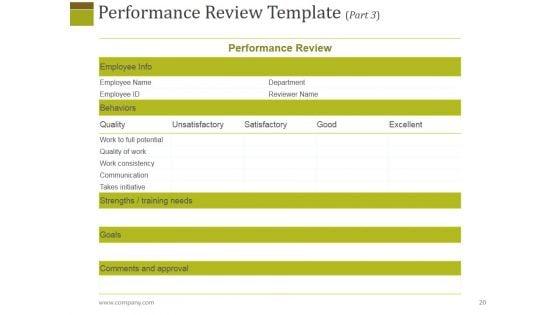










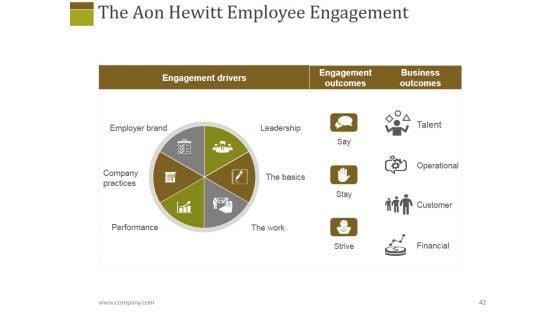
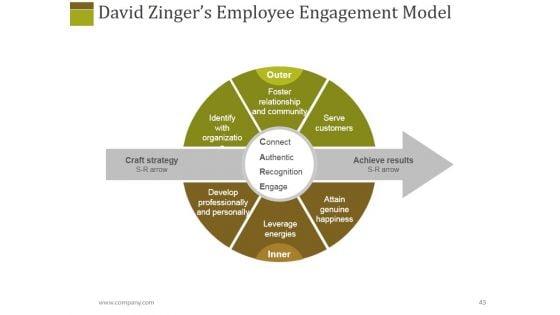
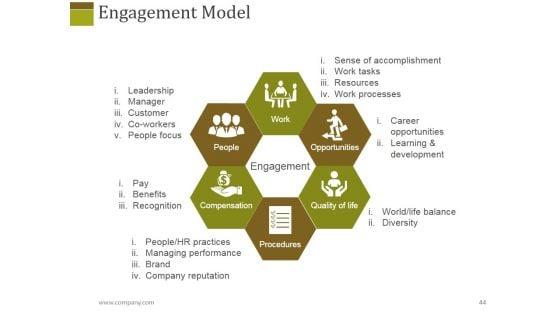


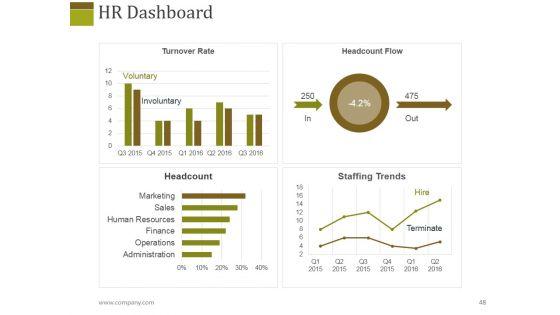






Slide 1 of 61
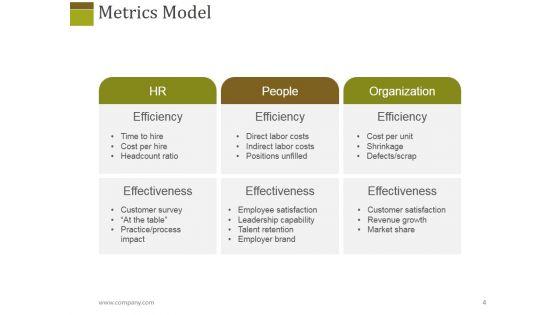
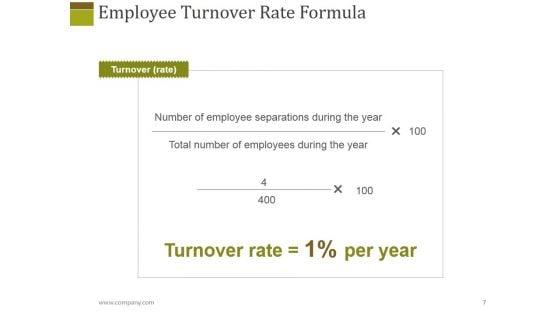
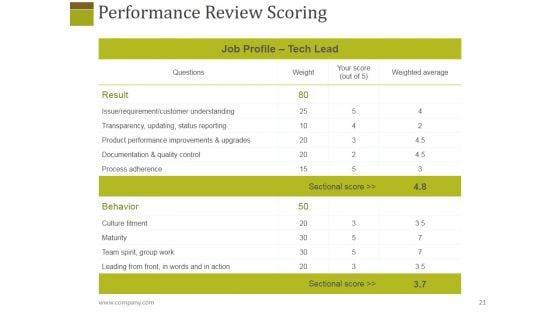
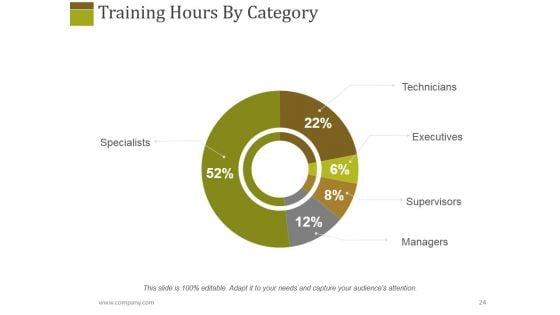
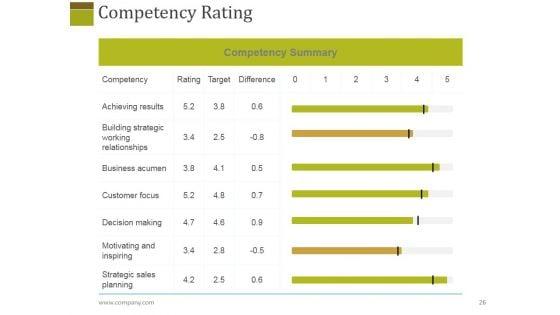
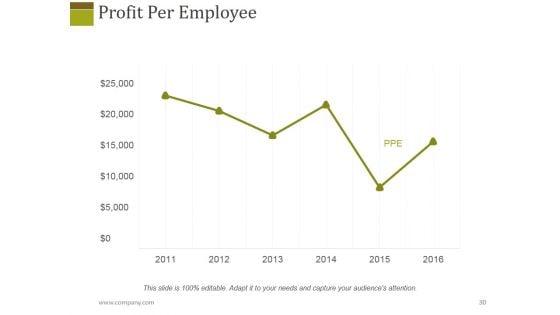
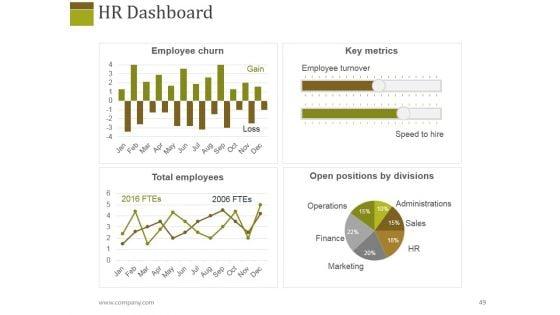
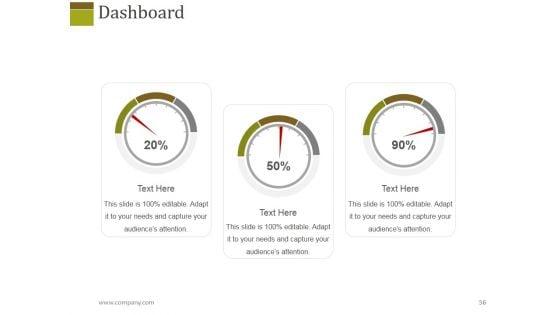
Human Resources Performance Management Metrics Ppt PowerPoint Presentation Complete Deck With Slides
This is a human resources performance management metrics ppt powerpoint presentation complete deck with slides. This is a one stage process. The stages in this process are management, matrix, performance, technology, business.






















Slide 1 of 55
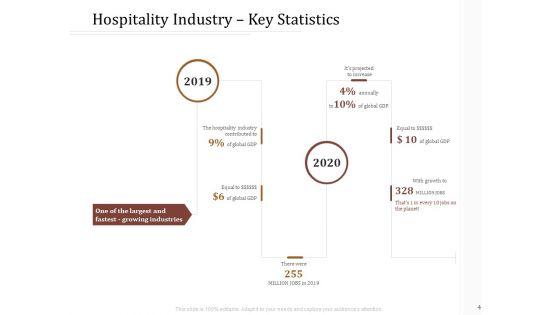
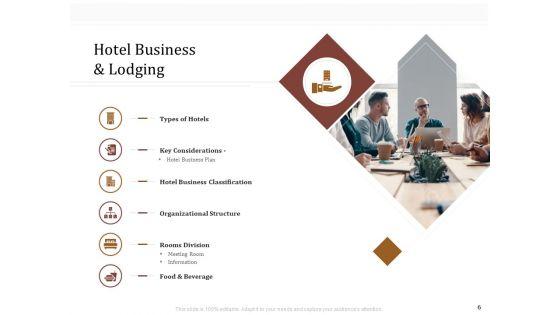
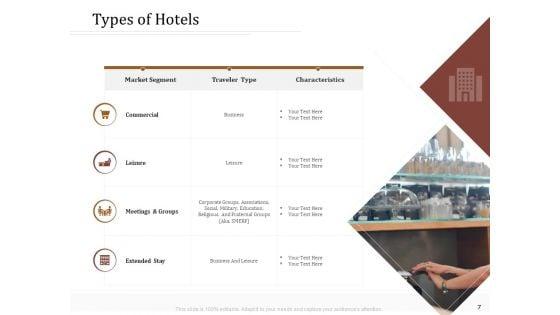
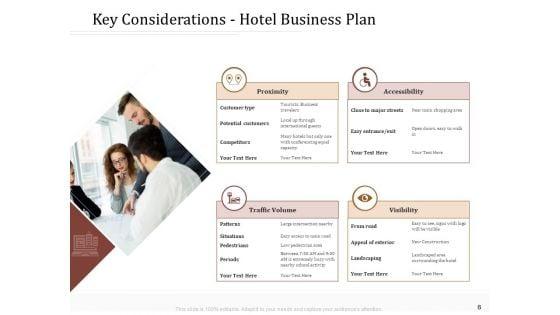
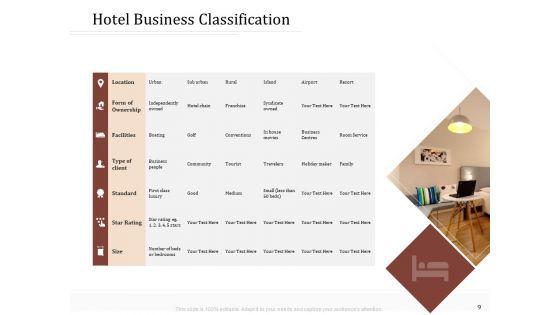
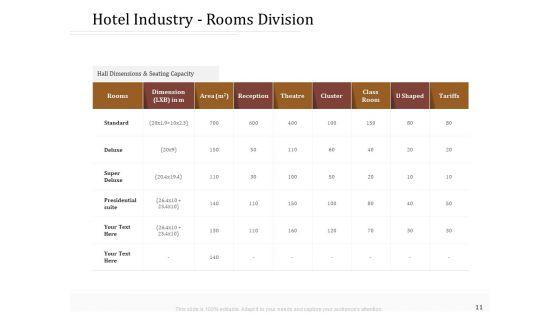
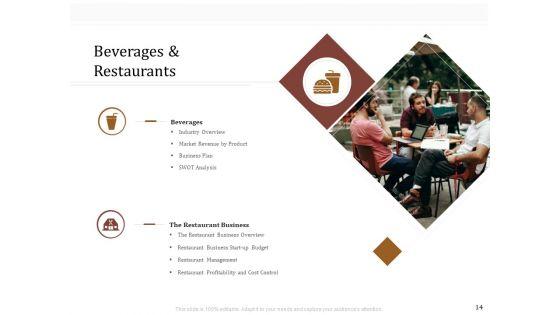
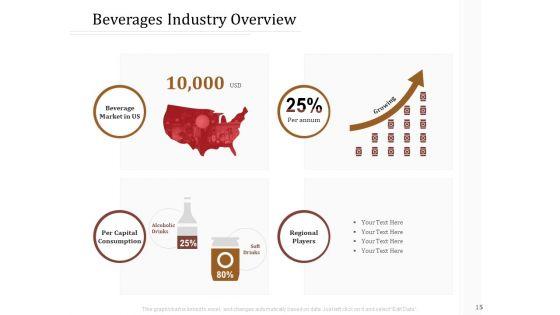
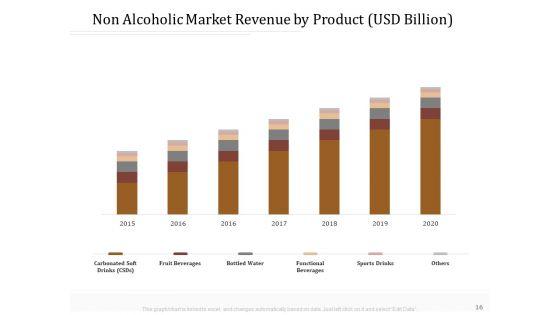
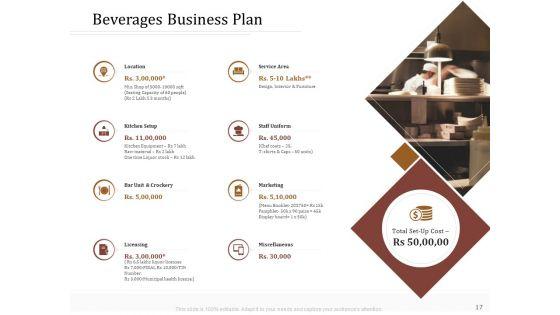
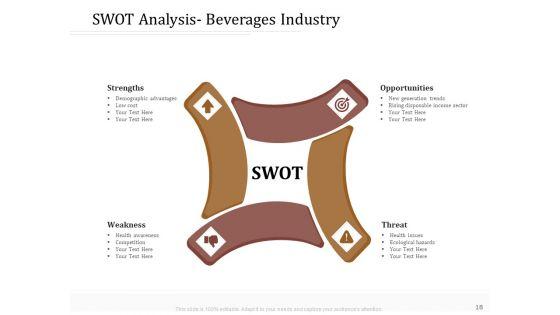
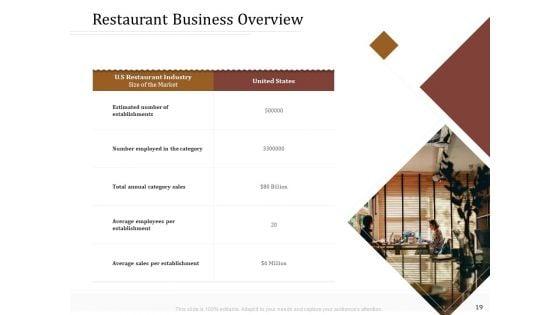
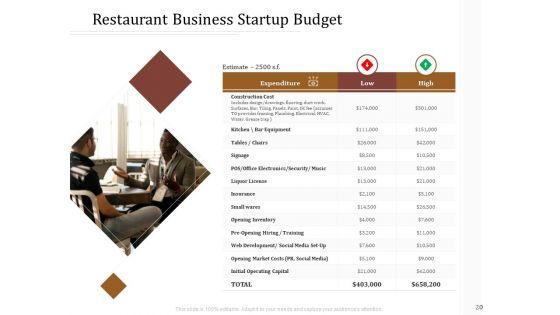
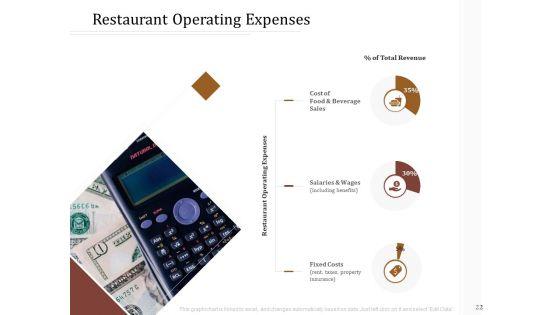
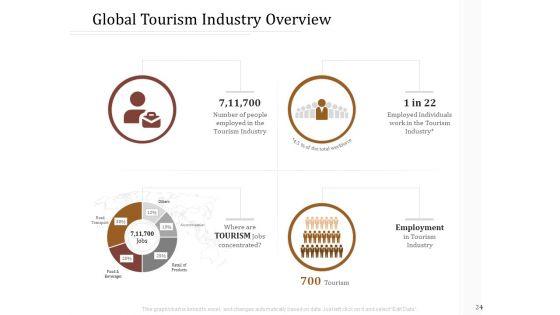
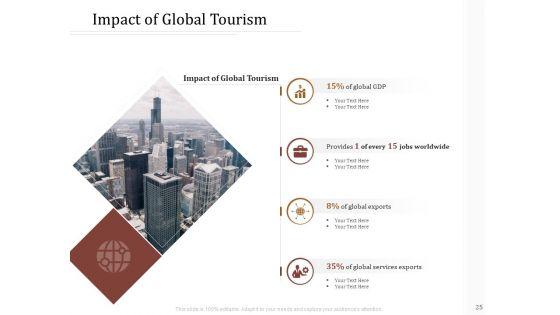
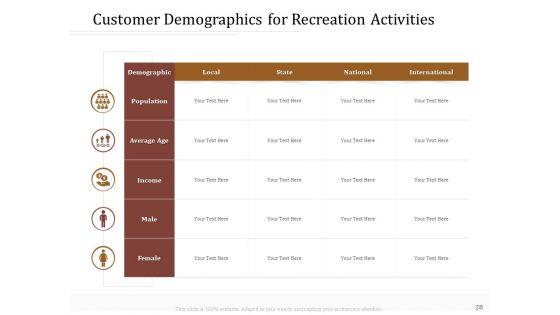
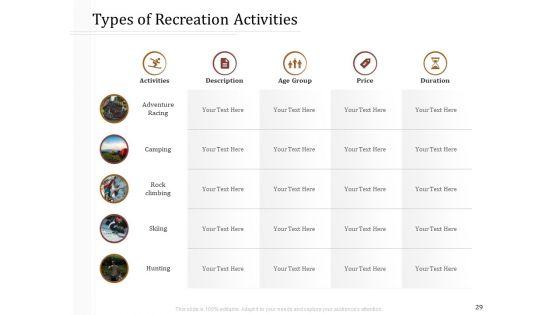
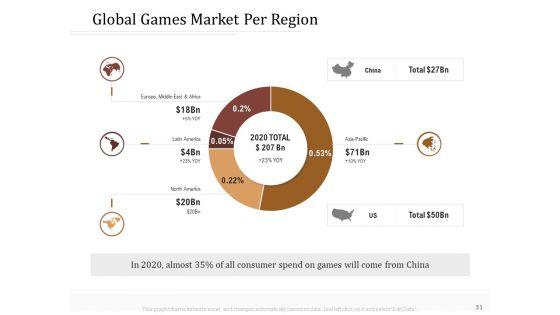
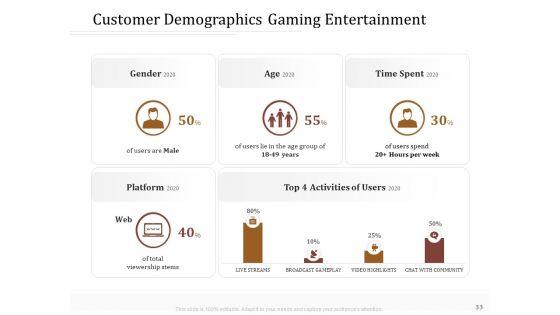
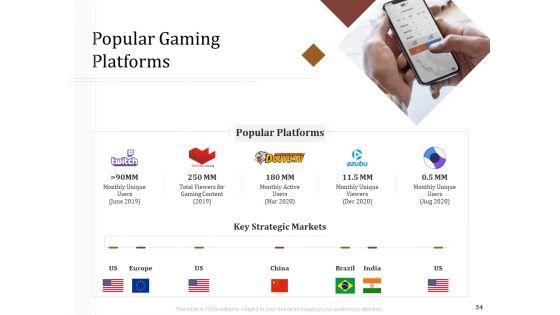
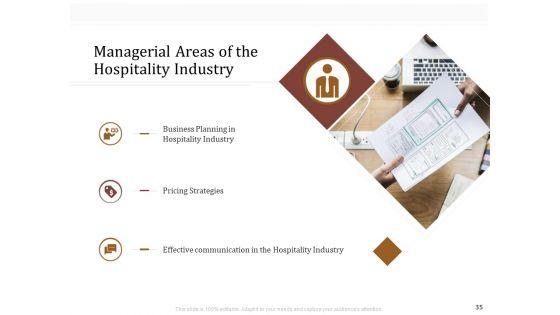
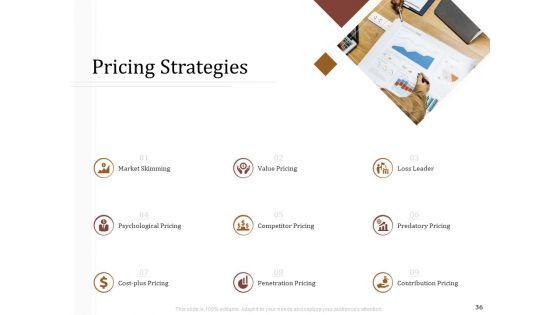
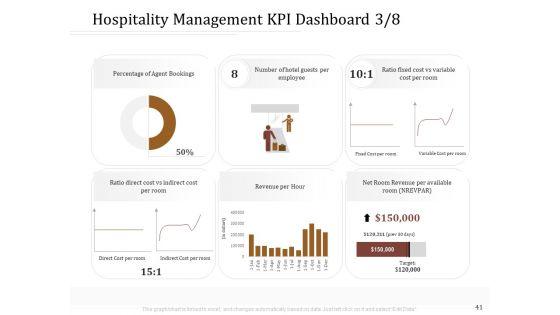
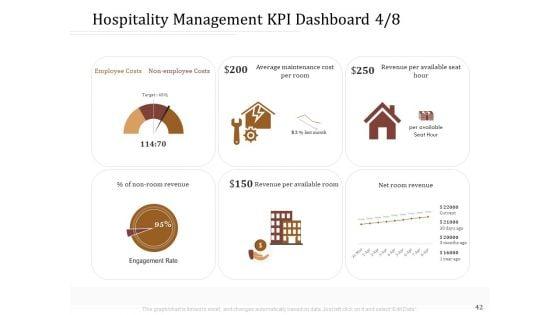
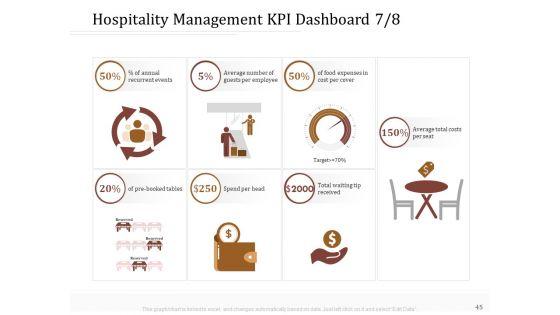
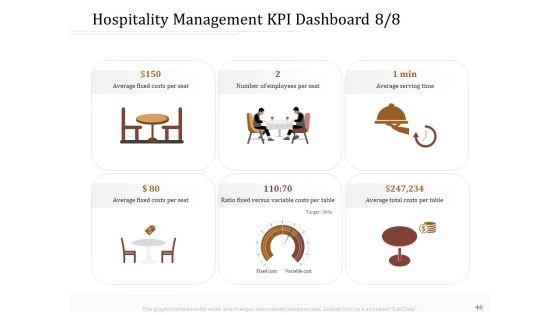
Presenting this set of slides with name key metrics for hotel administration management ppt powerpoint presentation complete deck with slides. The topics discussed in these slides are business, industry, tourism, recreation, attractions. This is a completely editable PowerPoint presentation and is available for immediate download. Download now and impress your audience.







Slide 1 of 13
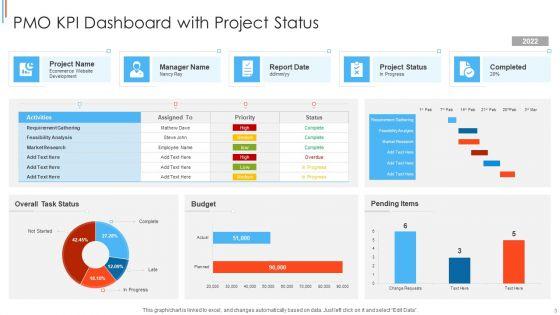
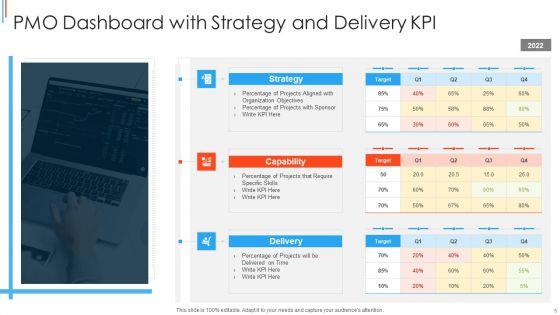
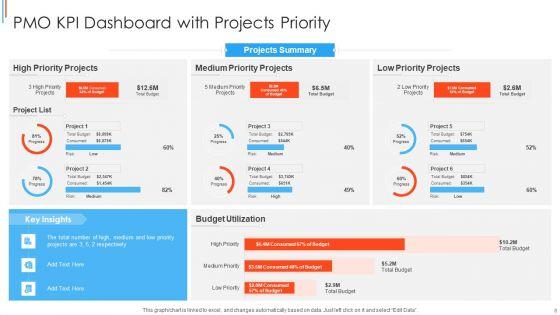
This Performance Metrics For Project Management Office Ppt PowerPoint Presentation Complete Deck With Slides acts as backup support for your ideas, vision, thoughts, etc. Use it to present a thorough understanding of the topic. This PPT slideshow can be utilized for both in-house and outside presentations depending upon your needs and business demands. Entailing twelve slides with a consistent design and theme, this template will make a solid use case. As it is intuitively designed, it suits every business vertical and industry. All you have to do is make a few tweaks in the content or any other component to design unique presentations. The biggest advantage of this complete deck is that it can be personalized multiple times once downloaded. The color, design, shapes, and other elements are free to modify to add personal touches. You can also insert your logo design in this PPT layout. Therefore a well-thought and crafted presentation can be delivered with ease and precision by downloading this Performance Metrics For Project Management Office Ppt PowerPoint Presentation Complete Deck With Slides PPT slideshow.

Slide 1 of 12
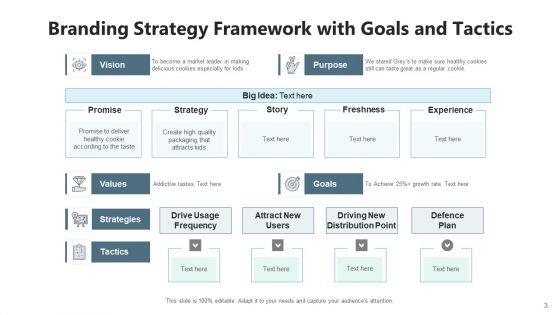
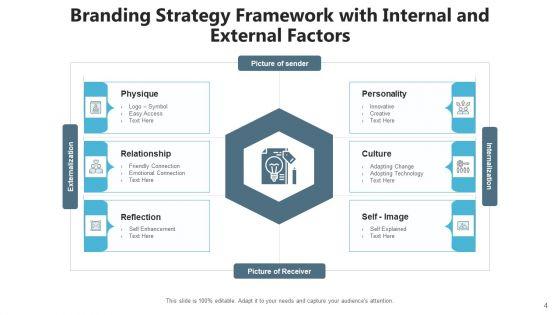
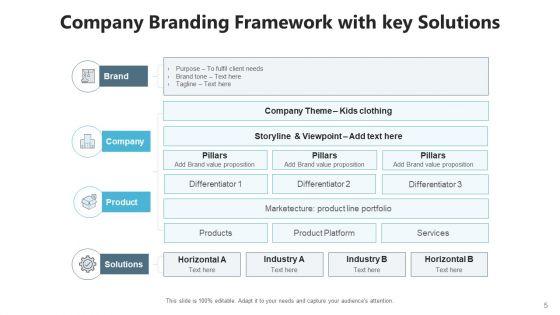
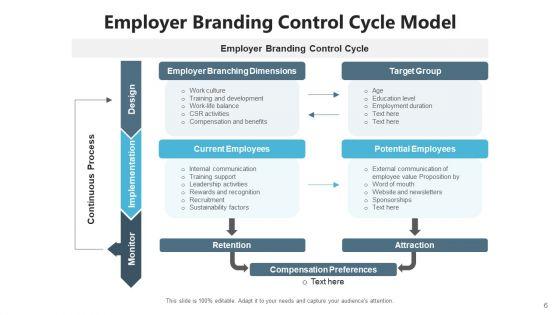
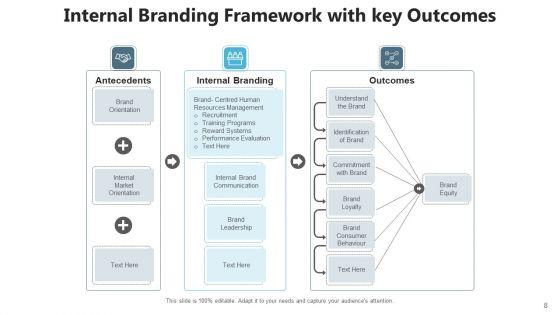
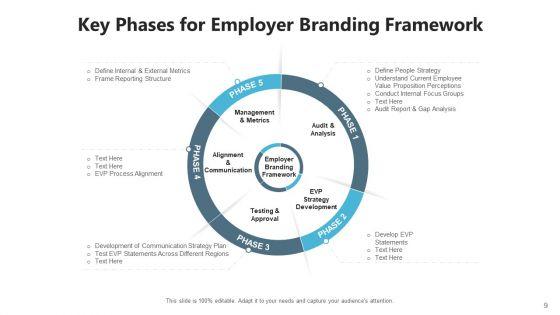
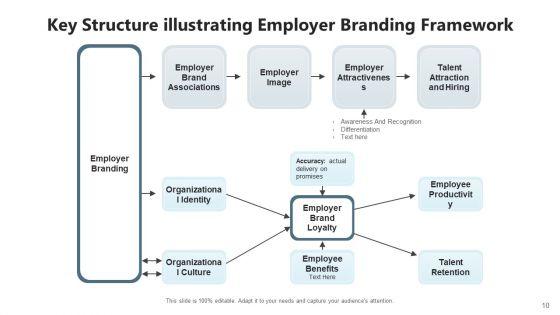
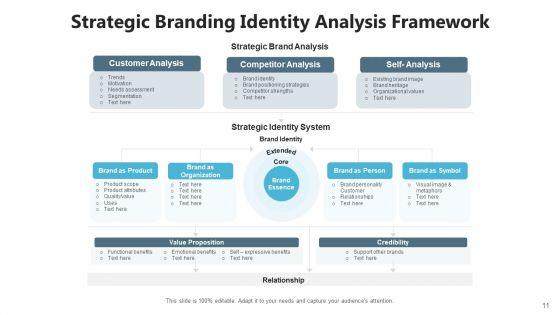
This branding architecture management metrics ppt powerpoint presentation complete deck with slides acts as backup support for your ideas, vision, thoughts, etc. Use it to present a thorough understanding of the topic. This PPT slideshow can be utilized for both in-house and outside presentations depending upon your needs and business demands. Entailing twelve slides with a consistent design and theme, this template will make a solid use case. As it is intuitively designed, it suits every business vertical and industry. All you have to do is make a few tweaks in the content or any other component to design unique presentations. The biggest advantage of this complete deck is that it can be personalized multiple times once downloaded. The color, design, shapes, and other elements are free to modify to add personal touches. You can also insert your logo design in this PPT layout. Therefore a well-thought and crafted presentation can be delivered with ease and precision by downloading this branding architecture management metrics ppt powerpoint presentation complete deck with slides PPT slideshow.
Slide 1 of 7
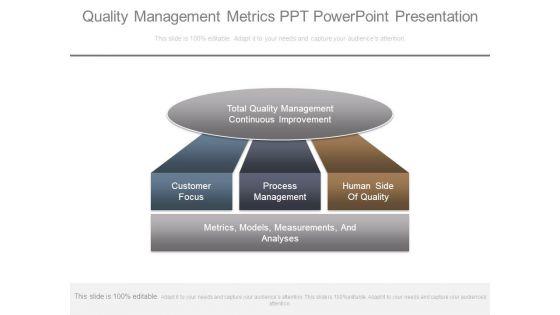
This is a quality management metrics ppt powerpoint presentation. This is a three stage process. The stages in this process are total quality management continuous improvement, customer focus, process management, human side of quality, metrics, models, measurements and analyses.




Slide 1 of 7
This is a sample project management metrics ppt powerpoint show. This is a seven stage process. The stages in this process are impart, routes, sections, summary, estimates, metadata, samples, create tops, import samples, validate, lrs, sections, samples, coverage, verify, sample, adequacy, expansion factor, sample data item check, reports, spatial intersection, impart, routes, sections, summary, estimates, metadata, samples, create tops, import samples, validate, lrs, sections, samples, coverage, verify, sample, adequacy, expansion factor, sample data item check, reports, spatial intersection.


Slide 1 of 7
This is a metrics based management layout presentation powerpoint templates. This is a three stage process. The stages in this process are metrics review by dd dm, pl reviews the data, pm approves the metrics.
Slide 1 of 7
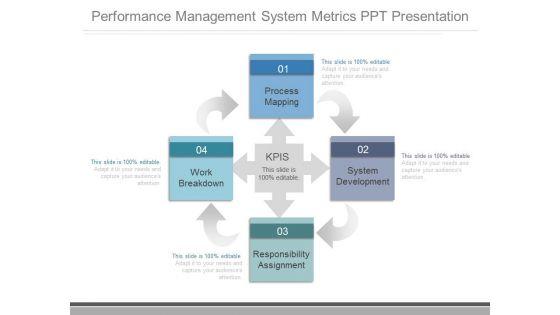
This is a performance management system metrics ppt presentation. This is a four stage process. The stages in this process are process mapping, work breakdown, responsibility assignment, system development, kpis.
Slide 1 of 6
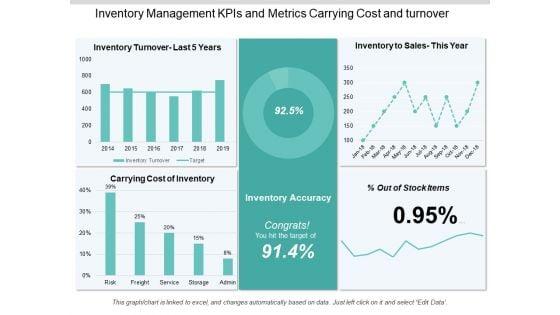
This is a inventory management kpis and metrics carrying cost and turnover ppt powerpoint presentation information. This is a five stage process. The stages in this process are logistics performance, logistics dashboard, logistics kpis.


Slide 1 of 6
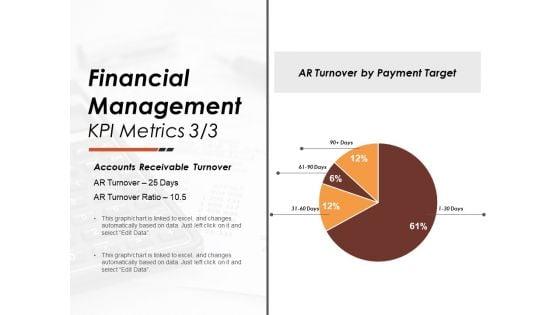
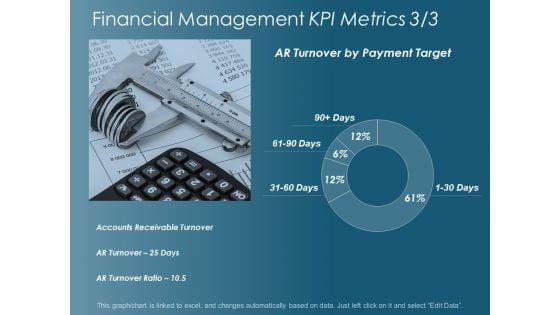
This is a financial management kpi metrics 3 3 ppt powerpoint presentation summary themes. This is a four stage process. The stages in this process are finance, strategy, marketing, management, business.

Slide 1 of 6
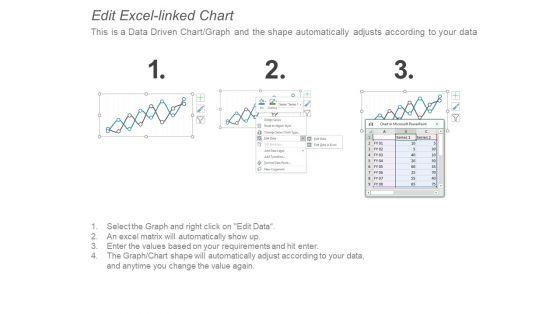
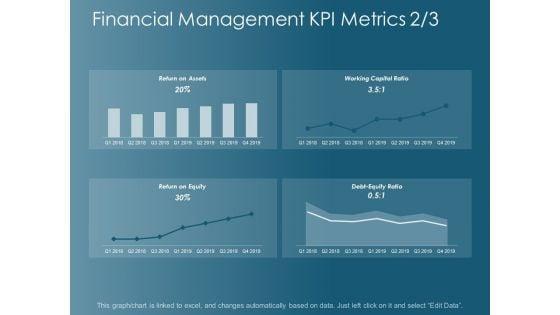
This is a financial management kpi metrics 2 3 ppt powerpoint presentation professional objects. This is a four stage process. The stages in this process are finance, strategy, marketing, management, business.


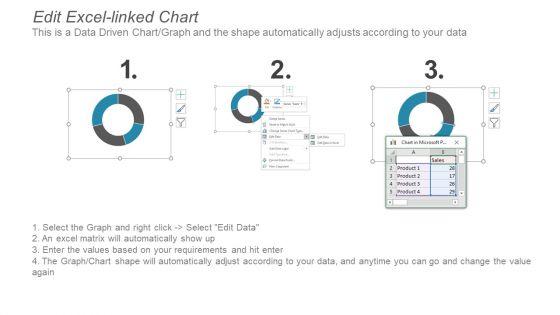

Slide 1 of 6
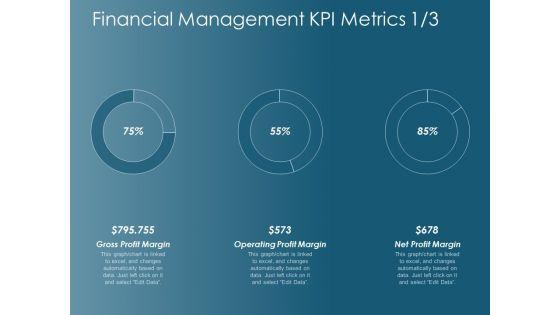
This is a financial management kpi metrics 1 3 ppt powerpoint presentation ideas mockup. This is a three stage process. The stages in this process are finance, strategy, marketing, compare, business.


Slide 1 of 6
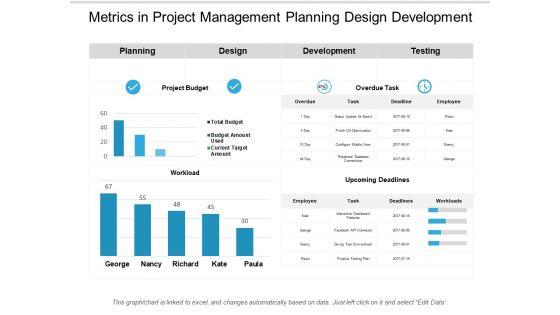
This is a metrics in project management planning design development ppt powerpoint presentation outline show. This is a two stage process. The stages in this process are project dashboard, project kpis, project metrics.


Slide 1 of 6
This is a financial management kpi metrics operating profit margin ppt powerpoint presentation infographic template images. This is a three stage process. The stages in this process are finance, marketing, management, investment, analysis.



Slide 1 of 6
This is a financial management kpi metrics management ppt powerpoint presentation infographic template graphic images. This is a four stage process. The stages in this process are finance, marketing, management, investment, analysis.
Slide 1 of 6
This is a financial management kpi metrics business ppt powerpoint presentation styles diagrams. This is a four stage process. The stages in this process are finance, marketing, management, investment, analysis.




Slide 1 of 6
This is a financial management kpi metrics strategy ppt powerpoint presentation professional show. This is a four stage process. The stages in this process are finance, marketing, management, investment, analysis.


Slide 1 of 6
This is a financial management kpi metrics management ppt powerpoint presentation file template. This is a four stage process. The stages in this process are finance, marketing, management, investment, analysis.


Slide 1 of 6
This is a financial management kpi metrics business ppt powerpoint presentation model example. This is a three stage process. The stages in this process are finance, marketing, management, investment, analysis.


Slide 1 of 6
This is a financial management kpi metrics process ppt powerpoint presentation slides graphics download. This is a four stage process. The stages in this process are finance, marketing, management, investment, analysis.


Slide 1 of 6
This is a financial management kpi metrics management ppt powerpoint presentation outline themes. This is a three stage process. The stages in this process are finance, marketing, management, investment, analysis.

Slide 1 of 6
This is a financial management kpi metrics business ppt powerpoint presentation gallery file formats. This is a four stage process. The stages in this process are finance, marketing, management, investment, analysis.


Slide 1 of 5
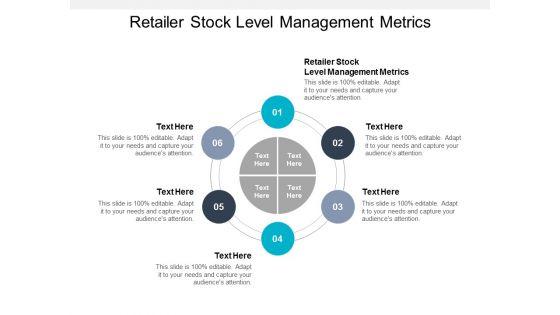
Presenting this set of slides with name retailer stock level management metrics ppt powerpoint presentation example file cpb. This is an editable Powerpoint six stages graphic that deals with topics like retailer stock level management metrics to help convey your message better graphically. This product is a premium product available for immediate download and is 100 percent editable in Powerpoint. Download this now and use it in your presentations to impress your audience.



Slide 1 of 5
Presenting this set of slides with name file management quality control and reporting metrics ppt powerpoint presentation gallery tips. This is a five stage process. The stages in this process are document review, document analysis, document evaluation. This is a completely editable PowerPoint presentation and is available for immediate download. Download now and impress your audience.


Slide 1 of 5
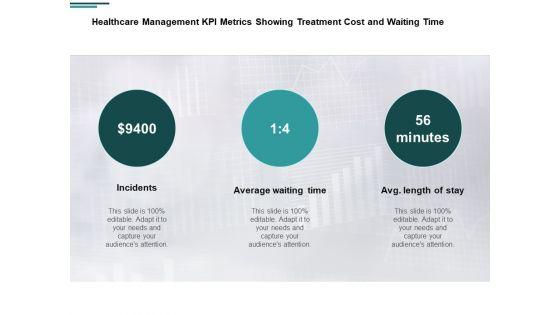
Presenting this set of slides with name healthcare management kpi metrics showing treatment cost and waiting time ppt powerpoint presentation ideas files. This is a three stage process. The stages in this process are business, management, planning, strategy, marketing. This is a completely editable PowerPoint presentation and is available for immediate download. Download now and impress your audience.
Slide 1 of 5
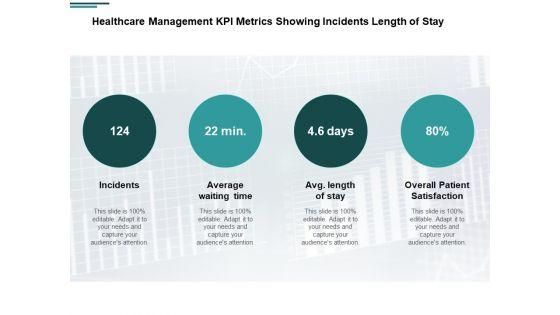
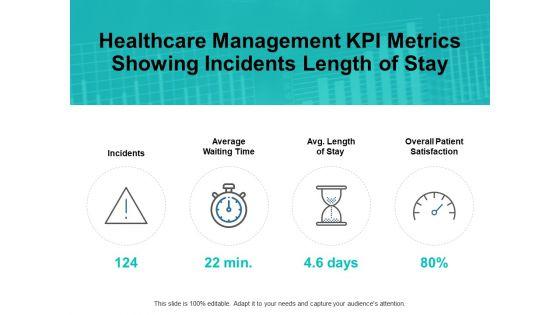
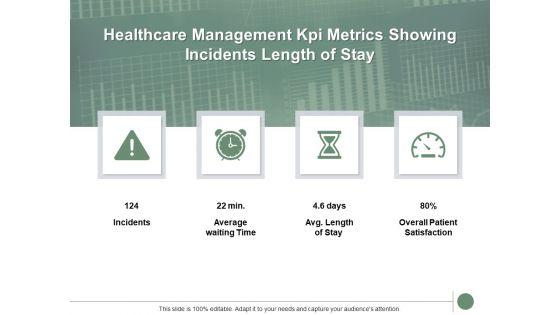
Presenting this set of slides with name healthcare management kpi metrics showing incidents length of stay ppt powerpoint presentation icon background. This is a four stage process. The stages in this process are incidents, average waiting time, overall patient satisfaction, management, marketing. This is a completely editable PowerPoint presentation and is available for immediate download. Download now and impress your audience.


Slide 1 of 5
Presenting this set of slides with name healthcare management kpi metrics showing treatment cost and waiting time ppt powerpoint presentation styles slideshow. This is a three stage process. The stages in this process are incidents, average waiting time, business, management, marketing. This is a completely editable PowerPoint presentation and is available for immediate download. Download now and impress your audience.

Slide 1 of 5
Presenting this set of slides with name healthcare management kpi metrics showing incidents length of stay ppt powerpoint presentation layouts graphic images. This is a four stage process. The stages in this process are incidents, average waiting time, overall patient satisfaction, management, marketing. This is a completely editable PowerPoint presentation and is available for immediate download. Download now and impress your audience.


Slide 1 of 5
Presenting this set of slides with name healthcare management kpi metrics showing treatment cost and waiting time ppt powerpoint presentation portfolio files. This is a three stage process. The stages in this process are process, business, management, planning, strategy. This is a completely editable PowerPoint presentation and is available for immediate download. Download now and impress your audience.
Slide 1 of 5
Presenting this set of slides with name healthcare management kpi metrics showing incidents length of stay ppt powerpoint presentation summary background images. This is a four stage process. The stages in this process are process, business, management, planning, strategy. This is a completely editable PowerPoint presentation and is available for immediate download. Download now and impress your audience.


Slide 1 of 5
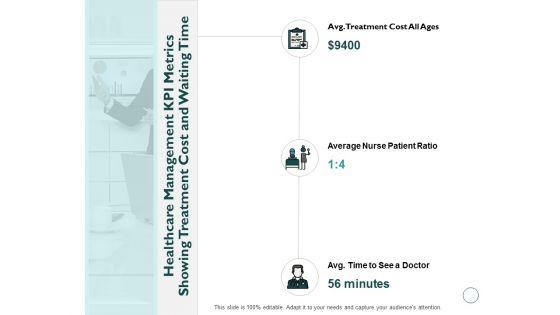
Presenting this set of slides with name healthcare management kpi metrics showing treatment cost and waiting time ppt powerpoint presentation styles pictures. This is a three stage process. The stages in this process are business, management, planning, strategy, marketing. This is a completely editable PowerPoint presentation and is available for immediate download. Download now and impress your audience.


Slide 1 of 5
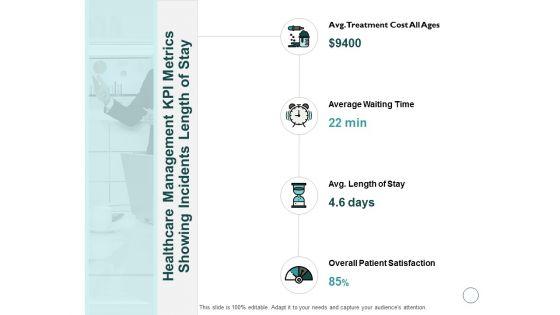
Presenting this set of slides with name healthcare management kpi metrics showing incidents length of stay ppt powerpoint presentation outline maker. This is a four stage process. The stages in this process are business, management, planning, strategy, marketing. This is a completely editable PowerPoint presentation and is available for immediate download. Download now and impress your audience.


Slide 1 of 5
Presenting this set of slides with name healthcare management kpi metrics showing treatment cost and waiting time ppt powerpoint presentation model layout ideas. This is a three stage process. The stages in this process are treatment, average, management, cost, treatment. This is a completely editable PowerPoint presentation and is available for immediate download. Download now and impress your audience.


Slide 1 of 5
Presenting this set of slides with name healthcare management kpi metrics showing incidents length of stay ppt powerpoint presentation layout. This is a four stage process. The stages in this process are incidents, satisfaction, compare, dashboard, threat. This is a completely editable PowerPoint presentation and is available for immediate download. Download now and impress your audience.
Slide 1 of 5
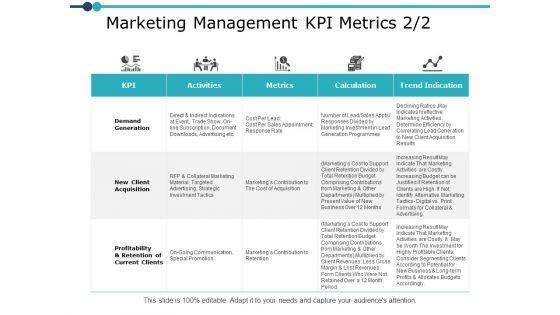
This is a marketing management kpi metrics strategy ppt powerpoint presentation ideas design templates. This is a five stage process. The stages in this process are compare, marketing, business, management, planning.

Slide 1 of 5
This is a marketing management kpi metrics planning ppt powerpoint presentation model graphics. The topics discussed in this diagram are marketing, business, management, planning, strategy This is a completely editable PowerPoint presentation, and is available for immediate download.

Slide 1 of 5
This is a marketing management kpi metrics planning ppt powerpoint presentation slides file formats. This is a four stage process. The stages in this process are compare, marketing, business, management, planning.


Slide 1 of 5
This is a marketing management kpi metrics business ppt powerpoint presentation show shapes. This is a four stage process. The stages in this process are compare, marketing, business, management, planning.
Slide 1 of 5
This is a sales management metrics ppt powerpoint presentation summary icon cpb. This is a three stage process. The stages in this process are sales management metrics.


Slide 1 of 5
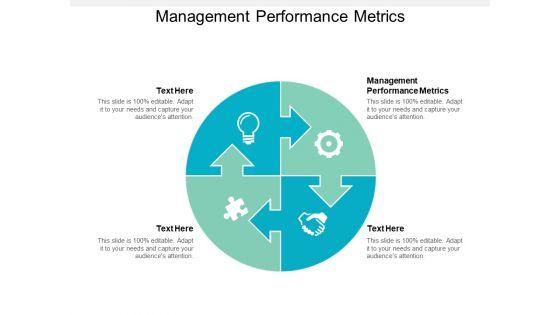
This is a management performance metrics ppt powerpoint presentation inspiration display cpb. This is a four stage process. The stages in this process are management performance metrics.
Slide 1 of 5
This is a file management quality control and reporting metrics ppt powerpoint presentation portfolio icon. This is a five stage process. The stages in this process are document review, document analysis, document evaluation.
Slide 1 of 5
This is a project management metrics and variances schedule variance and test defect ppt powerpoint presentation icon influencers. This is a five stage process. The stages in this process are project dashboard, project kpis, project metrics.


Slide 1 of 5
This is a metrics measure talent management ppt powerpoint presentation slides maker cpb. This is a three stage process. The stages in this process are metrics measure talent management.
Slide 1 of 5
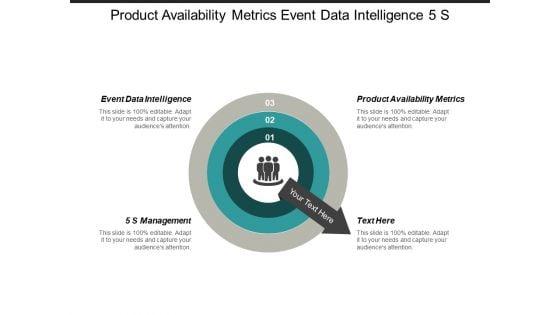
This is a product availability metrics event data intelligence 5 s management ppt powerpoint presentation gallery graphic tips. This is a three stage process. The stages in this process are product availability metrics, event data intelligence, 5 s management.
Slide 1 of 5
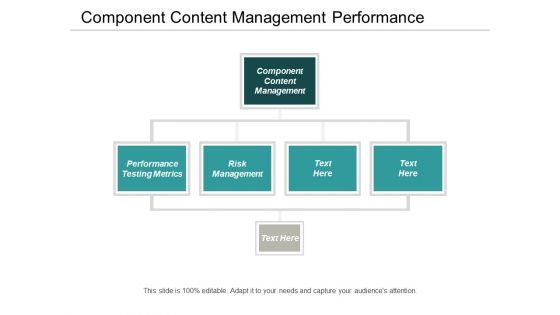
This is a component content management performance testing metrics risk management ppt powerpoint presentation inspiration deck. This is a four stage process. The stages in this process are component content management, performance testing metrics, risk management.
Slide 1 of 5
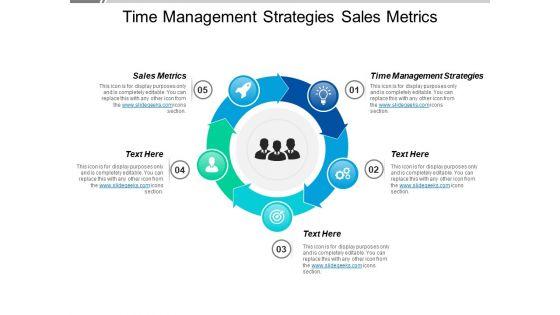
This is a time management strategies sales metrics ppt powerpoint presentation summary designs download. This is a five stage process. The stages in this process are time management strategies, sales metrics.


Slide 1 of 5
This is a product range management metrics ppt powerpoint presentation deck. This is a six stage process. The stages in this process are product range management metrics.


Slide 1 of 5
This is a customer satisfaction metrics inventory management ppt powerpoint presentation summary outfit. This is a five stage process. The stages in this process are customer satisfaction metrics, inventory management.




Slide 1 of 5
This is a supplier relationship management metrics ppt powerpoint presentation styles designs. This is a six stage process. The stages in this process are supplier relationship management metrics.

Slide 1 of 5
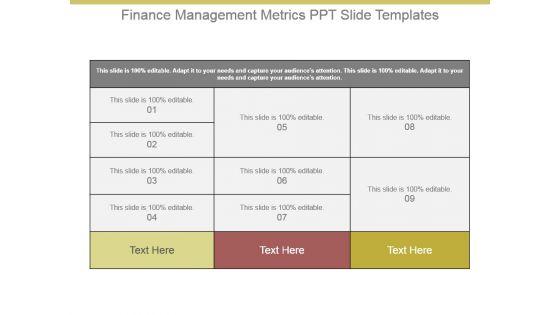
This is a finance management metrics ppt slide templates. This is a nine stage process. The stages in this process are business, marketing, management, table.
Slide 1 of 4
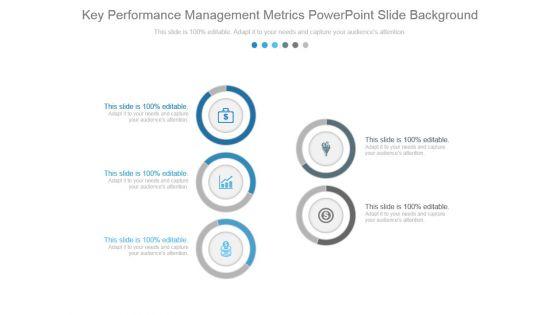
This is a key performance management metrics powerpoint slide background. This is a five stage process. The stages in this process are business, marketing, finance, icons, strategy.

Slide 1 of 4
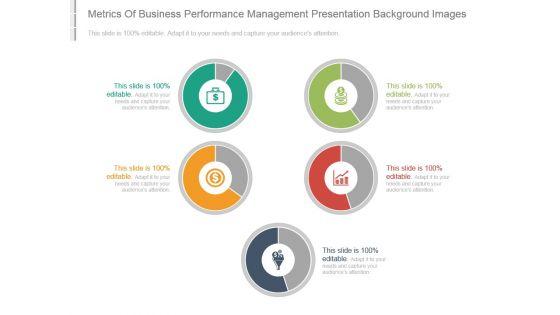
This is a metrics of business performance management presentation background images. This is a five stage process. The stages in this process are performance, management, business, strategy, marketing.
Slide 1 of 3
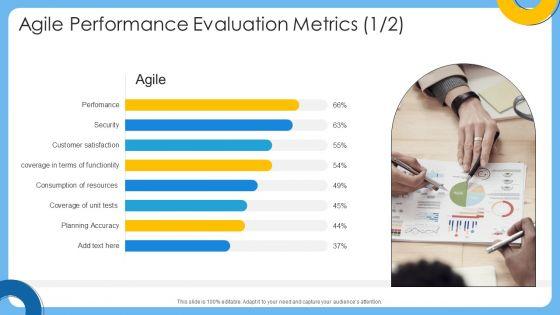
This slide covers the metrics used by the organisation to measure agile capability on the basis of product performance, security level and user satisfaction Present like a pro with Agile Virtual Project Management Agile Performance Evaluation Metrics Icons PDF Create beautiful presentations together with your team, using our easy-to-use presentation slides. Share your ideas in real-time and make changes on the fly by downloading our templates. So whether youre in the office, on the go, or in a remote location, you can stay in sync with your team and present your ideas with confidence. With Slidegeeks presentation got a whole lot easier. Grab these presentations today.
Slide 1 of 3
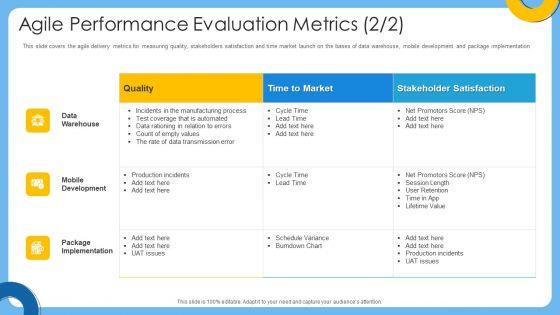
Whether you have daily or monthly meetings, a brilliant presentation is necessary. Agile IT Project Management Agile Performance Evaluation Metrics Ppt Inspiration Infographic Template PDF can be your best option for delivering a presentation. Represent everything in detail using Agile IT Project Management Agile Performance Evaluation Metrics Ppt Inspiration Infographic Template PDF and make yourself stand out in meetings. The template is versatile and follows a structure that will cater to your requirements. All the templates prepared by Slidegeeks are easy to download and edit. Our research experts have taken care of the corporate themes as well. So, give it a try and see the results.


Slide 1 of 3
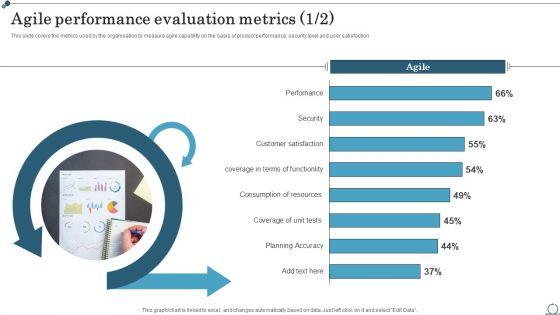
This slide covers the metrics used by the organisation to measure agile capability on the basis of product performance, security level and user satisfaction.Find highly impressive Agile Performance Evaluation Metrics Agile IT Methodology In Project Management Brochure PDF on Slidegeeks to deliver a meaningful presentation. You can save an ample amount of time using these presentation templates. No need to worry to prepare everything from scratch because Slidegeeks experts have already done a huge research and work for you. You need to download Agile Performance Evaluation Metrics Agile IT Methodology In Project Management Brochure PDF for your upcoming presentation. All the presentation templates are 100precent editable and you can change the color and personalize the content accordingly. Download now.

Slide 1 of 2
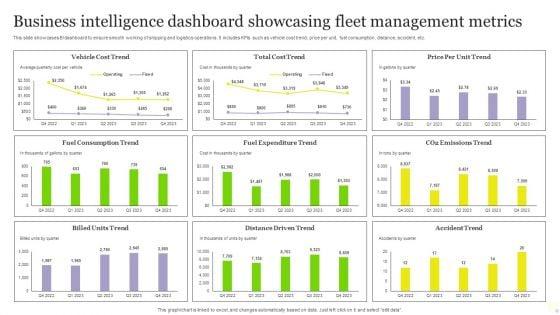
This slide showcases BI dashboard to ensure smooth working of shipping and logistics operations. It includes KPIs such as vehicle cost trend, price per unit, fuel consumption, distance, accident, etc. Showcasing this set of slides titled Business Intelligence Dashboard Showcasing Fleet Management Metrics Elements PDF. The topics addressed in these templates are Cost Trend, Price Per Unit Trend, Vehicle Cost Trend. All the content presented in this PPT design is completely editable. Download it and make adjustments in color, background, font etc. as per your unique business setting.


Slide 1 of 2
This slide represents the key performance indicators to track and monitor the performance of ecommerce website to draw effective strategies to tackle the problems. It includes key metrics for ecommerce website performance measurement such as average order value and shopping cart abandonment rate. Do you know about Slidesgeeks Implementing Management System To Enhance Ecommerce Processes Key Metrics To Measure Current Performance Themes PDF. These are perfect for delivering any kind od presentation. Using it, create PowerPoint presentations that communicate your ideas and engage audiences. Save time and effort by using our pre designed presentation templates that are perfect for a wide range of topic. Our vast selection of designs covers a range of styles, from creative to business, and are all highly customizable and easy to edit. Download as a PowerPoint template or use them as Google Slides themes.

Slide 1 of 2
This slide represents the dashboard showing the key performance measures to analyze and monitor the customer acquisition and conversion rate. It includes details related to KPIs such as direct traffic, sessions by source, social networks, paid keywords etc. Presenting this PowerPoint presentation, titled Implementing Management System To Enhance Ecommerce Processes Customer Acquisition And Conversion Key Metrics Pictures PDF, with topics curated by our researchers after extensive research. This editable presentation is available for immediate download and provides attractive features when used. Download now and captivate your audience. Presenting this Implementing Management System To Enhance Ecommerce Processes Customer Acquisition And Conversion Key Metrics Pictures PDF. Our researchers have carefully researched and created these slides with all aspects taken into consideration. This is a completely customizable Implementing Management System To Enhance Ecommerce Processes Customer Acquisition And Conversion Key Metrics Pictures PDF that is available for immediate downloading. Download now and make an impact on your audience. Highlight the attractive features available with our PPTs.

Slide 1 of 2
This slide represents KPI dashboard to track product performance in the market. It covers various metrics such as customers, vendor, product category, revenue etc. Slidegeeks has constructed Management Plan For Product Life Cycle Metric Dashboard To Track Product Performance Infographics PDF after conducting extensive research and examination. These presentation templates are constantly being generated and modified based on user preferences and critiques from editors. Here, you will find the most attractive templates for a range of purposes while taking into account ratings and remarks from users regarding the content. This is an excellent jumping-off point to explore our content and will give new users an insight into our top-notch PowerPoint Templates.
SHOW
- 60
- 120
- 180
DISPLAYING: 60 of 659 Item(s)
Page
