 AI PPT Maker
 Templates
 PPT Bundles
 Design Services
 Business PPTs
 Business Plan
 Management
 Strategy
 Introduction PPT
 Roadmap
 Self Introduction
 Timelines
 Process
 Marketing
 Agenda
 Technology
 Medical
 Startup Business Plan
 Cyber Security
 Dashboards
 SWOT
SWOT Proposals
 Education
 Pitch Deck
 Digital Marketing
 KPIs
KPIs Project Management
 Product Management
 Artificial Intelligence
 Target Market
 Communication
 Supply Chain
 Google Slides
 Research Services
 One Pagers
 All Categories
Marginal PowerPoint Presentation Templates and Google Slides
SHOW
- 60
- 120
- 180
DISPLAYING: 60 of 417 Item(s)
Page
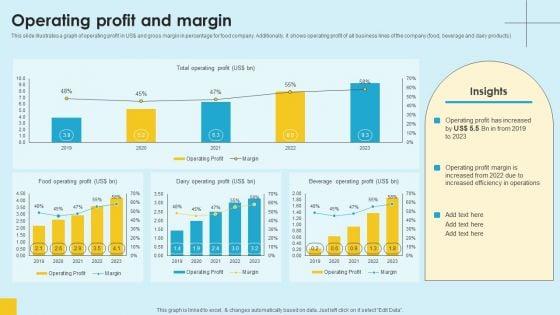

This slide illustrates a graph of operating profit in US dollar and gross margin in percentage for food company. Additionally, it shows operating profit of all business lines of the company food, beverage and dairy products. Find a pre-designed and impeccable Food Company Financial Performance Summary Operating Profit And Margin Topics PDF. The templates can ace your presentation without additional effort. You can download these easy-to-edit presentation templates to make your presentation stand out from others. So, what are you waiting for Download the template from Slidegeeks today and give a unique touch to your presentation.
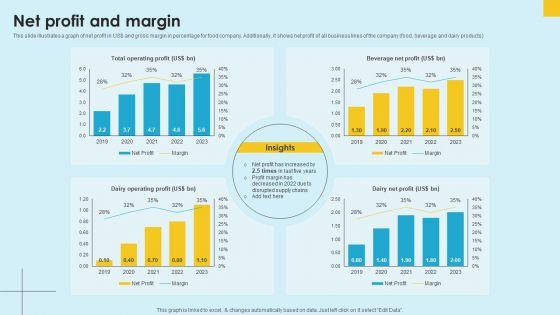

This slide illustrates a graph of net profit in US dollar and gross margin in percentage for food company. Additionally, it shows net profit of all business lines of the company food, beverage and dairy products. Do you know about Slidesgeeks Food Company Financial Performance Summary Net Profit And Margin Professional PDF These are perfect for delivering any kind od presentation. Using it, create PowerPoint presentations that communicate your ideas and engage audiences. Save time and effort by using our pre-designed presentation templates that are perfect for a wide range of topic. Our vast selection of designs covers a range of styles, from creative to business, and are all highly customizable and easy to edit. Download as a PowerPoint template or use them as Google Slides themes.


This slide illustrates a graph of gross profit and gross margin in percentage for food company. Additionally, it shows gross profit of all business lines of the company food, beverage and dairy products. Here you can discover an assortment of the finest PowerPoint and Google Slides templates. With these templates, you can create presentations for a variety of purposes while simultaneously providing your audience with an eye-catching visual experience. Download Food Company Financial Performance Summary Gross Profit And Margin Introduction PDF to deliver an impeccable presentation. These templates will make your job of preparing presentations much quicker, yet still, maintain a high level of quality. Slidegeeks has experienced researchers who prepare these templates and write high-quality content for you. Later on, you can personalize the content by editing the Food Company Financial Performance Summary Gross Profit And Margin Introduction PDF.


Slidegeeks is here to make your presentations a breeze with Industry Report Of Packaged Food Products Part 2 Nomad Foods EBITDA Margin Guidelines PDF With our easy to use and customizable templates, you can focus on delivering your ideas rather than worrying about formatting. With a variety of designs to choose from, you are sure to find one that suits your needs. And with animations and unique photos, illustrations, and fonts, you can make your presentation pop. So whether you are giving a sales pitch or presenting to the board, make sure to check out Slidegeeks first.


This slide shows the financial statement analysis dashboard of organization. It covers various KPIs such as OPEX Ratio, operating profit margin, gross profit margin, net profit margin, etc. Pitch your topic with ease and precision using this Financial Position Evaluation Dashboard With Operating Profit Margin Elements PDF. This layout presents information on Income Statement, Revenue, Operating Profit, Net Profit. It is also available for immediate download and adjustment. So, changes can be made in the color, design, graphics or any other component to create a unique layout.
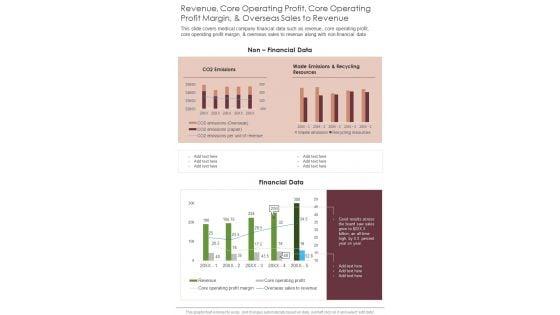
Presenting you an exemplary Revenue Core Operating Profit Core Operating Profit Margin And Overseas Sales To Revenue One Pager Documents. Our one-pager comprises all the must-have essentials of an inclusive document. You can edit it with ease, as its layout is completely editable. With such freedom, you can tweak its design and other elements to your requirements. Download this Revenue Core Operating Profit Core Operating Profit Margin And Overseas Sales To Revenue One Pager Documents brilliant piece now.


Pitch your topic with ease and precision using this Sales Performance Investment Information Pitchbook Dashboard With Profit Margin Guidelines PDF. This layout presents information on Investment Information, Pitchbook Dashboard. It is also available for immediate download and adjustment. So, changes can be made in the color, design, graphics or any other component to create a unique layout.
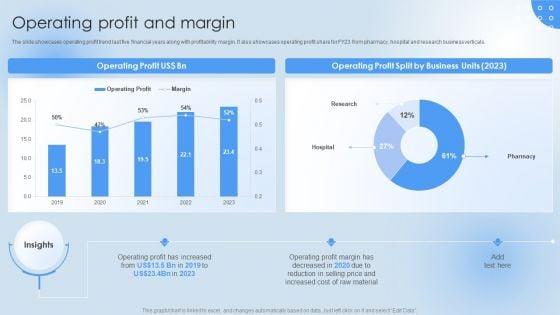

The slide showcases operating profit trend last five financial years along with profitability margin. It also showcases operating profit share for FY23 from pharmacy, hospital and research business verticals. Present like a pro with Pharmaceutical Company Financial Summary Operating Profit And Margin Background PDF Create beautiful presentations together with your team, using our easy-to-use presentation slides. Share your ideas in real-time and make changes on the fly by downloading our templates. So whether youre in the office, on the go, or in a remote location, you can stay in sync with your team and present your ideas with confidence. With Slidegeeks presentation got a whole lot easier. Grab these presentations today.
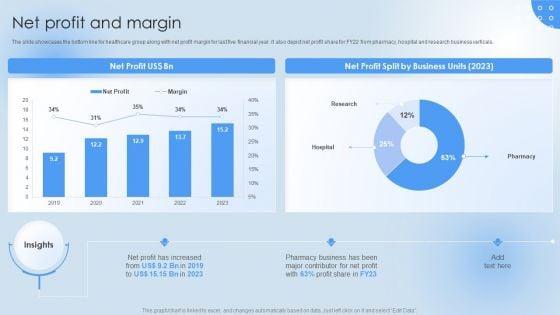

The slide showcases the bottom line for healthcare group along with net profit margin for last five financial year. It also depict net profit share for FY22 from pharmacy, hospital and research business verticals. From laying roadmaps to briefing everything in detail, our templates are perfect for you. You can set the stage with your presentation slides. All you have to do is download these easy-to-edit and customizable templates. Pharmaceutical Company Financial Summary Net Profit And Margin Structure PDF will help you deliver an outstanding performance that everyone would remember and praise you for. Do download this presentation today.
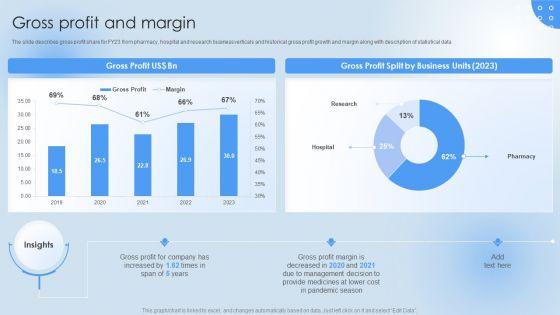

The slide describes gross profit share for FY23 from pharmacy, hospital and research business verticals and historical gross profit growth and margin along with description of statistical data. Are you searching for a Pharmaceutical Company Financial Summary Gross Profit And Margin Summary PDF that is uncluttered, straightforward, and original Its easy to edit, and you can change the colors to suit your personal or business branding. For a presentation that expresses how much effort youve put in, this template is ideal With all of its features, including tables, diagrams, statistics, and lists, its perfect for a business plan presentation. Make your ideas more appealing with these professional slides. Download Pharmaceutical Company Financial Summary Gross Profit And Margin Summary PDF from Slidegeeks today.
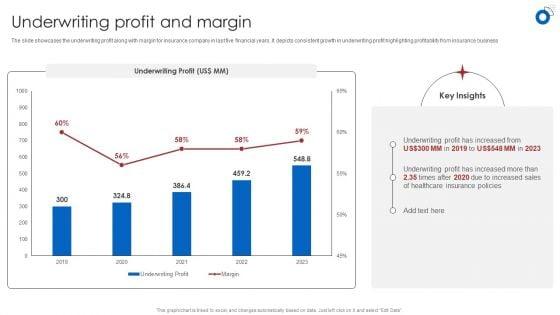

The slide showcases the underwriting profit along with margin for insurance company in last five financial years. It depicts consistent growth in underwriting profit highlighting profitability from insurance business. This Insurance Business Financial Analysis Underwriting Profit And Margin Ppt Portfolio Sample PDF is perfect for any presentation, be it in front of clients or colleagues. It is a versatile and stylish solution for organizing your meetings. The Insurance Business Financial Analysis Underwriting Profit And Margin Ppt Portfolio Sample PDF features a modern design for your presentation meetings. The adjustable and customizable slides provide unlimited possibilities for acing up your presentation. Slidegeeks has done all the homework before launching the product for you. So, dont wait, grab the presentation templates today.
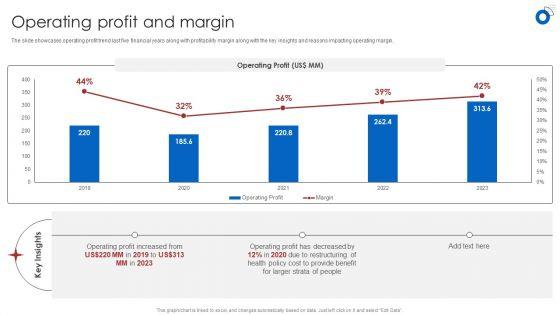

The slide showcases operating profit trend last five financial years along with profitability margin along with the key insights and reasons impacting operating margin. Formulating a presentation can take up a lot of effort and time, so the content and message should always be the primary focus. The visuals of the PowerPoint can enhance the presenters message, so our Insurance Business Financial Analysis Operating Profit And Margin Ppt Styles Structure PDF was created to help save time. Instead of worrying about the design, the presenter can concentrate on the message while our designers work on creating the ideal templates for whatever situation is needed. Slidegeeks has experts for everything from amazing designs to valuable content, we have put everything into Insurance Business Financial Analysis Operating Profit And Margin Ppt Styles Structure PDF.


The slide showcases the bottom line for insurance company along with net profit margin for last five financial year. It also provides insights into the factors affecting company profitability. Make sure to capture your audiences attention in your business displays with our gratis customizable Insurance Business Financial Analysis Net Profit And Margin Ppt Gallery Ideas PDF. These are great for business strategies, office conferences, capital raising or task suggestions. If you desire to acquire more customers for your tech business and ensure they stay satisfied, create your own sales presentation with these plain slides.
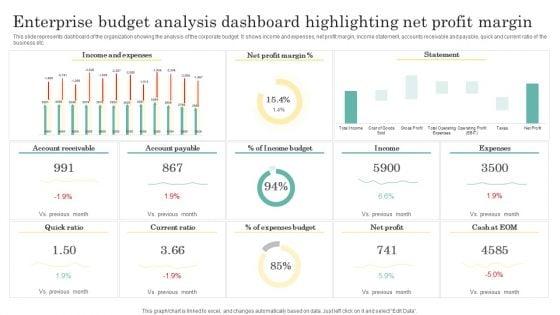

This slide represents dashboard of the organization showing the analysis of the corporate budget. It shows income and expenses, net profit margin, income statement, accounts receivable and payable, quick and current ratio of the business etc. Showcasing this set of slides titled Enterprise Budget Analysis Dashboard Highlighting Net Profit Margin Clipart PDF. The topics addressed in these templates are Income And Expenses, Net Profit Margin, Income Budget. All the content presented in this PPT design is completely editable. Download it and make adjustments in color, background, font etc. as per your unique business setting.
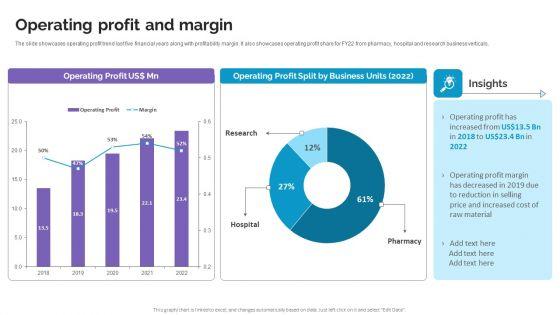

The slide showcases operating profit trend last five financial years along with profitability margin. It also showcases operating profit share for FY22 from pharmacy, hospital and research business verticals. From laying roadmaps to briefing everything in detail, our templates are perfect for you. You can set the stage with your presentation slides. All you have to do is download these easy-to-edit and customizable templates. Operating Profit And Margin Life Science And Healthcare Solutions Company Profile Inspiration PDF will help you deliver an outstanding performance that everyone would remember and praise you for. Do download this presentation today.
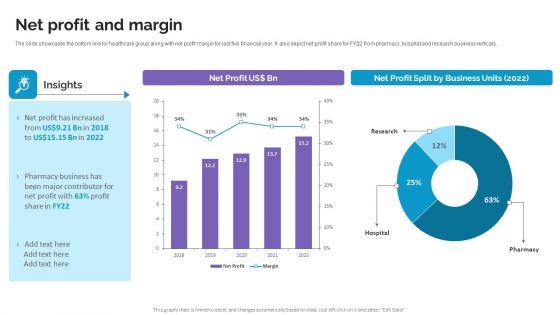
The slide showcases the bottom line for healthcare group along with net profit margin for last five financial year. It also depict net profit share for FY22 from pharmacy, hospital and research business verticals. Get a simple yet stunning designed Net Profit And Margin Life Science And Healthcare Solutions Company Profile Inspiration PDF. It is the best one to establish the tone in your meetings. It is an excellent way to make your presentations highly effective. So, download this PPT today from Slidegeeks and see the positive impacts. Our easy-to-edit Net Profit And Margin Life Science And Healthcare Solutions Company Profile Inspiration PDF can be your go-to option for all upcoming conferences and meetings. So, what are you waiting for Grab this template today.
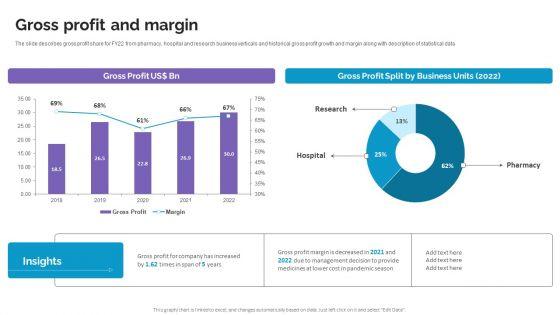

The slide describes gross profit share for FY22 from pharmacy, hospital and research business verticals and historical gross profit growth and margin along with description of statistical data. This Gross Profit And Margin Life Science And Healthcare Solutions Company Profile Slides PDF from Slidegeeks makes it easy to present information on your topic with precision. It provides customization options, so you can make changes to the colors, design, graphics, or any other component to create a unique layout. It is also available for immediate download, so you can begin using it right away. Slidegeeks has done good research to ensure that you have everything you need to make your presentation stand out. Make a name out there for a brilliant performance.
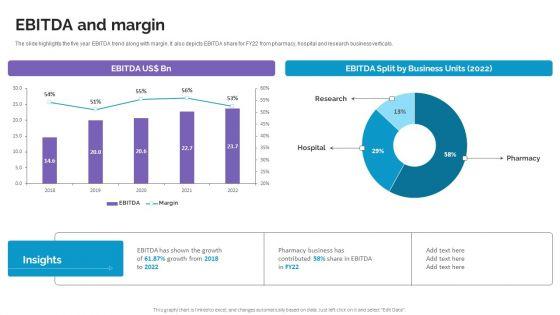

The slide highlights the five year EBITDA trend along with margin. It also depicts EBITDA share for FY22 from pharmacy, hospital and research business verticals. Slidegeeks has constructed Ebitda And Margin Life Science And Healthcare Solutions Company Profile Template PDF after conducting extensive research and examination. These presentation templates are constantly being generated and modified based on user preferences and critiques from editors. Here, you will find the most attractive templates for a range of purposes while taking into account ratings and remarks from users regarding the content. This is an excellent jumping-off point to explore our content and will give new users an insight into our top-notch PowerPoint Templates.
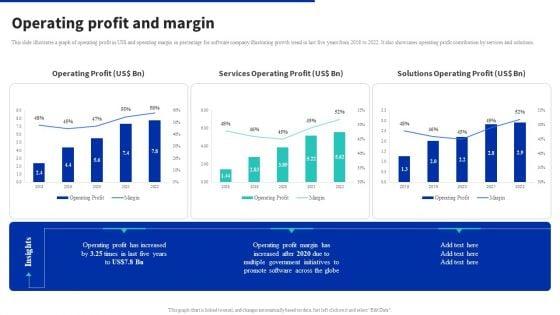

This slide illustrates a graph of operating profit in US dollar and operating margin in percentage for software company illustrating growth trend in last five years from 2018 to 2022. It also showcases operating profit contribution by services and solutions. Present like a pro with Digital Products Company Outline Operating Profit And Margin Structure PDF Create beautiful presentations together with your team, using our easy to use presentation slides. Share your ideas in real time and make changes on the fly by downloading our templates. So whether you are in the office, on the go, or in a remote location, you can stay in sync with your team and present your ideas with confidence. With Slidegeeks presentation got a whole lot easier. Grab these presentations today.


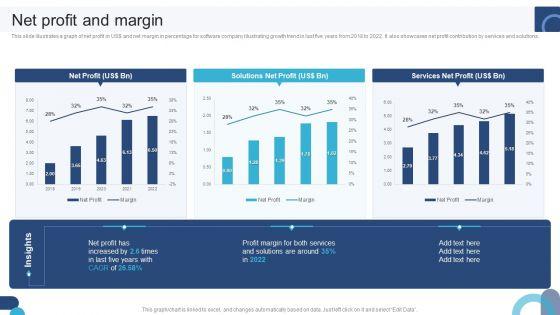
This slide illustrates a graph of net profit in US dollar and net margin in percentage for software company illustrating growth trend in last five years from 2018 to 2022. It also showcases net profit contribution by services and solutions. From laying roadmaps to briefing everything in detail, our templates are perfect for you. You can set the stage with your presentation slides. All you have to do is download these easy to edit and customizable templates. Digital Products Company Outline Net Profit And Margin Summary PDF will help you deliver an outstanding performance that everyone would remember and praise you for. Do download this presentation today.
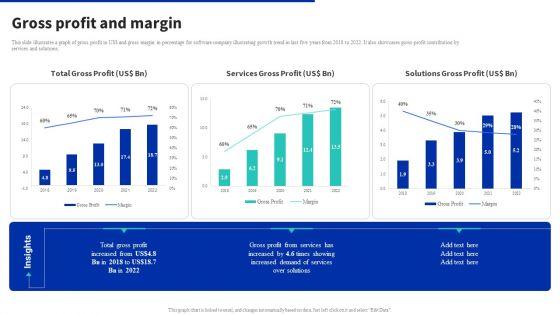

This slide illustrates a graph of gross profit in US dollar and gross margin in percentage for software company illustrating growth trend in last five years from 2018 to 2022. It also showcases gross profit contribution by services and solutions. Get a simple yet stunning designed Digital Products Company Outline Gross Profit And Margin Professional PDF. It is the best one to establish the tone in your meetings. It is an excellent way to make your presentations highly effective. So, download this PPT today from Slidegeeks and see the positive impacts. Our easy to edit Digital Products Company Outline Gross Profit And Margin Professional PDF can be your go to option for all upcoming conferences and meetings. So, what are you waiting for Grab this template today.
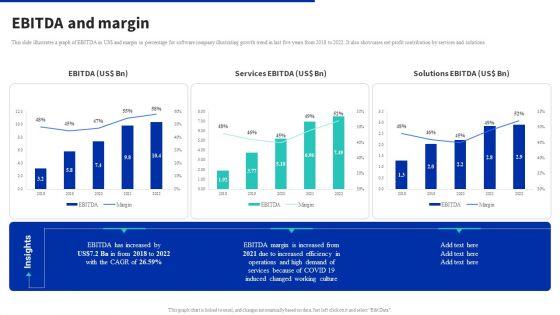

This slide illustrates a graph of EBITDA in US dollar and margin in percentage for software company illustrating growth trend in last five years from 2018 to 2022. It also showcases net profit contribution by services and solutions. Take your projects to the next level with our ultimate collection of Digital Products Company Outline Ebitda And Margin Inspiration PDF. Slidegeeks has designed a range of layouts that are perfect for representing task or activity duration, keeping track of all your deadlines at a glance. Tailor these designs to your exact needs and give them a truly corporate look with your own brand colors they will make your projects stand out from the rest.
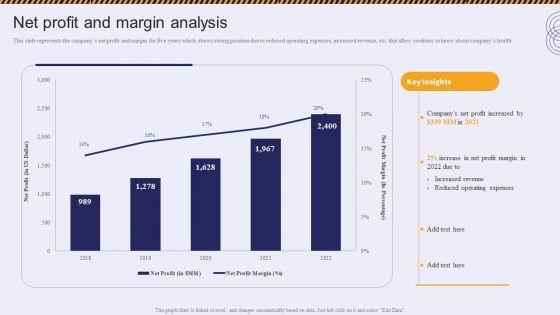

This slide represents the companys net profit and margin for five years which shows strong position due to reduced operating expenses, increased revenue, etc. that allow creditors to know about companys health.Are you searching for a Net Profit And Margin Analysis Residential And Commercial Building Construction Company Profile Elements PDF that is uncluttered, straightforward, and original Its easy to edit, and you can change the colors to suit your personal or business branding. For a presentation that expresses how much effort you ve put in, this template is ideal With all of its features, including tables, diagrams, statistics, and lists, its perfect for a business plan presentation. Make your ideas more appealing with these professional slides. Download Net Profit And Margin Analysis Residential And Commercial Building Construction Company Profile Elements PDF from Slidegeeks today.
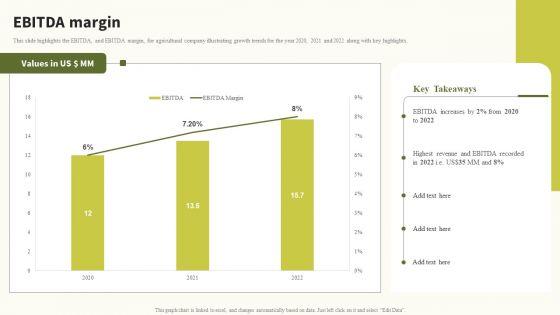

This slide highlights the EBITDA, and EBITDA margin, for agricultural company illustrating growth trends for the year 2020, 2021 and 2022 along with key highlights.Presenting this PowerPoint presentation, titled Ebitda Margin Global Food Products Company Profile Slides PDF, with topics curated by our researchers after extensive research. This editable presentation is available for immediate download and provides attractive features when used. Download now and captivate your audience. Presenting this Ebitda Margin Global Food Products Company Profile Slides PDF. Our researchers have carefully researched and created these slides with all aspects taken into consideration. This is a completely customizable Ebitda Margin Global Food Products Company Profile Slides PDF that is available for immediate downloading. Download now and make an impact on your audience. Highlight the attractive features available with our PPTs.
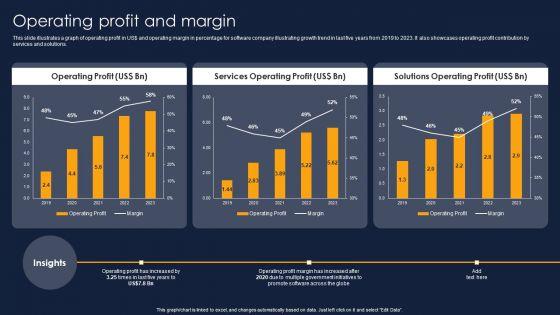

This slide illustrates a graph of operating profit in US doller and operating margin in percentage for software company illustrating growth trend in last five years from 2019 to 2023. It also showcases operating profit contribution by services and solutions. Slidegeeks is here to make your presentations a breeze with Operating Profit And Margin Financial Performance Report Of Software Firm Themes PDF With our easy-to-use and customizable templates, you can focus on delivering your ideas rather than worrying about formatting. With a variety of designs to choose from, you are sure to find one that suits your needs. And with animations and unique photos, illustrations, and fonts, you can make your presentation pop. So whether you are giving a sales pitch or presenting to the board, make sure to check out Slidegeeks first.

This slide illustrates a graph of net profit in US doller and net margin in percentage for software company illustrating growth trend in last five years from 2019 to 2023. It also showcases net profit contribution by services and solutions. Present like a pro with Net Profit And Margin Financial Performance Report Of Software Firm Demonstration PDF Create beautiful presentations together with your team, using our easy-to-use presentation slides. Share your ideas in real-time and make changes on the fly by downloading our templates. So whether you are in the office, on the go, or in a remote location, you can stay in sync with your team and present your ideas with confidence. With Slidegeeks presentation got a whole lot easier. Grab these presentations today.


This slide illustrates a graph of gross profit in US doller and gross margin in percentage for software company illustrating growth trend in last five years from 2019 to 2023. It also showcases gross profit contribution by services and solutions. From laying roadmaps to briefing everything in detail, our templates are perfect for you. You can set the stage with your presentation slides. All you have to do is download these easy-to-edit and customizable templates. Gross Profit And Margin Financial Performance Report Of Software Firm Background PDF will help you deliver an outstanding performance that everyone would remember and praise you for. Do download this presentation today.


This slide illustrates a graph of EBITDA in US doller and margin in percentage for software company illustrating growth trend in last five years from 2019 to 2023. It also showcases net profit contribution by services and solutions. Get a simple yet stunning designed Ebitda And Margin Financial Performance Report Of Software Firm Pictures PDF. It is the best one to establish the tone in your meetings. It is an excellent way to make your presentations highly effective. So, download this PPT today from Slidegeeks and see the positive impacts. Our easy-to-edit Ebitda And Margin Financial Performance Report Of Software Firm Pictures PDF can be your go-to option for all upcoming conferences and meetings. So, what are you waiting for Grab this template today.
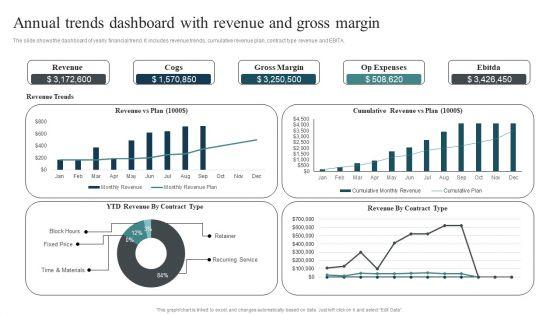

The slide shows the dashboard of yearly financial trend. It includes revenue trends, cumulative revenue plan, contract type revenue and EBITA. Showcasing this set of slides titled Annual Trends Dashboard With Revenue And Gross Margin Designs PDF. The topics addressed in these templates are Cumulative Revenue, Time Materials, Recurring Service. All the content presented in this PPT design is completely editable. Download it and make adjustments in color, background, font etc. as per your unique business setting.
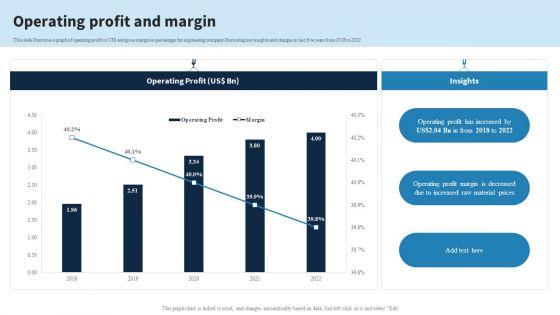
This slide illustrates a graph of operating profit in US dollar and gross margin in percentage for engineering company illustrating key insights and changes in last five years from 2018 to 2022. Do you have an important presentation coming up Are you looking for something that will make your presentation stand out from the rest Look no further than Engineering Services Company Report Operating Profit And Margin Ppt PowerPoint Presentation Gallery Show PDF. With our professional designs, you can trust that your presentation will pop and make delivering it a smooth process. And with Slidegeeks, you can trust that your presentation will be unique and memorable. So why wait Grab Engineering Services Company Report Operating Profit And Margin Ppt PowerPoint Presentation Gallery Show PDF today and make your presentation stand out from the rest.


This slide illustrates a graph of gross profit in US dollar and gross margin in percentage for engineering company illustrating growth trend in last five years from 2018 to 2022. From laying roadmaps to briefing everything in detail, our templates are perfect for you. You can set the stage with your presentation slides. All you have to do is download these easy-to-edit and customizable templates. Engineering Services Company Report Gross Profit And Margin Ppt PowerPoint Presentation File Show PDF will help you deliver an outstanding performance that everyone would remember and praise you for. Do download this presentation today.
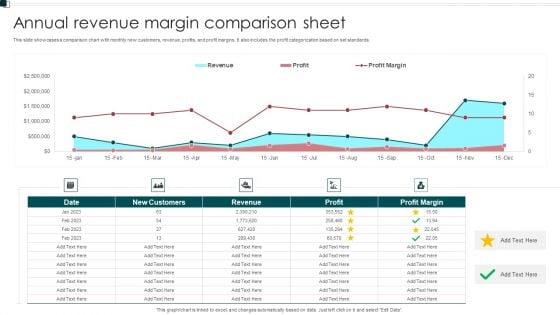
This slide showcases a comparison chart with monthly new customers, revenue, profits, and profit margins. It also includes the profit categorization based on set standards. Showcasing this set of slides titled Annual Revenue Margin Comparison Sheet Information PDF. The topics addressed in these templates are Customers, Revenue, Profit Margin. All the content presented in this PPT design is completely editable. Download it and make adjustments in color, background, font etc. as per your unique business setting.


The following slide showcases increasing gross profit margin of online store. It provides information about discounts, sales, cost of goods sold COGS, accounting accuracy, inventory visibility, etc. Do you have an important presentation coming up Are you looking for something that will make your presentation stand out from the rest Look no further than How Electronic Commerce Financial Procedure Can Be Enhanced Increasing Gross Profit Margin Of Online Store Guidelines PDF. With our professional designs, you can trust that your presentation will pop and make delivering it a smooth process. And with Slidegeeks, you can trust that your presentation will be unique and memorable. So why wait Grab How Electronic Commerce Financial Procedure Can Be Enhanced Increasing Gross Profit Margin Of Online Store Guidelines PDF today and make your presentation stand out from the rest.
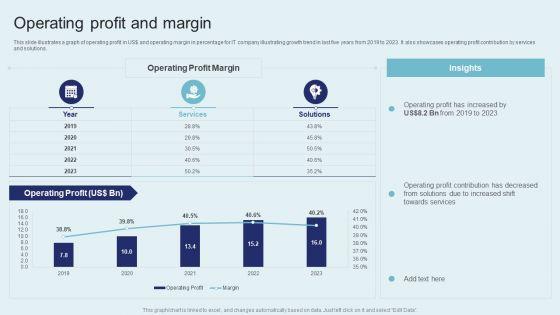

This slide illustrates a graph of operating profit in US dollar and operating margin in percentage for IT company IT Firm Fina growth trend in last five years from 2019 to 2023. It also showcases operating profit contribution by services and solutions. Get a simple yet stunning designed IT Firm Financial Statement Operating Profit And Margin Formats PDF. It is the best one to establish the tone in your meetings. It is an excellent way to make your presentations highly effective. So, download this PPT today from Slidegeeks and see the positive impacts. Our easy to edit IT Firm Financial Statement Operating Profit And Margin Formats PDF can be your go to option for all upcoming conferences and meetings. So, what are you waiting for Grab this template today.
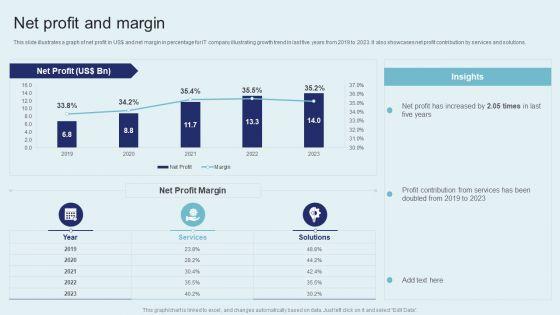

This slide illustrates a graph of net profit in US dollar and net margin in percentage for IT company illustrating growth trend in last five years from 2019 to 2023. It also showcases net profit contribution by services and solutions. Do you have to make sure that everyone on your team knows about any specific topic I yes, then you should give IT Firm Financial Statement Net Profit And Margin Slides PDF a try. Our experts have put a lot of knowledge and effort into creating this impeccable IT Firm Financial Statement Net Profit And Margin Slides PDF. You can use this template for your upcoming presentations, as the slides are perfect to represent even the tiniest detail. You can download these templates from the Slidegeeks website and these are easy to edit. So grab these today.
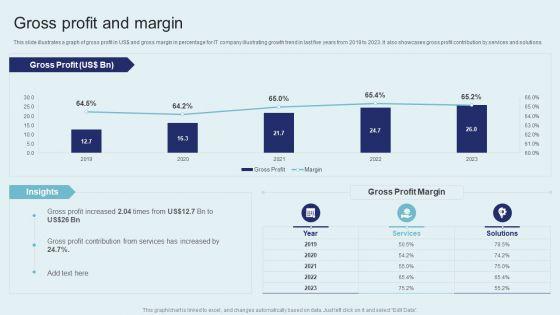

This slide illustrates a graph of gross profit in US dollar and gross margin in percentage for IT company illustrating growth trend in last five years from 2019 to 2023. It also showcases gross profit contribution by services and solutions. Boost your pitch with our creative IT Firm Financial Statement Gross Profit And Margin Summary PDF. Deliver an awe inspiring pitch that will mesmerize everyone. Using these presentation templates you will surely catch everyones attention. You can browse the ppts collection on our website. We have researchers who are experts at creating the right content for the templates. So you do not have to invest time in any additional work. Just grab the template now and use them.
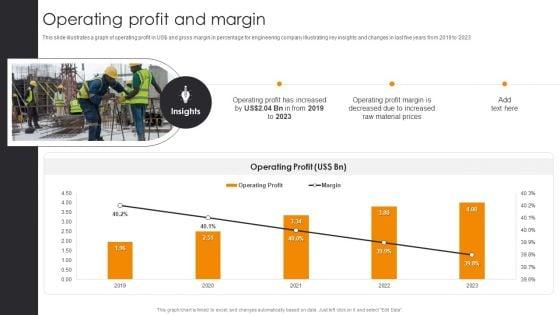

This slide illustrates a graph of operating profit in US dollar and gross margin in percentage for engineering company illustrating key insights and changes in last five years from 2019 to 2023. Here you can discover an assortment of the finest PowerPoint and Google Slides templates. With these templates, you can create presentations for a variety of purposes while simultaneously providing your audience with an eye-catching visual experience. Download Operating Profit And Margin Engineering Company Financial Analysis Report Portrait PDF to deliver an impeccable presentation. These templates will make your job of preparing presentations much quicker, yet still, maintain a high level of quality. Slidegeeks has experienced researchers who prepare these templates and write high-quality content for you. Later on, you can personalize the content by editing the Operating Profit And Margin Engineering Company Financial Analysis Report Portrait PDF.
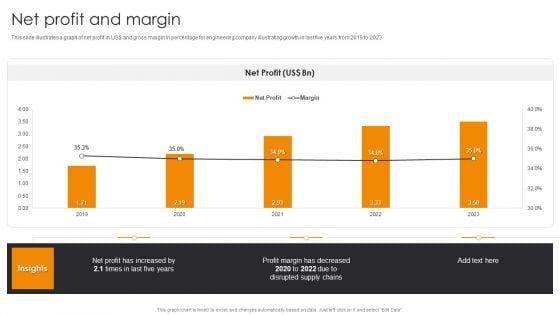

This slide illustrates a graph of net profit in US dollar and gross margin in percentage for engineering company illustrating growth in last five years from 2019 to 2023.Slidegeeks has constructed Net Profit And Margin Engineering Company Financial Analysis Report Background PDF after conducting extensive research and examination. These presentation templates are constantly being generated and modified based on user preferences and critiques from editors. Here, you will find the most attractive templates for a range of purposes while taking into account ratings and remarks from users regarding the content. This is an excellent jumping-off point to explore our content and will give new users an insight into our top-notch PowerPoint Templates.


This slide illustrates a graph of gross profit in US dollar and gross margin in percentage for engineering company illustrating growth trend in last five years from 2019 to 2023. Retrieve professionally designed Gross Profit And Margin Engineering Company Financial Analysis Report Rules PDF to effectively convey your message and captivate your listeners. Save time by selecting pre-made slideshows that are appropriate for various topics, from business to educational purposes. These themes come in many different styles, from creative to corporate, and all of them are easily adjustable and can be edited quickly. Access them as PowerPoint templates or as Google Slides themes. You do not have to go on a hunt for the perfect presentation because Slidegeeks got you covered from everywhere.
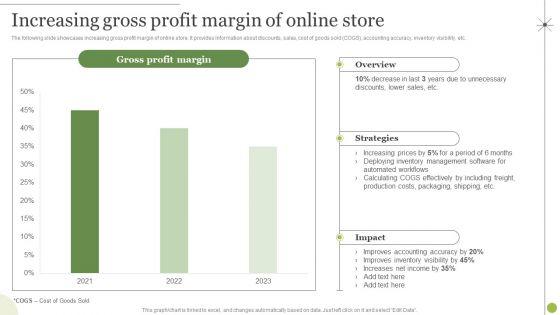

The following slide showcases increasing gross profit margin of online store. It provides information about discounts, sales, cost of goods sold COGS, accounting accuracy, inventory visibility, etc. Are you in need of a template that can accommodate all of your creative concepts This one is crafted professionally and can be altered to fit any style. Use it with Google Slides or PowerPoint. Include striking photographs, symbols, depictions, and other visuals. Fill, move around, or remove text boxes as desired. Test out color palettes and font mixtures. Edit and save your work, or work with colleagues. Download Managing E Commerce Business Accounting Increasing Gross Profit Margin Of Online Store Introduction PDF and observe how to make your presentation outstanding. Give an impeccable presentation to your group and make your presentation unforgettable.

The following slide showcases increasing gross profit margin of online store. It provides information about discounts, sales, cost of goods sold COGS, accounting accuracy, inventory visibility, etc. Formulating a presentation can take up a lot of effort and time, so the content and message should always be the primary focus. The visuals of the PowerPoint can enhance the presenters message, so our Increasing Gross Profit Margin Of Online Store Financial Management Strategies Brochure PDF was created to help save time. Instead of worrying about the design, the presenter can concentrate on the message while our designers work on creating the ideal templates for whatever situation is needed. Slidegeeks has experts for everything from amazing designs to valuable content, we have put everything into Increasing Gross Profit Margin Of Online Store Financial Management Strategies Brochure PDF.
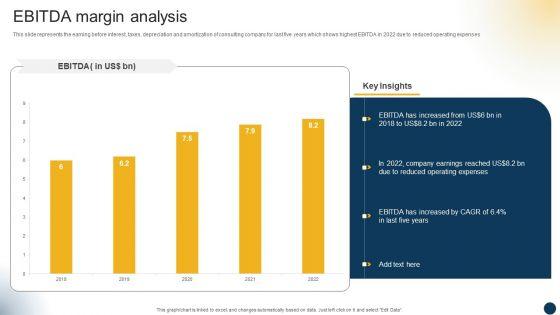

This slide represents the earning before interest, taxes, depreciation and amortization of consulting company for last five years which shows highest EBITDA in 2022 due to reduced operating expenses. Take your projects to the next level with our ultimate collection of Organizational Advisory Solutions Business Profile EBITDA Margin Analysis Inspiration PDF. Slidegeeks has designed a range of layouts that are perfect for representing task or activity duration, keeping track of all your deadlines at a glance. Tailor these designs to your exact needs and give them a truly corporate look with your own brand colors they will make your projects stand out from the rest.


This slide represents the earning before interest, taxes, depreciation and amortization of consulting company for last five years which shows highest EBITDA in 2022 due to reduced operating expenses. Take your projects to the next level with our ultimate collection of Business Strategy Consulting Solutions Company Outline EBITDA Margin Analysis Infographics PDF. Slidegeeks has designed a range of layouts that are perfect for representing task or activity duration, keeping track of all your deadlines at a glance. Tailor these designs to your exact needs and give them a truly corporate look with your own brand colors they will make your projects stand out from the rest.
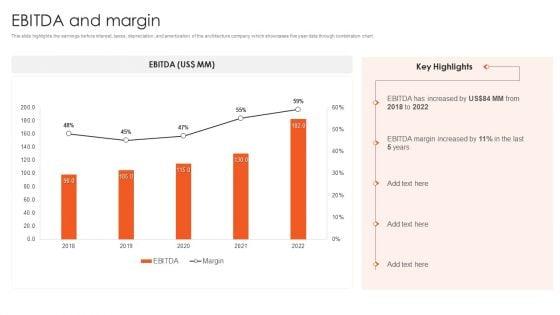

This slide highlights the earnings before interest, taxes, depreciation, and amortization of the architecture company which showcases five year data through combination chart. Explore a selection of the finest International Design And Architecture Firm EBITDA And Margin Introduction PDF here. With a plethora of professionally designed and pre-made slide templates, you can quickly and easily find the right one for your upcoming presentation. You can use our International Design And Architecture Firm EBITDA And Margin Introduction PDF to effectively convey your message to a wider audience. Slidegeeks has done a lot of research before preparing these presentation templates. The content can be personalized and the slides are highly editable. Grab templates today from Slidegeeks.


This slide highlights the EBITDA and margin of security guard and manpower services company which showcases five-year data through combination chart. Whether you have daily or monthly meetings, a brilliant presentation is necessary. Security And Human Resource Services Business Profile EBITDA And Margin Ideas PDF can be your best option for delivering a presentation. Represent everything in detail using Security And Human Resource Services Business Profile EBITDA And Margin Ideas PDF and make yourself stand out in meetings. The template is versatile and follows a structure that will cater to your requirements. All the templates prepared by Slidegeeks are easy to download and edit. Our research experts have taken care of the corporate themes as well. So, give it a try and see the results.


This slide illustrates a graph of operating profit in US dollar and operating margin in percentage for software company illustrating growth trend in last five years from 2018 to 2022. It also showcases operating profit contribution by services and solutions. Explore a selection of the finest Digital Application Software Development Business Profile Operating Profit And Margin Professional PDF here. With a plethora of professionally designed and pre-made slide templates, you can quickly and easily find the right one for your upcoming presentation. You can use our Digital Application Software Development Business Profile Operating Profit And Margin Professional PDF to effectively convey your message to a wider audience. Slidegeeks has done a lot of research before preparing these presentation templates. The content can be personalized and the slides are highly editable. Grab templates today from Slidegeeks.

This slide illustrates a graph of net profit in US dollar and net margin in percentage for software company illustrating growth trend in last five years from 2018 to 2022. It also showcases net profit contribution by services and solutions. Welcome to our selection of the Digital Application Software Development Business Profile Net Profit And Margin Information PDF. These are designed to help you showcase your creativity and bring your sphere to life. Planning and Innovation are essential for any business that is just starting out. This collection contains the designs that you need for your everyday presentations. All of our PowerPoints are 100 percent editable, so you can customize them to suit your needs. This multi-purpose template can be used in various situations. Grab these presentation templates today.


This slide illustrates a graph of gross profit in US dollar and gross margin in percentage for software company illustrating growth trend in last five years from 2018 to 2022. It also showcases gross profit contribution by services and solutions. Formulating a presentation can take up a lot of effort and time, so the content and message should always be the primary focus. The visuals of the PowerPoint can enhance the presenters message, so our Digital Application Software Development Business Profile Gross Profit And Margin Pictures PDF was created to help save time. Instead of worrying about the design, the presenter can concentrate on the message while our designers work on creating the ideal templates for whatever situation is needed. Slidegeeks has experts for everything from amazing designs to valuable content, we have put everything into Digital Application Software Development Business Profile Gross Profit And Margin Pictures PDF.


This slide illustrates a graph of EBITDA in US dollar and margin in percentage for software company illustrating growth trend in last five years from 2018 to 2022. It also showcases net profit contribution by services and solutions. If your project calls for a presentation, then Slidegeeks is your go-to partner because we have professionally designed, easy-to-edit templates that are perfect for any presentation. After downloading, you can easily edit Digital Application Software Development Business Profile EBITDA And Margin Guidelines PDF and make the changes accordingly. You can rearrange slides or fill them with different images. Check out all the handy templates
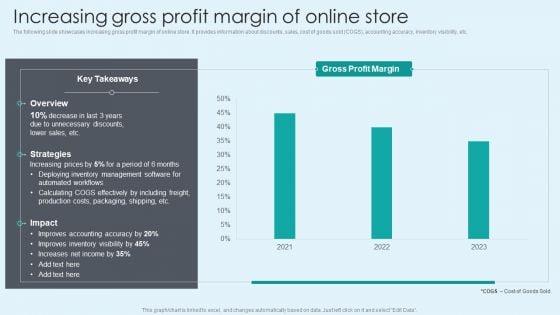

The following slide showcases increasing gross profit margin of online store. It provides information about discounts, sales, cost of goods sold COGS, accounting accuracy, inventory visibility, etc. Do you know about Slidesgeeks Increasing Gross Profit Margin Of Online Store Pictures PDF These are perfect for delivering any kind od presentation. Using it, create PowerPoint presentations that communicate your ideas and engage audiences. Save time and effort by using our pre designed presentation templates that are perfect for a wide range of topic. Our vast selection of designs covers a range of styles, from creative to business, and are all highly customizable and easy to edit. Download as a PowerPoint template or use them as Google Slides themes.
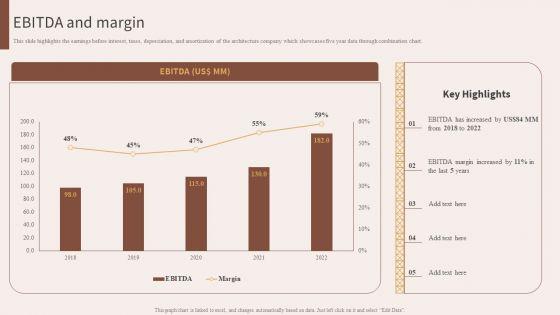

This slide highlights the earnings before interest, taxes, depreciation, and amortization of the architecture company which showcases five year data through combination chart. This Architecture Engineering Planning Services Company EBITDA And Margin Guidelines PDF from Slidegeeks makes it easy to present information on your topic with precision. It provides customization options, so you can make changes to the colors, design, graphics, or any other component to create a unique layout. It is also available for immediate download, so you can begin using it right away. Slidegeeks has done good research to ensure that you have everything you need to make your presentation stand out. Make a name out there for a brilliant performance.


This slide illustrates a graph of operating profit in US doller and operating margin in percentage for IT company illustrating growth trend in last five years from 2018 to 2022. It also showcases operating profit contribution by services and solutions. Deliver and pitch your topic in the best possible manner with this Operating Profit And Margin IT Software Development Company Profile Guidelines PDF. Use them to share invaluable insights on Operating Profit, Operating Profit Margin and impress your audience. This template can be altered and modified as per your expectations. So, grab it now.
This slide illustrates a graph of net profit in US doller and net margin in percentage for IT company illustrating growth trend in last five years from 2018 to 2022. It also showcases net profit contribution by services and solutions. Deliver an awe inspiring pitch with this creative Net Profit And Margin IT Software Development Company Profile Icons PDF bundle. Topics like Net Profit, Net Profit Margin can be discussed with this completely editable template. It is available for immediate download depending on the needs and requirements of the user.


This slide illustrates a graph of gross profit in US doller and gross margin in percentage for IT company illustrating growth trend in last five years from 2018 to 2022. It also showcases gross profit contribution by services and solutions. Deliver and pitch your topic in the best possible manner with this Gross Profit And Margin IT Software Development Company Profile Slides PDF. Use them to share invaluable insights on Gross Profit, Margin and impress your audience. This template can be altered and modified as per your expectations. So, grab it now.
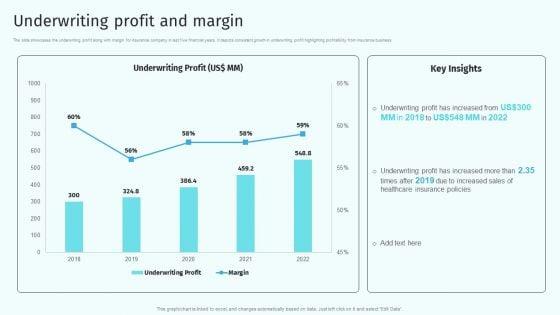
The slide showcases the underwriting profit along with margin for insurance company in last five financial years. It depicts consistent growth in underwriting profit highlighting profitability from insurance business. Deliver an awe inspiring pitch with this creative Underwriting Profit And Margin Health And Property Insurance Company Profile Mockup PDF bundle. Topics like Underwriting Profit, Margin can be discussed with this completely editable template. It is available for immediate download depending on the needs and requirements of the user.
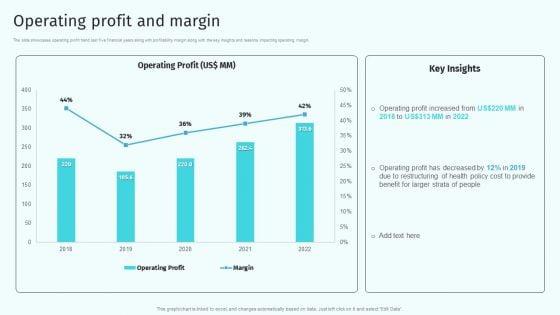
The slide showcases operating profit trend last five financial years along with profitability margin along with the key insights and reasons impacting operating margin. Deliver and pitch your topic in the best possible manner with this Operating Profit And Margin Health And Property Insurance Company Profile Portrait PDF. Use them to share invaluable insights on Operating Profit, Margin and impress your audience. This template can be altered and modified as per your expectations. So, grab it now.
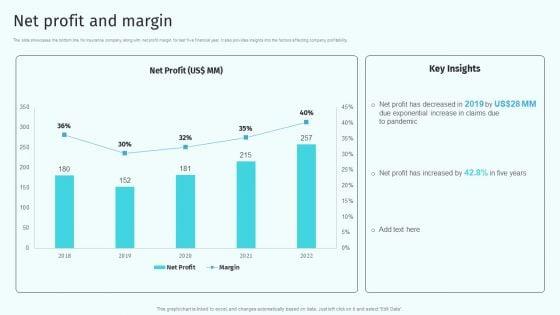

The slide showcases the bottom line for insurance company along with net profit margin for last five financial year. It also provides insights into the factors affecting company profitability. Deliver an awe inspiring pitch with this creative Net Profit And Margin Health And Property Insurance Company Profile Formats PDF bundle. Topics like Net Profit, Margin can be discussed with this completely editable template. It is available for immediate download depending on the needs and requirements of the user.


This slide represents the earning before interest, taxes, depreciation and amortization of consulting company for last five years which shows highest EBITDA in 2022 due to reduced operating expenses. Deliver and pitch your topic in the best possible manner with this Strategic Management Consultancy Business Profile EBITDA Margin Analysis Mockup PDF. Use them to share invaluable insights on Reduced Operating Expenses, EBITDA Margin Analysis and impress your audience. This template can be altered and modified as per your expectations. So, grab it now.


This slide highlights the EBITDA and margin of security guard and manpower services company which showcases five year data through combination chart. Deliver an awe inspiring pitch with this creative Manpower Corporate Security Business Profile Ebitda And Margin Portrait PDF bundle. Topics like EBITDA And Margin can be discussed with this completely editable template. It is available for immediate download depending on the needs and requirements of the user.
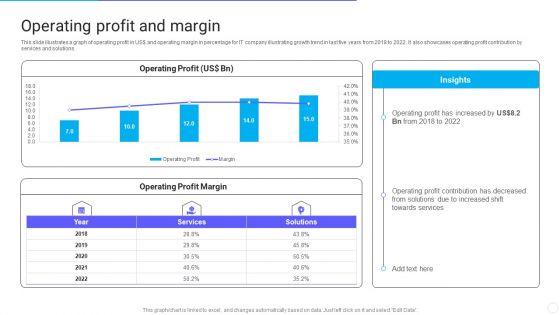
This slide illustrates a graph of operating profit in US dollar and operating margin in percentage for IT company illustrating growth trend in last five years from 2018 to 2022. It also showcases operating profit contribution by services and solutions. Deliver an awe inspiring pitch with this creative IT Application Services Company Outline Operating Profit And Margin Structure PDF bundle. Topics like Operating Profit And Margin can be discussed with this completely editable template. It is available for immediate download depending on the needs and requirements of the user.
SHOW
- 60
- 120
- 180
DISPLAYING: 60 of 417 Item(s)
Page