AI PPT Maker
Templates
PPT Bundles
Design Services
Business PPTs
Business Plan
Management
Strategy
Introduction PPT
Roadmap
Self Introduction
Timelines
Process
Marketing
Agenda
Technology
Medical
Startup Business Plan
Cyber Security
Dashboards
SWOT
Proposals
Education
Pitch Deck
Digital Marketing
KPIs
Project Management
Product Management
Artificial Intelligence
Target Market
Communication
Supply Chain
Google Slides
Research Services
 One Pagers
All Categories
Measure business PowerPoint Presentation Templates and Google Slides
SHOW
- 60
- 120
- 180
DISPLAYING: 60 of 394 Item(s)
Page
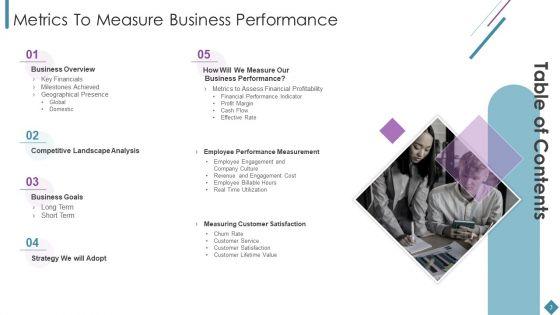

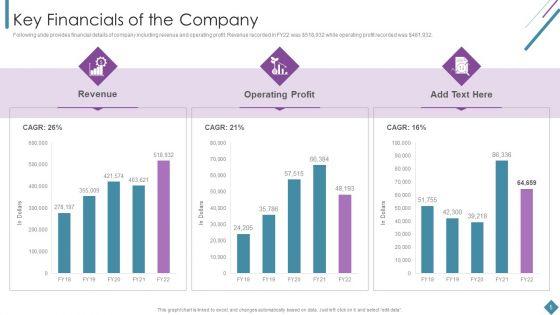
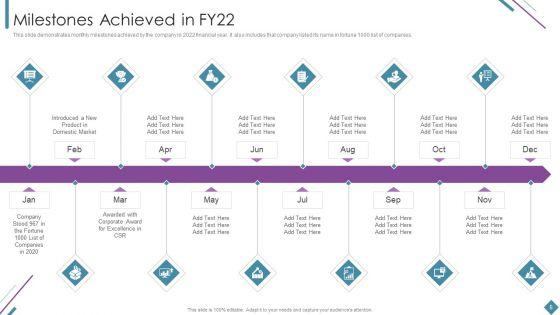

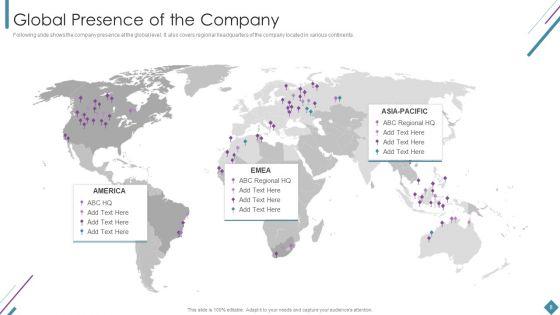
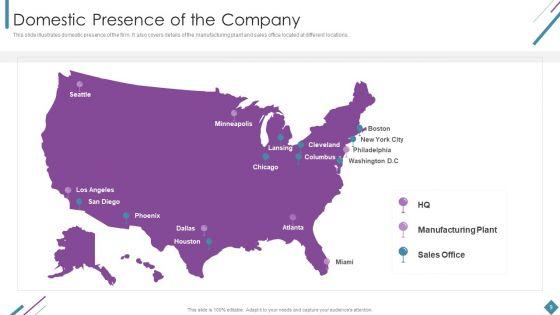

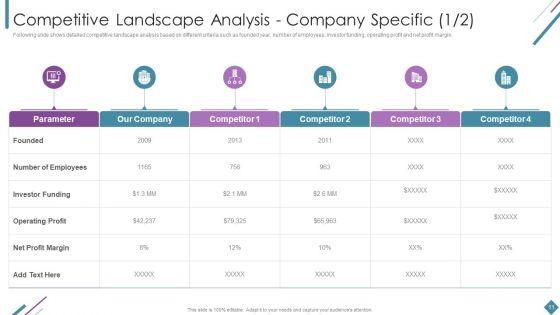

Slide 1 of 43
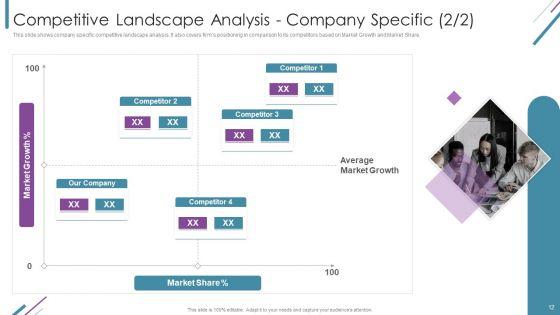
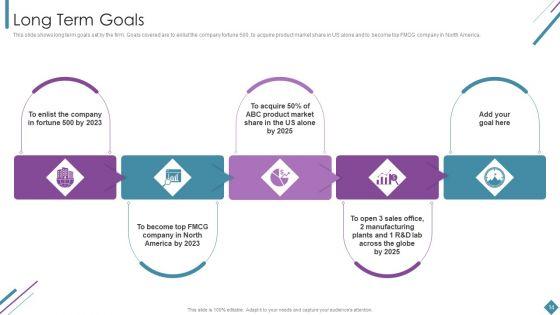
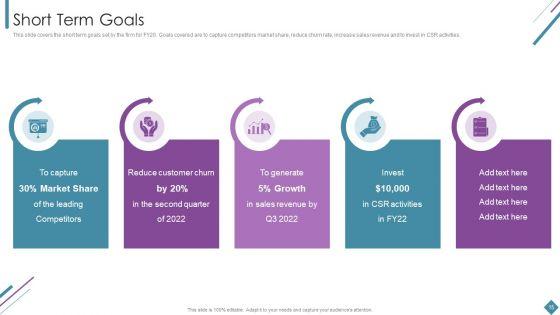
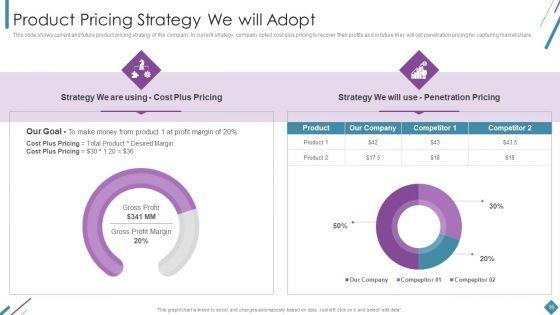
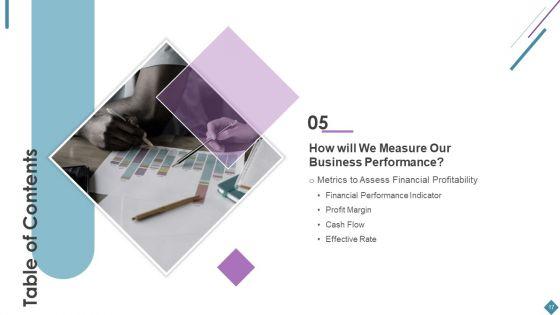
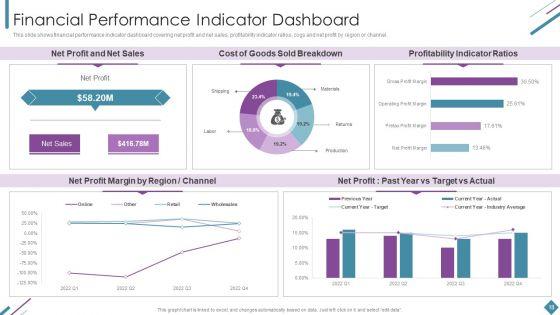
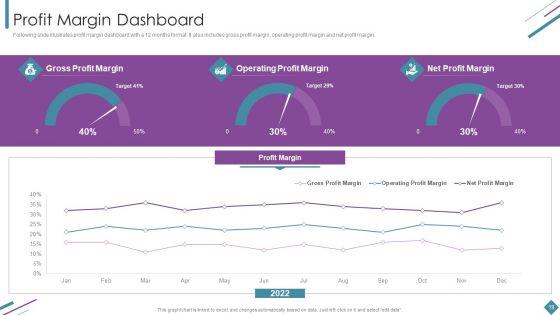
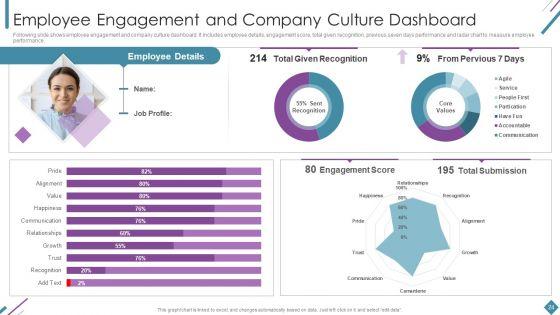
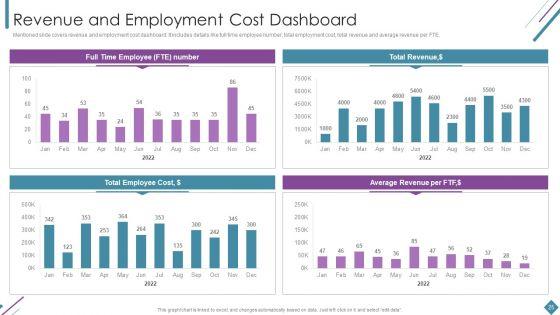
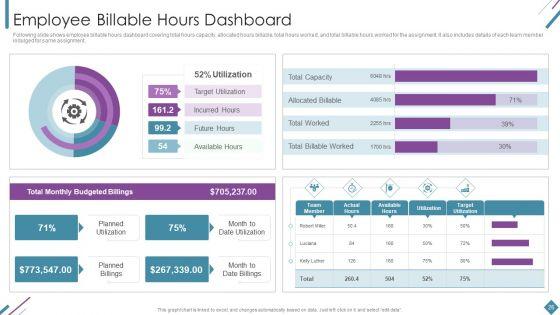
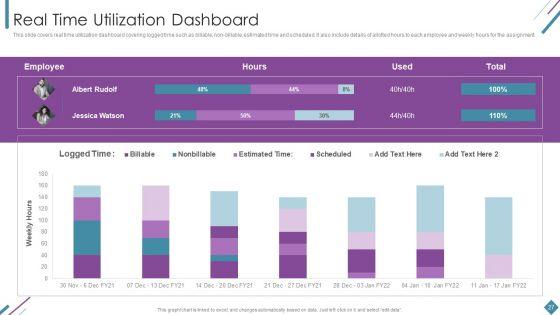
Induce strategic thinking by presenting this complete deck. Enthrall your audience by deploying this thought provoking PPT deck. It can be downloaded in both standard and widescreen aspect ratios, thus making it a complete package to use and deploy. Convey your thoughts and actions using the fourty three slides presented in this complete deck. Additionally, feel free to alter its components like color, graphics, design, etc, to create a great first impression. Grab it now by clicking on the download button below.


Slide 1 of 21
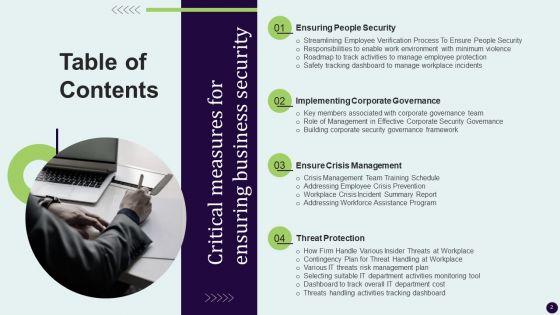
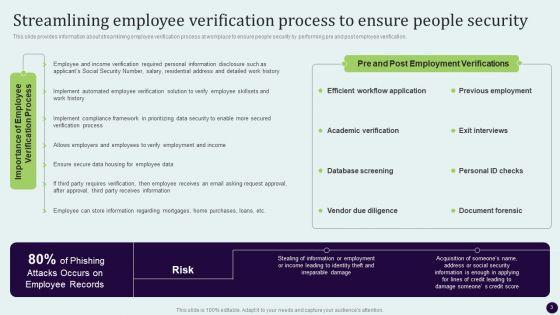
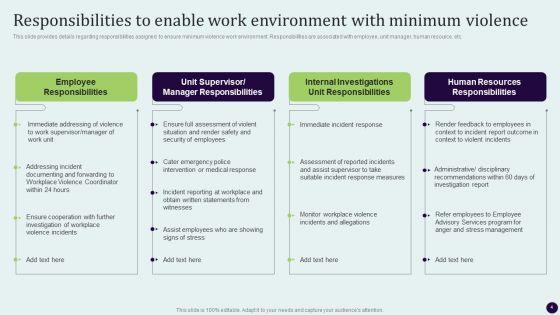
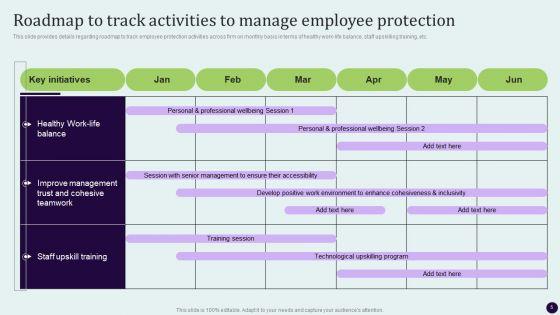
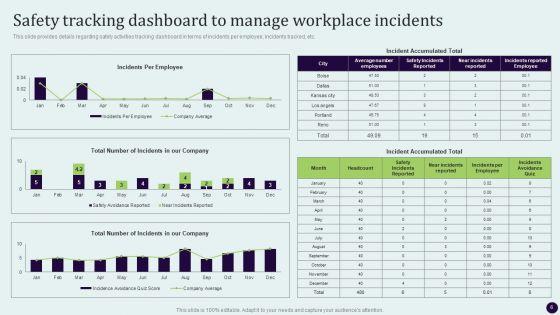
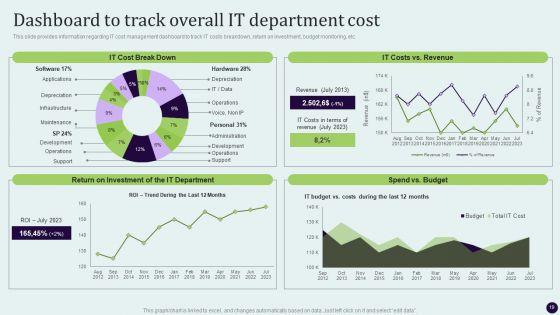
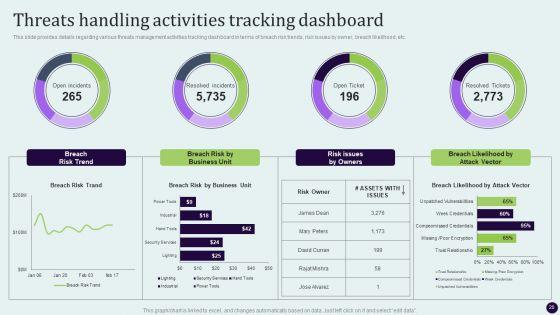
Take advantage of this well-researched and professionally-designed Critical Measures For Ensuring Business Security Ppt PowerPoint Presentation Complete Deck With Slides to ace your next business meeting. Use this PPT complete deck to impress the management with your ideas for business growth and revenue increase. Use the twenty slide Template Bundle to leave no stone unturned as you present each step of your process. Employ the visual tools within the slides such as graphs, charts, and tables to ensure that the audience can never look away from the presentation. With attractive visuals, easy to understand structure, and your knowledge, your presentation will have the attention it deserves. Download this PPT Template from the link below.


Slide 1 of 19
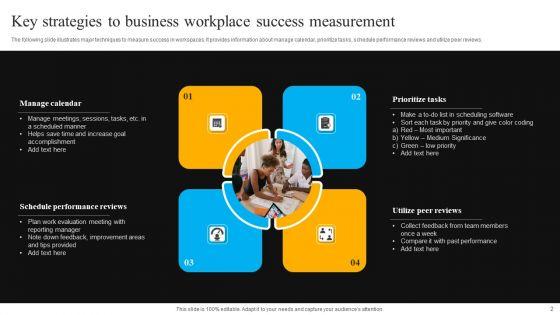
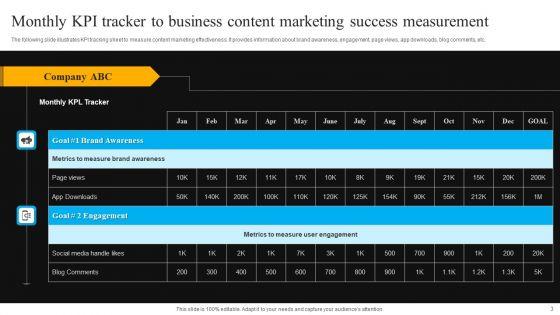
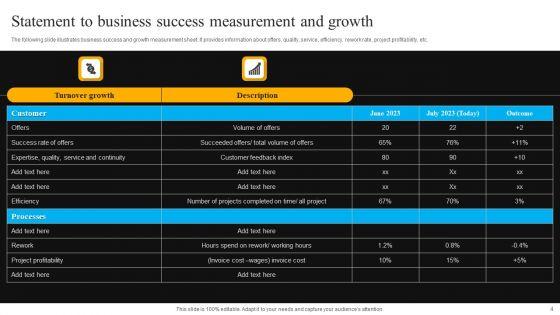
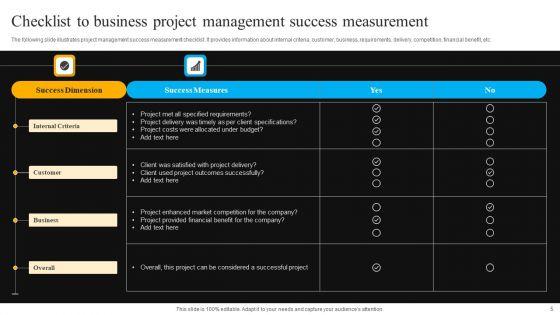
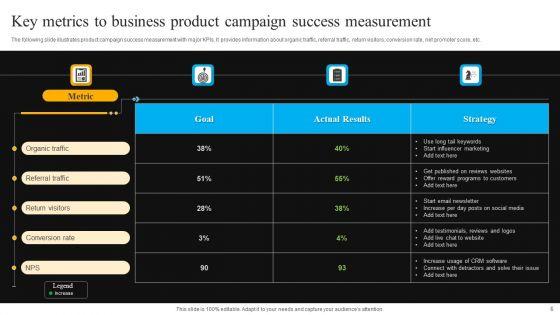
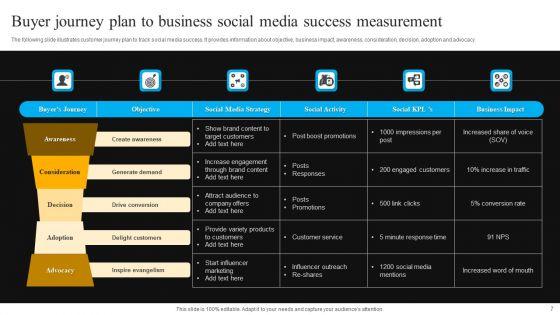
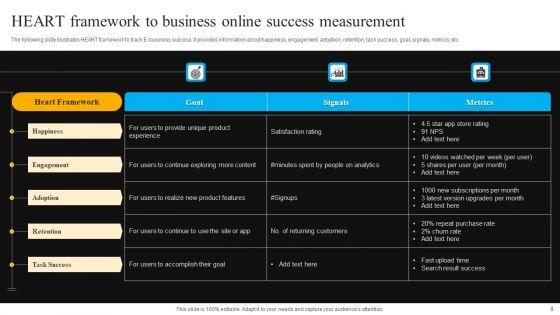
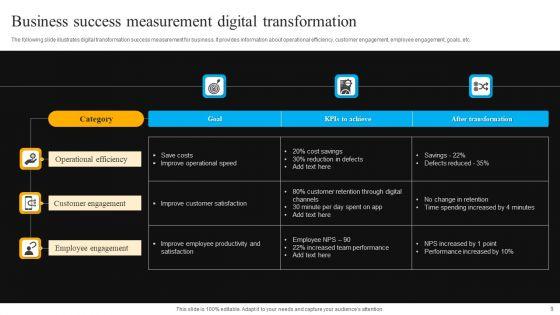
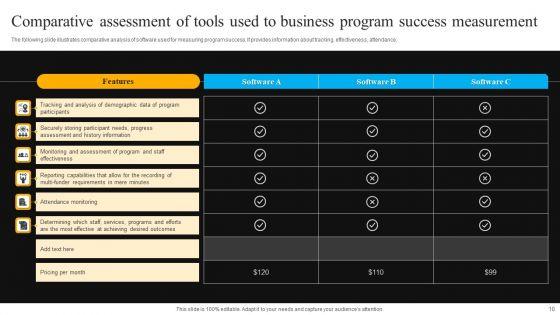
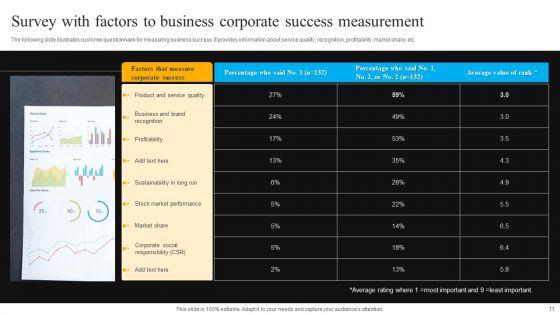
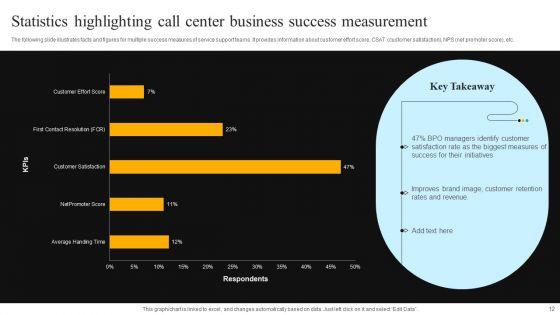
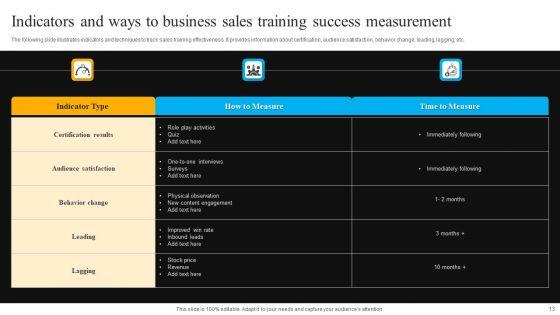
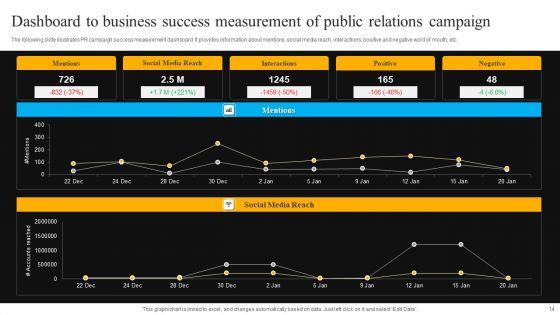
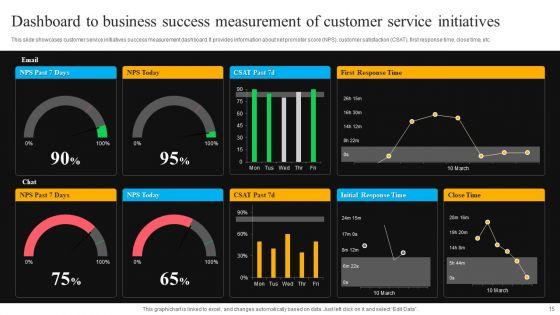
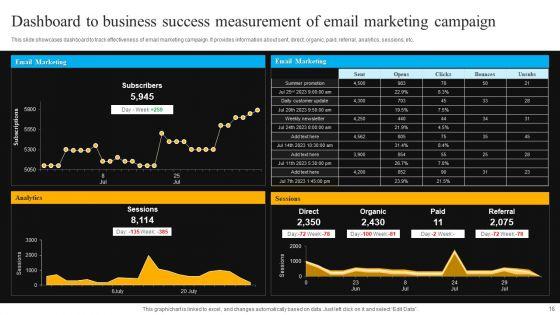
Improve your presentation delivery using this Business Success Measurement Ppt PowerPoint Presentation Complete Deck With Slides. Support your business vision and objectives using this well-structured PPT deck. This template offers a great starting point for delivering beautifully designed presentations on the topic of your choice. Comprising nineteen slides this professionally designed template is all you need to host discussion and meetings with collaborators. Each slide is self-explanatory and equipped with high-quality graphics that can be adjusted to your needs. Therefore, you will face no difficulty in portraying your desired content using this PPT slideshow. This PowerPoint slideshow contains every important element that you need for a great pitch. It is not only editable but also available for immediate download and utilization. The color, font size, background, shapes everything can be modified to create your unique presentation layout. Therefore, download it now.

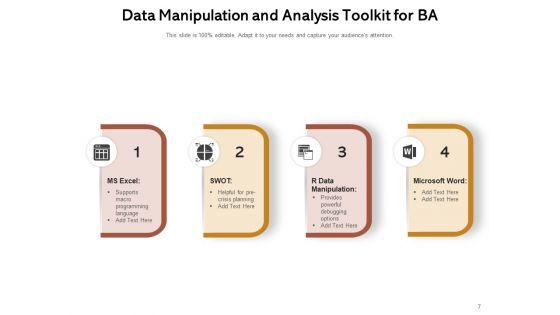
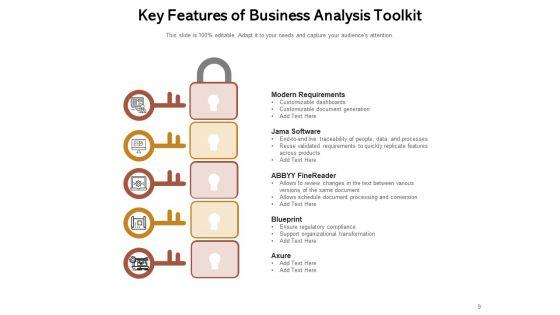
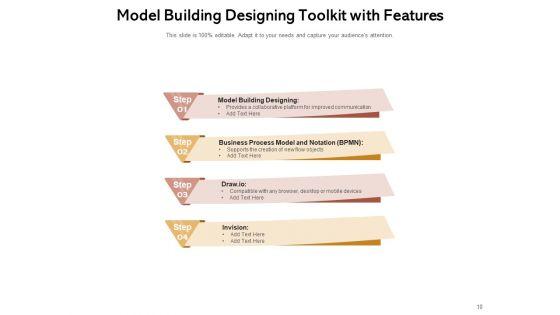

Slide 1 of 13
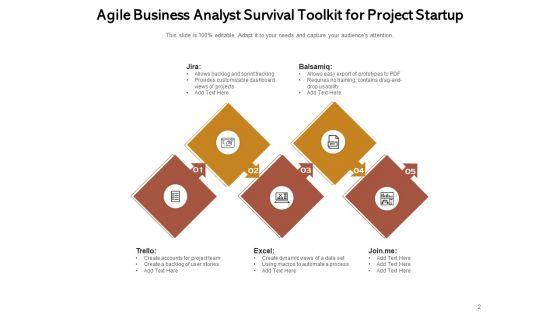
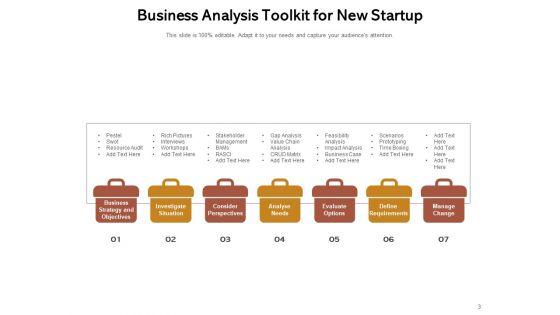
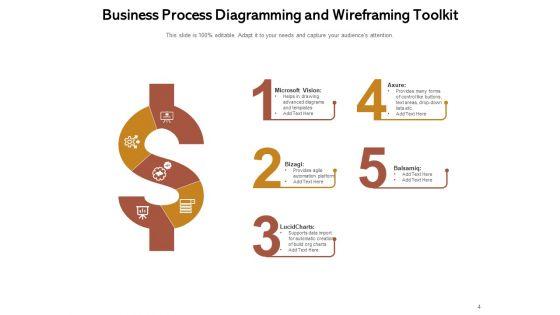
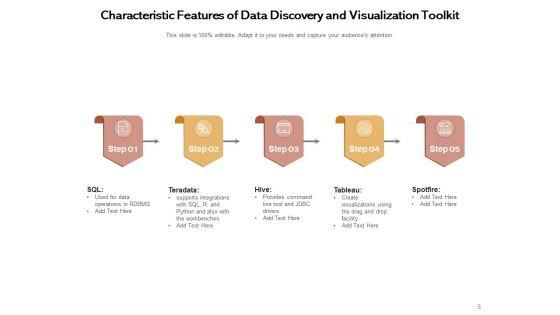
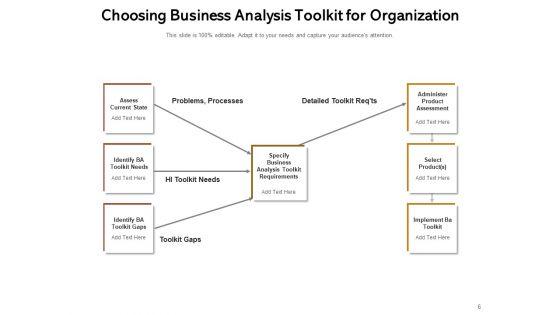
Presenting this set of slides with name measures project startup business analysis requirements ppt powerpoint presentation complete deck. The topics discussed in these slides are project startup, business analysis, requirements, objectives, strategy, organization. This is a completely editable PowerPoint presentation and is available for immediate download. Download now and impress your audience.


Slide 1 of 13
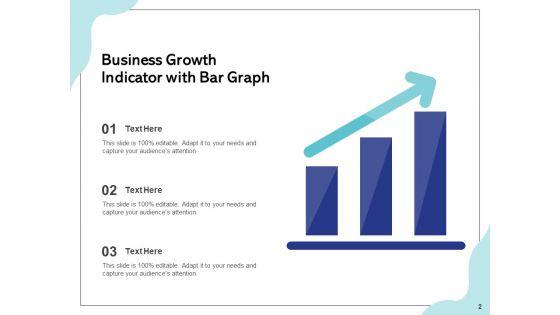
Presenting this set of slides with name measure business performance development ppt powerpoint presentation complete deck. The topics discussed in these slides are business, performance, development, location, arrow. This is a completely editable PowerPoint presentation and is available for immediate download. Download now and impress your audience.


Slide 1 of 12
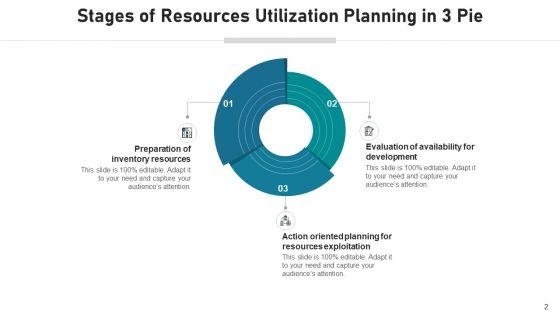
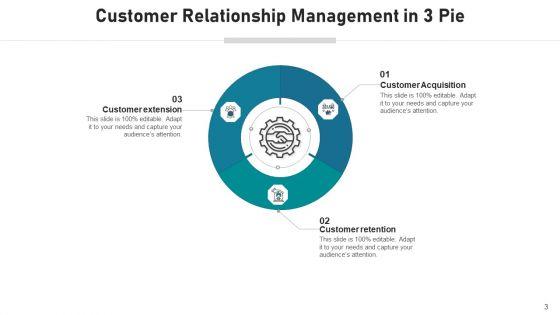
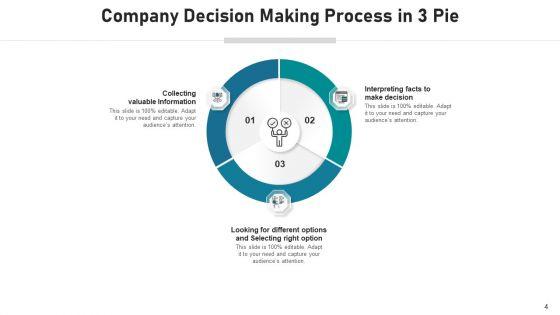
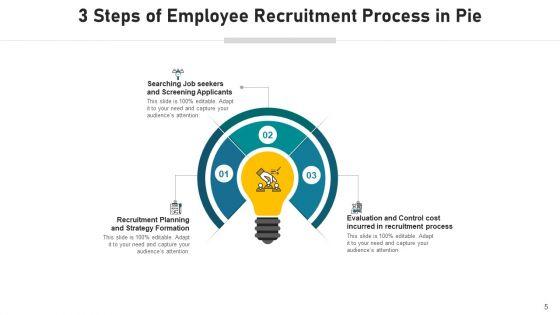
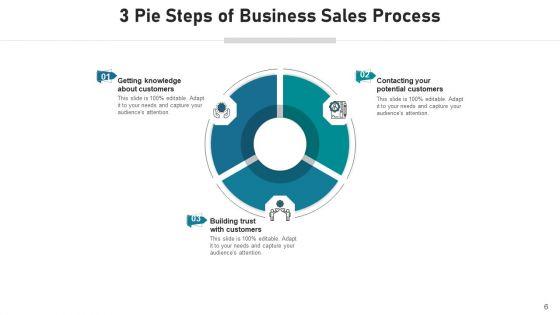
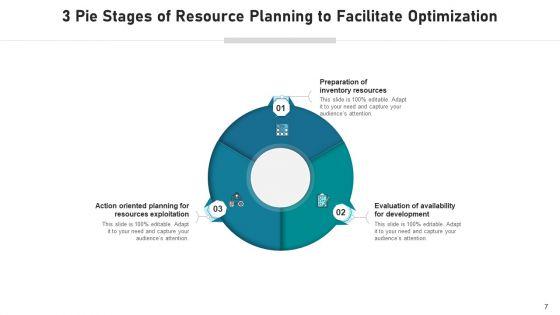
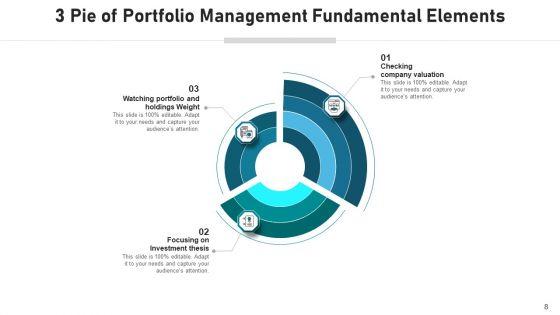
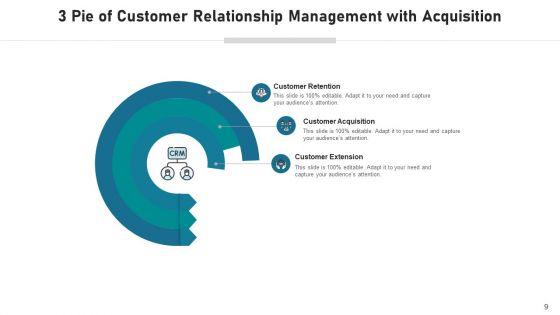
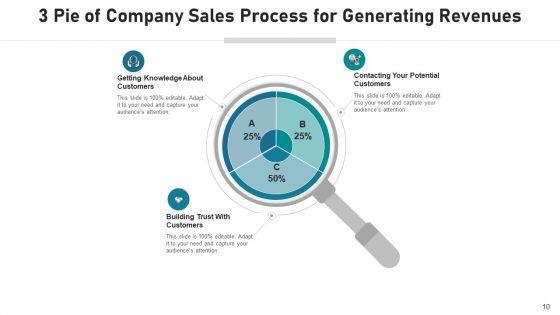
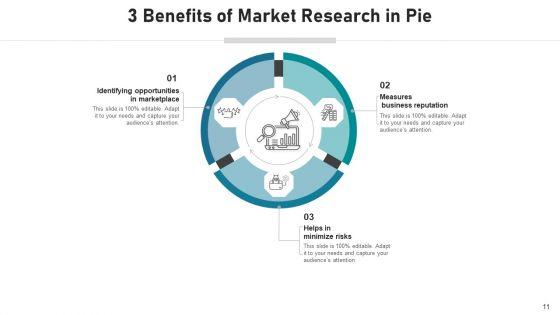
Improve your presentation delivery using this three piece pie chart measures business ppt powerpoint presentation complete deck with slides. Support your business vision and objectives using this well-structured PPT deck. This template offers a great starting point for delivering beautifully designed presentations on the topic of your choice. Comprising twelve this professionally designed template is all you need to host discussion and meetings with collaborators. Each slide is self-explanatory and equipped with high-quality graphics that can be adjusted to your needs. Therefore, you will face no difficulty in portraying your desired content using this PPT slideshow. This PowerPoint slideshow contains every important element that you need for a great pitch. It is not only editable but also available for immediate download and utilization. The color, font size, background, shapes everything can be modified to create your unique presentation layout. Therefore, download it now.


Slide 1 of 12
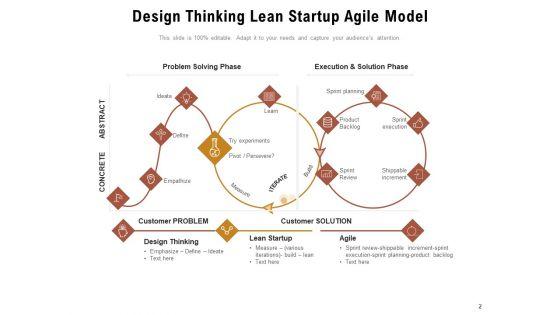
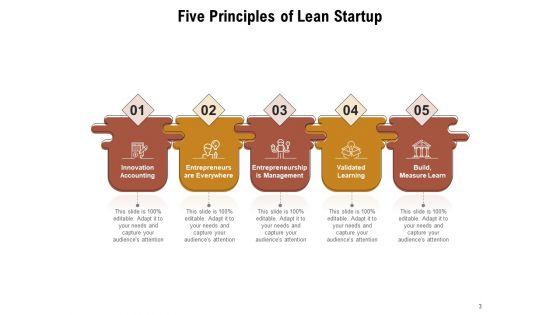
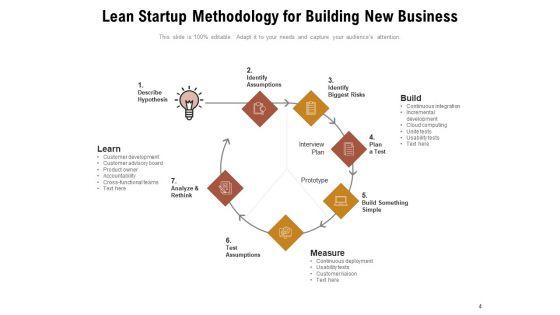
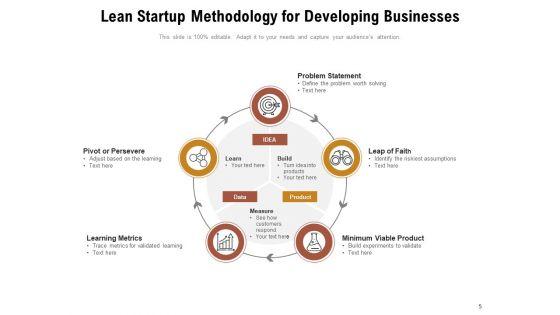
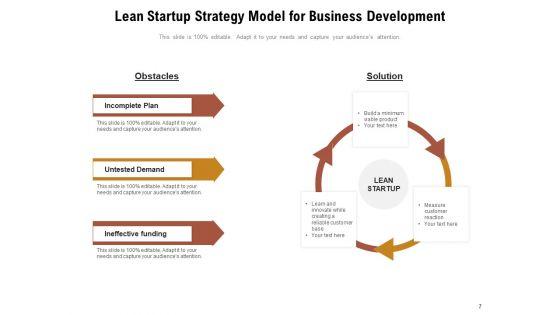
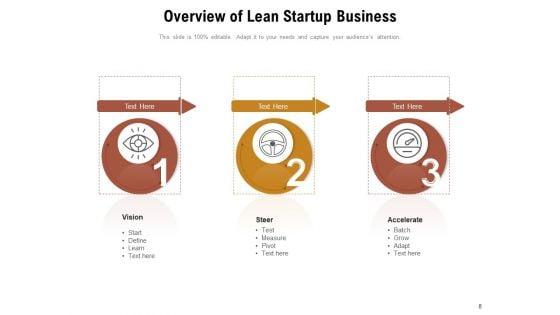
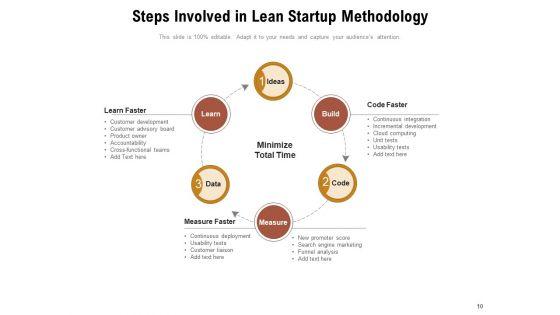
Developing Business Products Measure Innovation Accounting Ppt PowerPoint Presentation Complete Deck
Presenting this set of slides with name developing business products measure innovation accounting ppt powerpoint presentation complete deck. The topics discussed in these slides are measure, innovation, accounting, build, management, innovation. This is a completely editable PowerPoint presentation and is available for immediate download. Download now and impress your audience.


Slide 1 of 7
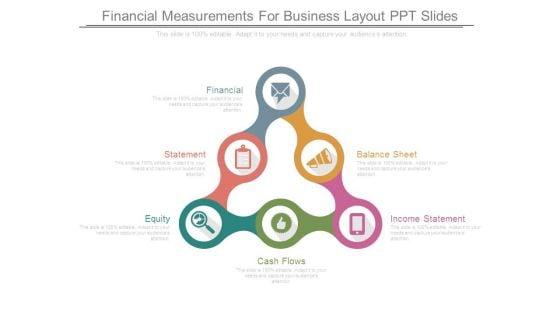
This is a financial measurements for business layout ppt slides. This is a six stage process. The stages in this process are financial, statement, equity, cash flows, balance sheet, income statement.
Slide 1 of 7
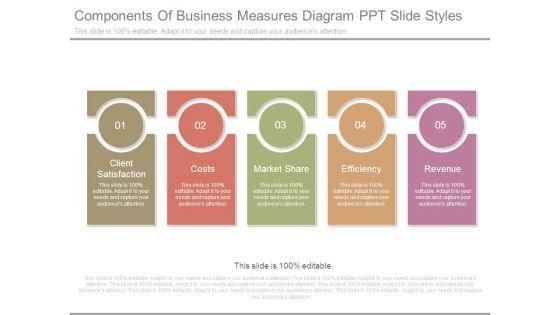
This is a components of business measures diagram ppt slide styles. This is a five stage process. The stages in this process are client satisfaction, costs, market share, efficiency, revenue.


Slide 1 of 7
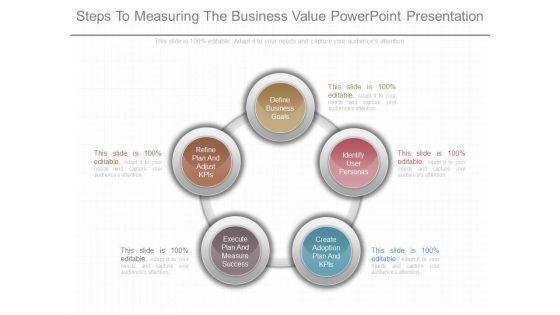
This is a steps to measuring the business value powerpoint presentation. This is a five stage process. The stages in this process are define business goals, identify user personas, create adoption plan and kpis, execute plan and measure success, refine plan and adjust kpis.


Slide 1 of 6
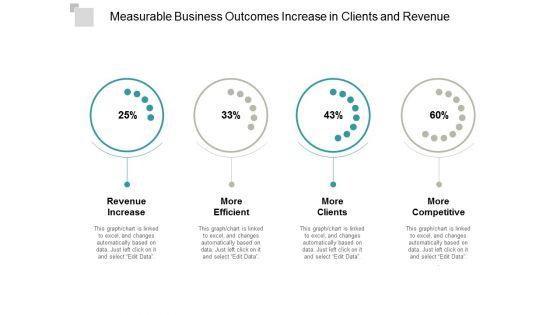
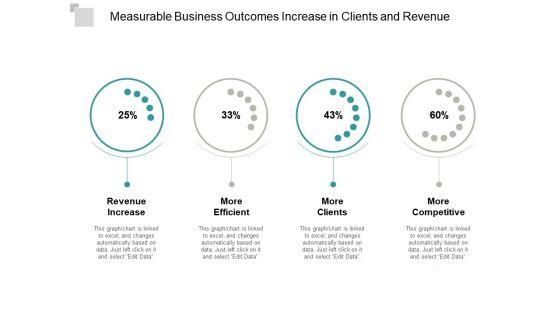
Presenting this set of slides with name measurable business outcomes increase in clients and revenue ppt powerpoint presentation layouts format ideas. The topics discussed in these slides are business outcomes, business results, business output. This is a completely editable PowerPoint presentation and is available for immediate download. Download now and impress your audience.


Slide 1 of 6
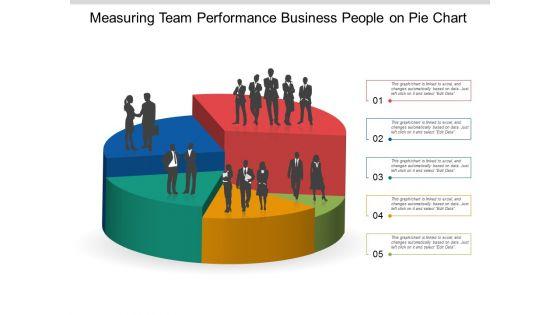
Measuring Team Performance Business People On Pie Chart Ppt Powerpoint Presentation Gallery Smartart
This is a measuring team performance business people on pie chart ppt powerpoint presentation gallery smartart. This is a five stage process. The stages in this process are team performance, member performance, group performance.
Slide 1 of 6
This is a measurable business outcomes increase in clients and revenue ppt powerpoint presentation portfolio ideas. This is a four stage process. The stages in this process are business outcomes, business results, business output.


Slide 1 of 5
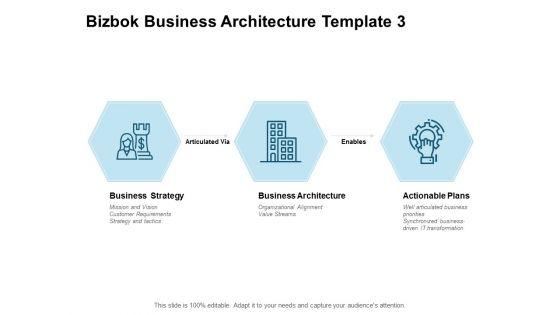
Presenting this set of slides with name bizbok business architecture metrics and measures ppt powerpoint presentation file design templates. This is a three stage process. The stages in this process are business strategy, business architecture, actionable plans, management, marketing. This is a completely editable PowerPoint presentation and is available for immediate download. Download now and impress your audience.
Slide 1 of 5
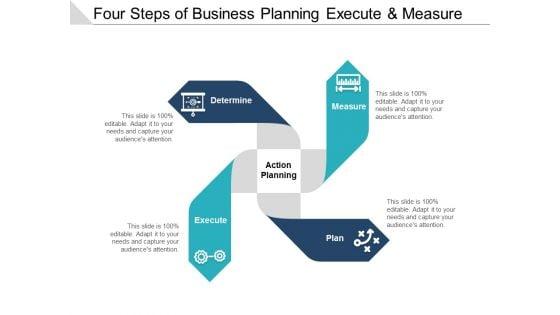
Presenting this set of slides with name four steps of business planning execute and measure ppt powerpoint presentation outline slides. This is a four stage process. The stages in this process are arrow action plan, business planning, project management. This is a completely editable PowerPoint presentation and is available for immediate download. Download now and impress your audience.


Slide 1 of 5
Presenting this set of slides with name five phases business plan deliver measure and adjust ppt powerpoint presentation summary background. This is a five stage process. The stages in this process are arrow action plan, business planning, project management. This is a completely editable PowerPoint presentation and is available for immediate download. Download now and impress your audience.
Slide 1 of 5
This is a business growth arrow with icons define needs and measure performance ppt powerpoint presentation inspiration introduction. This is a four stage process. The stages in this process are increasing arrows, improving arrows, growing arrows.


Slide 1 of 5
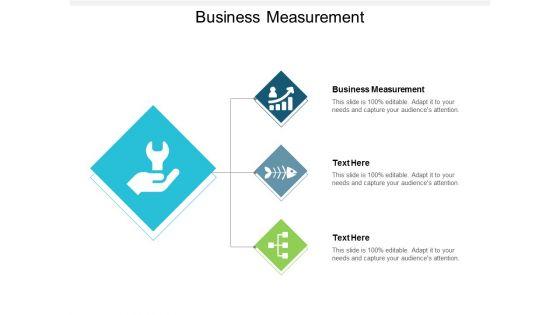
This is a business measurement ppt powerpoint presentation inspiration show cpb. This is a three stage process. The stages in this process are business measurement.



Slide 1 of 5
This is a business performance measures ppt powerpoint presentation styles sample cpb. This is a five stage process. The stages in this process are business performance measures.



Slide 1 of 5
This is a data analytics to measure business growth ppt powerpoint presentation summary example introduction. This is a four stage process. The stages in this process are progress report, growth report, improvement report.
Slide 1 of 5
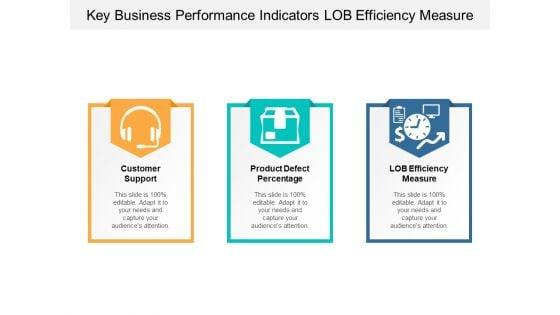
This is a key business performance indicators lob efficiency measure ppt powerpoint presentation infographics file formats. This is a three stage process. The stages in this process are dashboard, kpi, metrics.


Slide 1 of 5
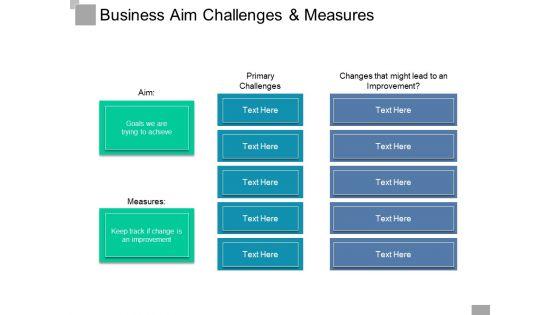
This is a business aim challenges and measures ppt powerpoint presentation infographic template influencers. This is a three stage process. The stages in this process are decision tree, decision point, driver diagram.


Slide 1 of 5
This is a business process measure control and automate ppt powerpoint presentation gallery background image. This is a three stage process. The stages in this process are business growth, people process product, 3ps.


Slide 1 of 5
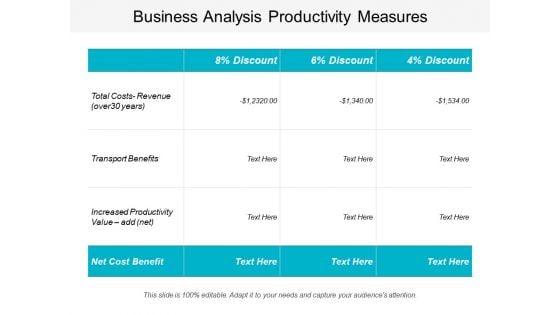
This is a balance scale with cost and benefits ppt powerpoint presentation show. This is a four stage process. The stages in this process are business, finance, marketing, strategy, compare, management.
Slide 1 of 5
This is a business goals targets and measures ppt powerpoint presentation summary icons. This is a six stage process. The stages in this process are business goals, business objectives, business priorities.


Slide 1 of 5
This is a business guidelines proactive proficient structured measurable ppt powerpoint presentation infographics mockup. This is a five stage process. The stages in this process are guidelines, values, guiding principles.




Slide 1 of 5
This is a measuring business process performance resource and requirements ppt powerpoint presentation styles skills. This is a six stage process. The stages in this process are operational excellence, operational plan, operational process.


Slide 1 of 5
This is a business performance measures powerpoint slide designs. This is a three stage process. The stages in this process are business, marketing, performance, presentation, management.
Slide 1 of 5
This is a dashboards for measuring business performance ppt icon. This is a three stage process. The stages in this process are dashboard, measuring, management, speedometer, icons, strategy.


Slide 1 of 3
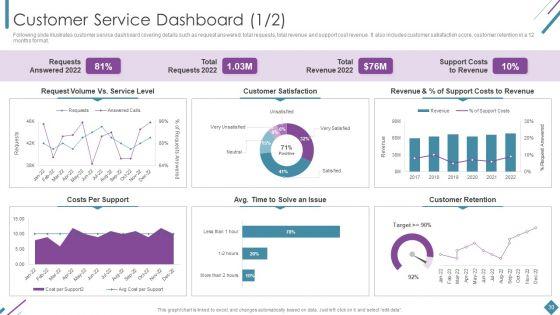
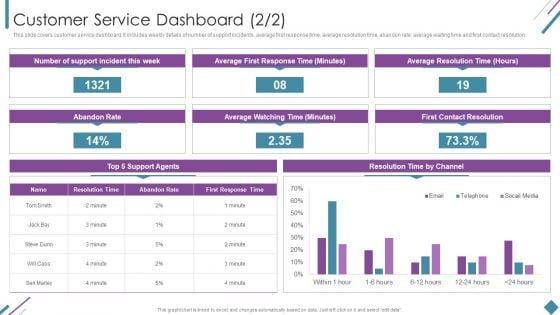
Following slide illustrates customer service dashboard covering details such as request answered, total requests, total revenue and support cost revenue. It also includes customer satisfaction score, customer retention in a 12 months format. Deliver and pitch your topic in the best possible manner with this Metrics To Measure Business Performance Customer Service Dashboard Sample PDF. Use them to share invaluable insights on Requests Answered 2022, Total Requests 2022, Total Revenue 2022 and impress your audience. This template can be altered and modified as per your expectations. So, grab it now.
Slide 1 of 3
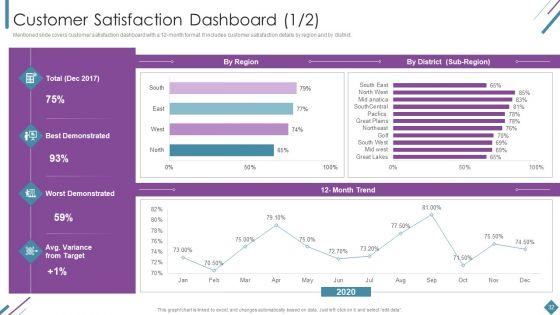
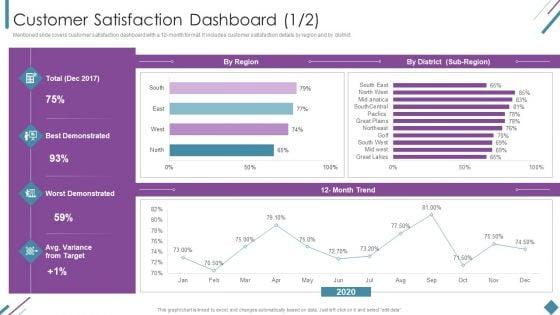
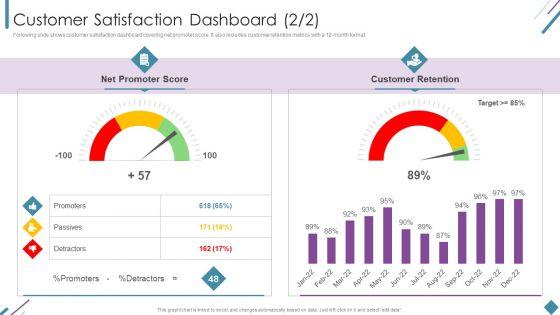
Mentioned slide covers customer satisfaction dashboard with a 12-month format. It includes customer satisfaction details by region and by district. Deliver an awe inspiring pitch with this creative Metrics To Measure Business Performance Customer Satisfaction Dashboard Summary PDF bundle. Topics like Best Demonstrated, Worst Demonstrated, 2020 can be discussed with this completely editable template. It is available for immediate download depending on the needs and requirements of the user.
Slide 1 of 3
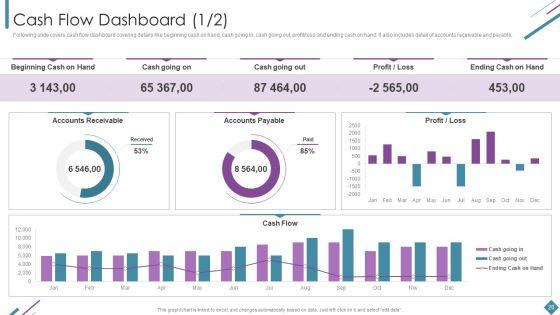
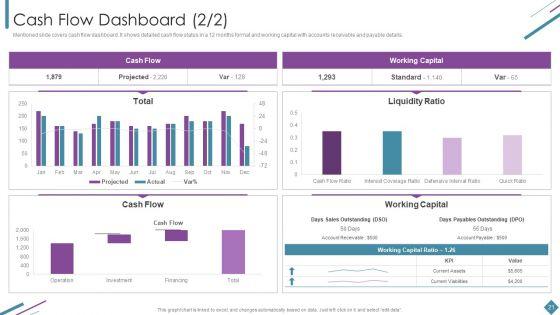
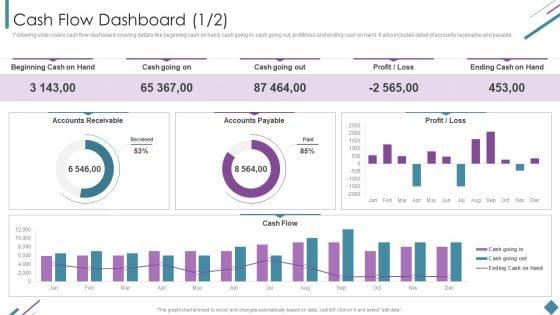
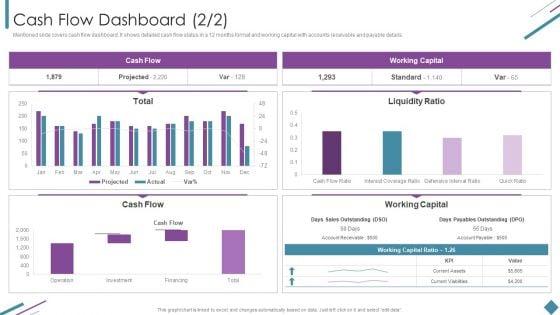
Following slide covers cash flow dashboard covering details like beginning cash on hand, cash going in, cash going out, profit or loss and ending cash on hand. It also includes detail of accounts receivable and payable. Deliver an awe inspiring pitch with this creative Metrics To Measure Business Performance Cash Flow Dashboard Rules PDF bundle. Topics like Beginning Cash Hand, Cash Going Out, Accounts Payable, Accounts Receivable can be discussed with this completely editable template. It is available for immediate download depending on the needs and requirements of the user.
Slide 1 of 3
Visually support your presentation with our above template illustrating battery icons. You may use this diagram to exhibit growth measurement. Convey your views with this business diagram slide.


Slide 1 of 3
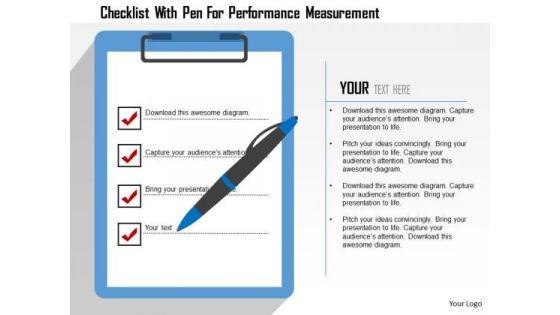
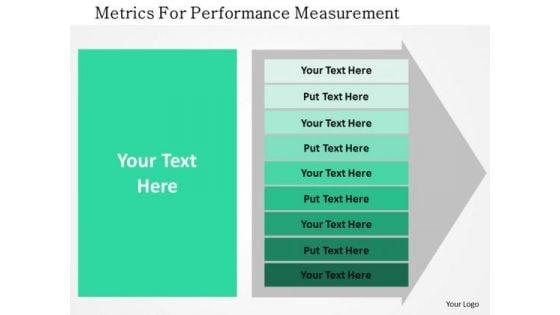
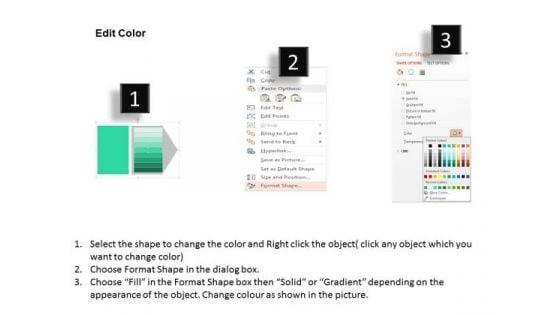
Our above business slide has been designed with graphics of checklist with pen. You may use this slide to display performance management. Download this diagram slide to make professional presentations.

Slide 1 of 3
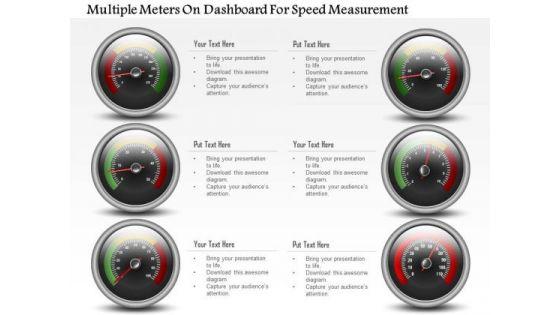
This diagram slide has been designed with graphic of matrix. You may use this matrix for performance management. Download this diagram to make interactive presentations.


Slide 1 of 3
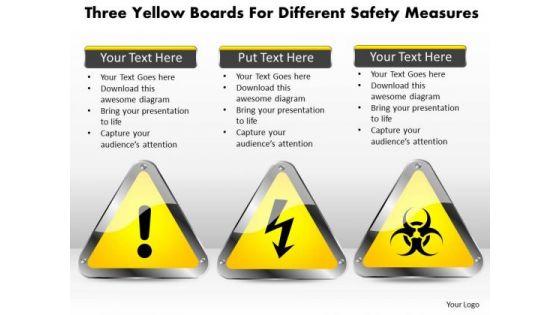
This business diagram has been designed with multiple meters on dashboard. This slide can be used for business planning and progress. Use this diagram for your business and success milestones related presentations.
Slide 1 of 3
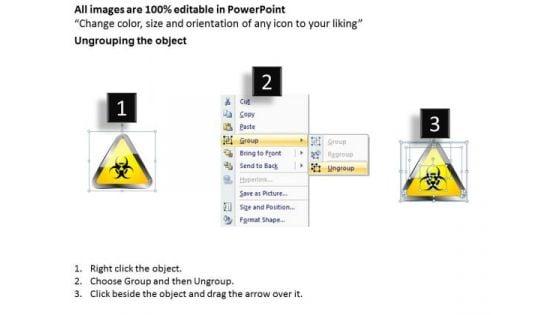
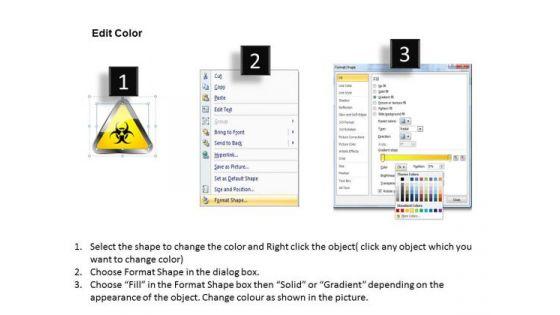
Three yellow boards are used to design this PowerPoint diagram. This template contains the different safety signs. Use his diagram to learn about safety and prevention in your workplace, home, and other places.


Slide 1 of 3
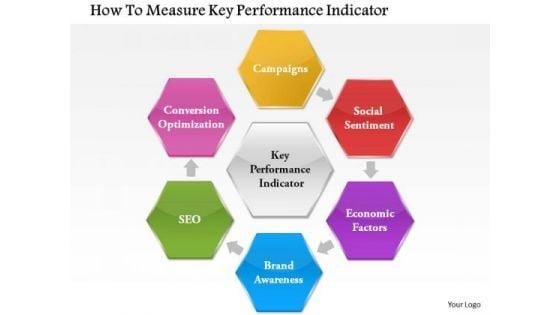
This Power Point diagram slide has been crafted with graphic of flower petal diagram. This PPT slide contains the concept of measuring the key performance and indicate it. Use this PPT slide for your management related presentation.


Slide 1 of 3
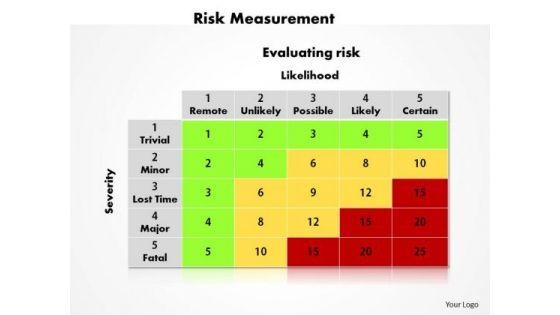
The above slide has framework of risk measurement. Use this diagram for giving a clear message in a structured manner. This template helps you to grab the attention of your listener.


Slide 1 of 3
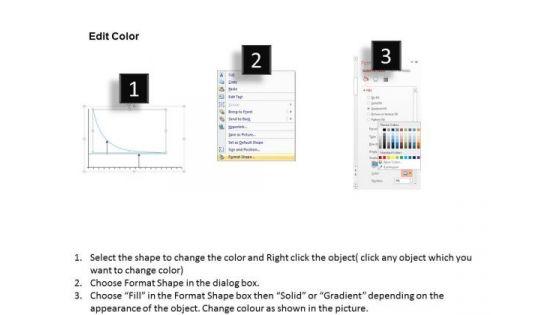
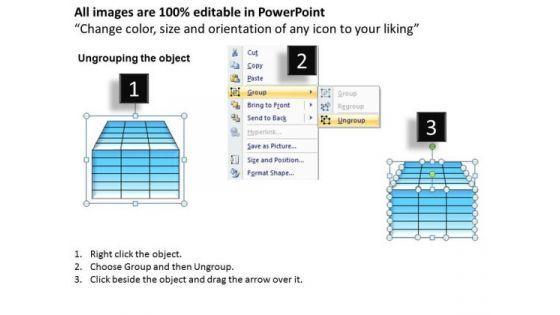
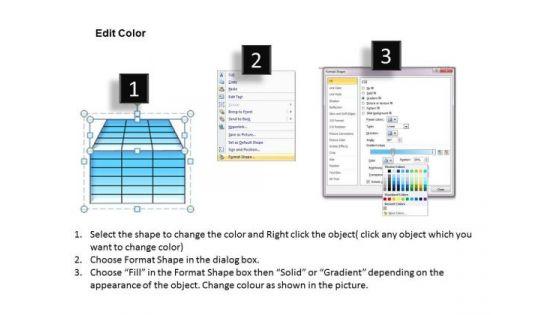
This business framework has been crafted with graphic of graph with concept of measuring risk. Use this template for marketing and business related risk calculation.

Slide 1 of 3
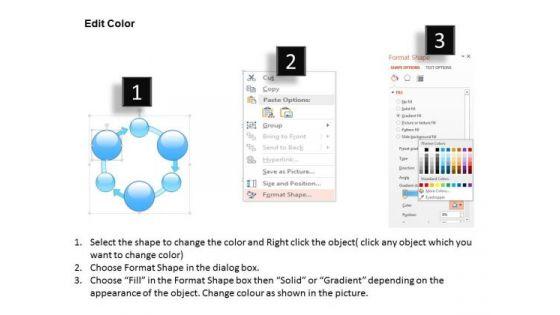
This image slide displays demand measurement business framework. Use this image slide to express views on segmentation in marketing. You may change color size and orientation of any icon to your liking. Create professional presentations by using this image slide.
Slide 1 of 3
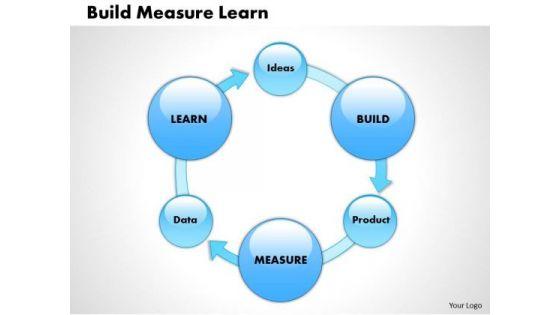
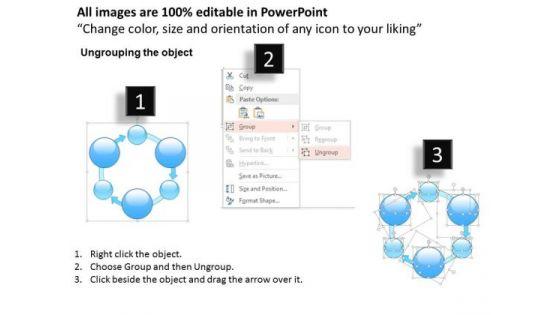
This business power point diagram slide has been designed with build measure learn. This is used in lean manufacturing system where you have to show continuous deployment and minimal viable production. Use this PPT slide in your production related presentations.


Slide 1 of 3
Deliver The Right Dose With Our Business Diagram Measuring Risk PowerPoint PPT Presentation PowerPoint Templates. Your Ideas Will Get The Correct Illumination. Your Abilities Have Been Lying Dormant. Awaken Them With Our Business PowerPoint Templates.
Slide 1 of 3
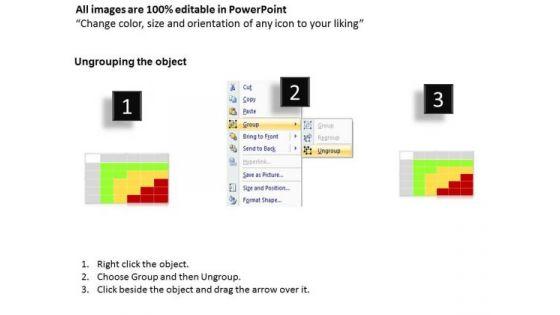
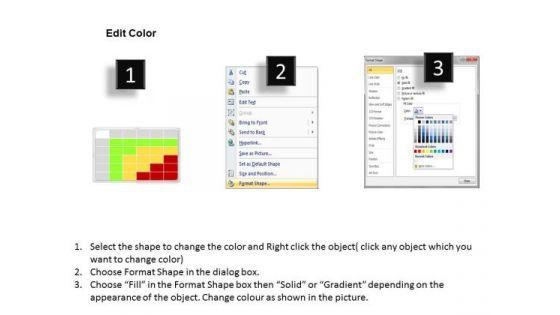
Put Them On The Same Page With Our Business Diagram Risk Measurement PowerPoint PPT Presentation PowerPoint Templates. Yours Team Will Sing From The Same Sheet.
Slide 1 of 3
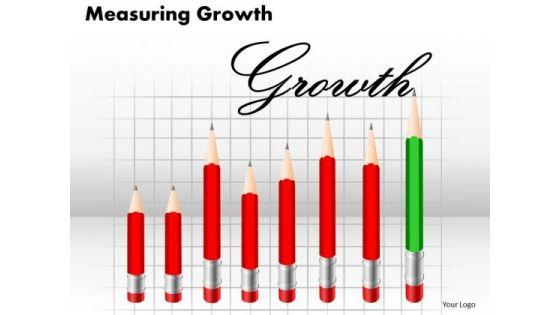
Get The Doers Into Action. Activate Them With Our Consulting Diagram Measuring Growth 1 Business Cycle Diagram Powerpoint Templates.

Slide 1 of 3
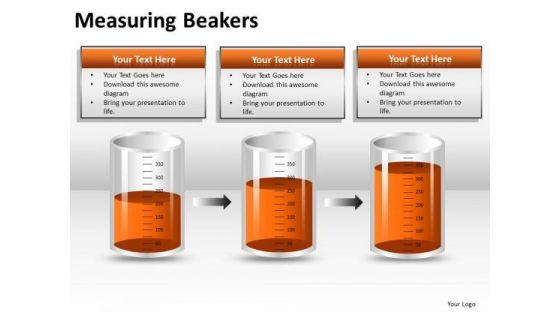
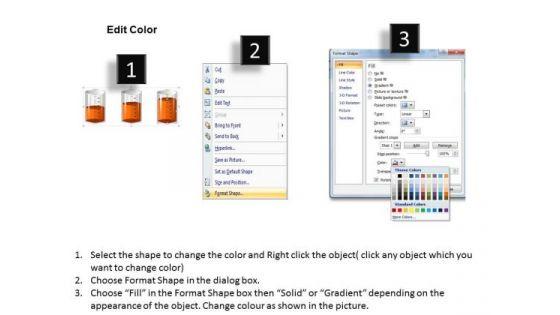
Deliver The Right Dose With Our Sales Diagram Measuring Beakers Business Framework Model Powerpoint Templates. Your Ideas Will Get The Correct Illumination.


Slide 1 of 3
Land The Idea With Our Strategic Management Measuring Value In Flasks Business Framework Model Powerpoint Templates. Help It Grow With Your Thoughts.


Slide 1 of 3
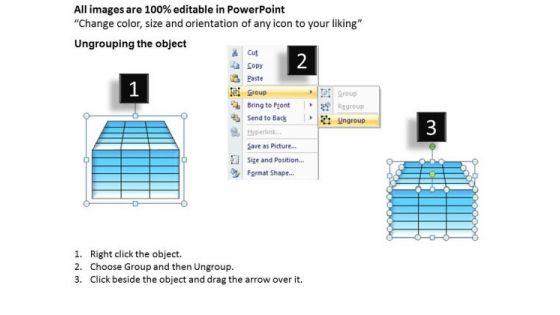
Touch Base With Our Demand Measurement Business Powerpoint Presentation Powerpoint Templates. Review Your Growth With Your Audience.
Slide 1 of 3
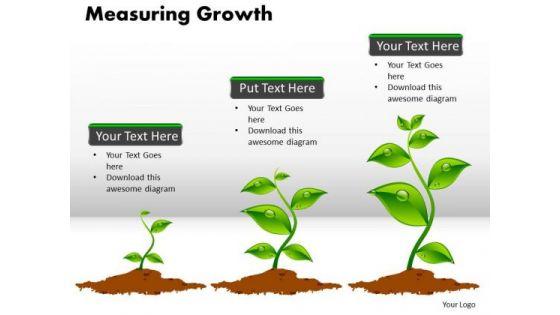
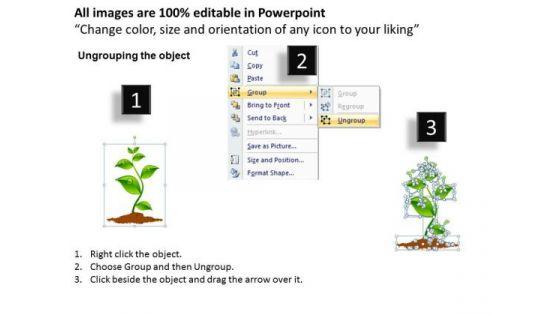
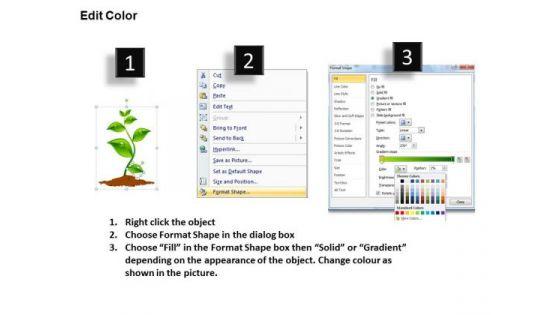
Business Process PowerPoint Templates Sales Measuring Growth PPT Slides-This Diagram shows growing plants that is a conceptual representation for measuring growth -Business Process PowerPoint Templates Sales Measuring Growth PPT Slides-This template can be used for presentations relating to Accounting, Accounts, Analysis, Business, Capital, Cash, Coins, Concept, Conceptual, Corporate, Data, Detail, Earnings, Evaluate, Finance, Financial, Gains, Golden, Green, Growing, Growth, Hand, Income, Increasing, Indicator, Measuring Dont muddle through your presentation. Be in control with our Business Process PowerPoint Templates Sales Measuring Growth Ppt Slides. You will be at the top of your game.
Slide 1 of 3
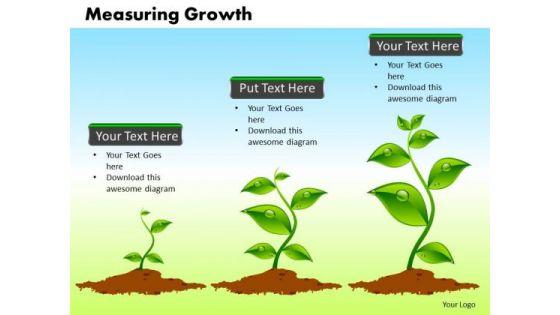
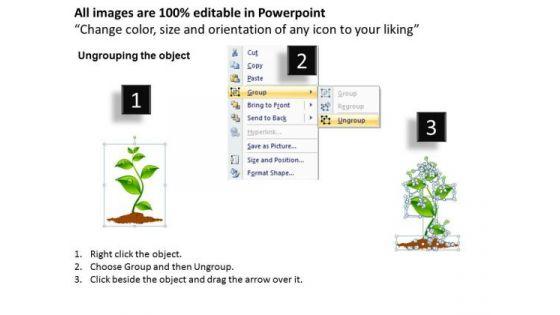
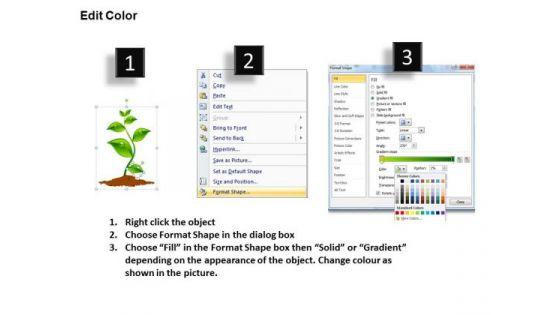
Business Process PowerPoint Templates Business Measuring Growth PPT Slides-This Diagram shows growing plants that is a conceptual representation for measuring growth -Business Process PowerPoint Templates Business Measuring Growth PPT Slides-This template can be used for presentations relating to Accounting, Accounts, Analysis, Business, Capital, Cash, Coins, Concept, Conceptual, Corporate, Data, Detail, Earnings, Evaluate, Finance, Financial, Gains, Golden, Green, Growing, Growth, Hand, Income, Increasing, Indicator, Measuring With our Business Process PowerPoint Templates Business Measuring Growth Ppt Slides there is no dearth of ideas. They crop up everywhere.
Slide 1 of 3
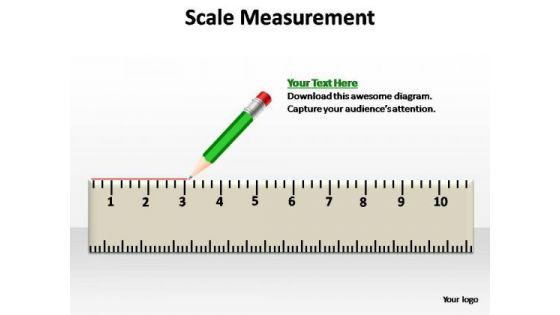
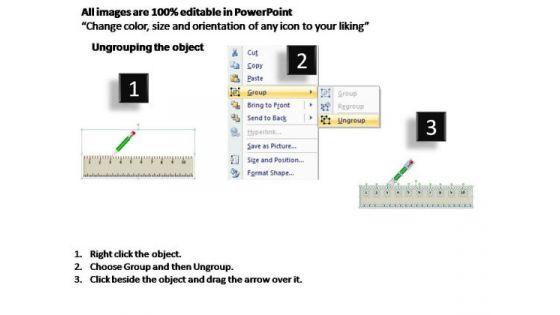
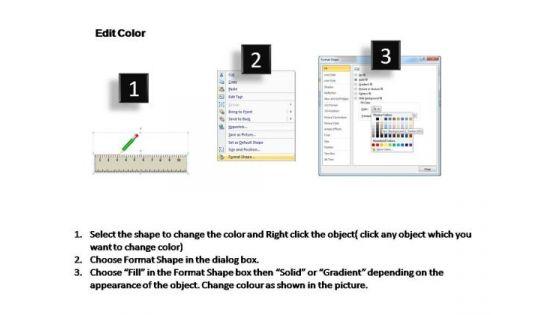
PowerPoint Template Business Scale Measurement PPT Slides Business Power Points-These high quality powerpoint pre-designed slides and powerpoint templates have been carefully created by our professional team to help you impress your audience. All slides have been created and are 100% editable in powerpoint. Each and every property of any graphic - color, size, orientation, shading, outline etc. can be modified to help you build an effective powerpoint presentation. Any text can be entered at any point in the powerpoint template or slide. Simply DOWNLOAD, TYPE and PRESENT!-These amazing PowerPoint pre-designed slides and PowerPoint templates have been carefully created by our team of experts to help you impress your audience. Our stunning collection of Powerpoint slides are 100% editable and can easily fit in any PowerPoint presentations. By using these animations and graphics in PowerPoint and you can easily make professional presentations. Any text can be entered at any point in the PowerPoint template or slide. Just DOWNLOAD our awesome PowerPoint templates and you are ready to go. Our PowerPoint Template Business Scale Measurement Ppt Slides are committed to benefit you. They ensure your thoughts get the credit.
Slide 1 of 3
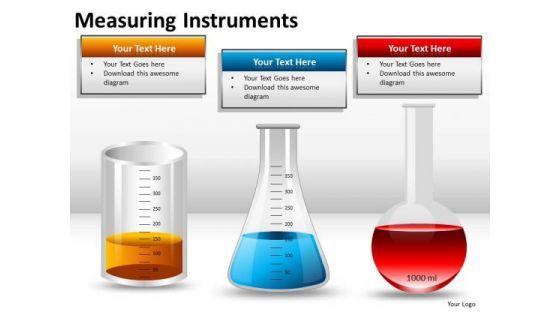
Buisness Measuring Instruments PowerPoint Slides And PPT Diagram Templates-These high quality powerpoint pre-designed slides and powerpoint templates have been carefully created by our professional team to help you impress your audience. All slides have been created and are 100% editable in powerpoint. Each and every property of any graphic - color, size, orientation, shading, outline etc. can be modified to help you build an effective powerpoint presentation. Any text can be entered at any point in the powerpoint template or slide. Simply DOWNLOAD, TYPE and PRESENT! Establish control with our Business Measuring Instruments PowerPoint Slides And Ppt Diagram Templates. Let your thoughts take the reins.


Slide 1 of 3
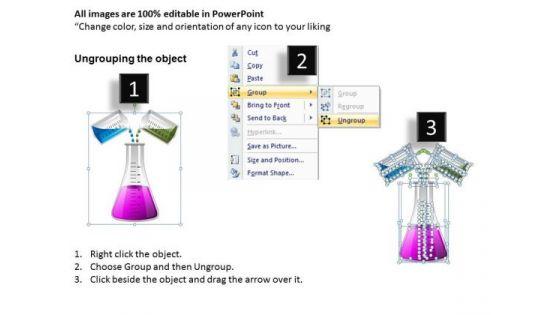
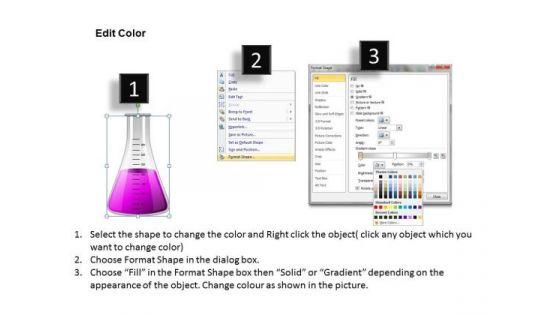
Buisness Measuring Flasks PowerPoint Slides And PPT Diagram Templates-These high quality powerpoint pre-designed slides and powerpoint templates have been carefully created by our professional team to help you impress your audience. All slides have been created and are 100% editable in powerpoint. Each and every property of any graphic - color, size, orientation, shading, outline etc. can be modified to help you build an effective powerpoint presentation. Any text can be entered at any point in the powerpoint template or slide. Simply DOWNLOAD, TYPE and PRESENT! Be a proactive manager with our Business Measuring Flasks PowerPoint Slides And Ppt Diagram Templates. They will make you look good.


Slide 1 of 3
Microsoft PowerPoint Template and Background with a thermometer measuring your innovation level as you intent You are due to debut on the dais. Ensure an auspicious entry into this environment with our Innovation Measuring Business PowerPoint Templates And PowerPoint Backgrounds 0811


Slide 1 of 3
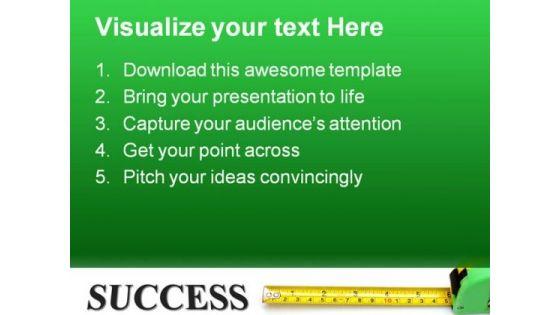
Microsoft PowerPoint Template and Background with a ruler measuring the word success Use our Measure Success Business PowerPoint Templates And PowerPoint Backgrounds 0611 as an example. Demonstrate the benefit of attention to detail.


Slide 1 of 3
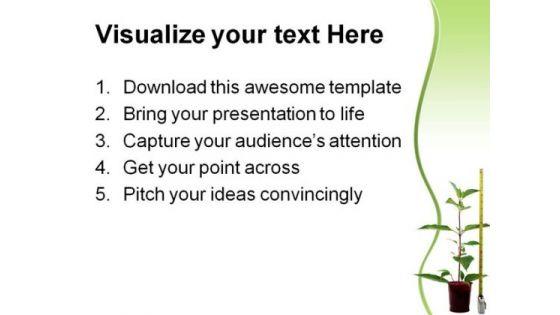
Microsoft PowerPoint Template and Background with flowerpot with indoor plant standing near long ruler No need to dig deep for new ideas. Our Measuring Success Business PowerPoint Templates And PowerPoint Backgrounds 0611 will ferret them out.
Slide 1 of 2
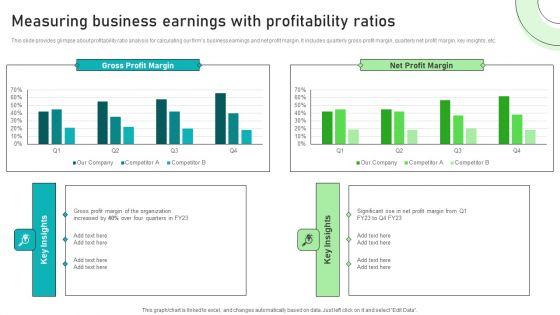
This slide provides glimpse about profitability ratio analysis for calculating our firms business earnings and net profit margin. It includes quarterly gross profit margin, quarterly net profit margin, key insights, etc. The Adjusting Financial Strategies And Planning Measuring Business Earnings With Profitability Ratios Download PDF is a compilation of the most recent design trends as a series of slides. It is suitable for any subject or industry presentation, containing attractive visuals and photo spots for businesses to clearly express their messages. This template contains a variety of slides for the user to input data, such as structures to contrast two elements, bullet points, and slides for written information. Slidegeeks is prepared to create an impression.
Slide 1 of 2
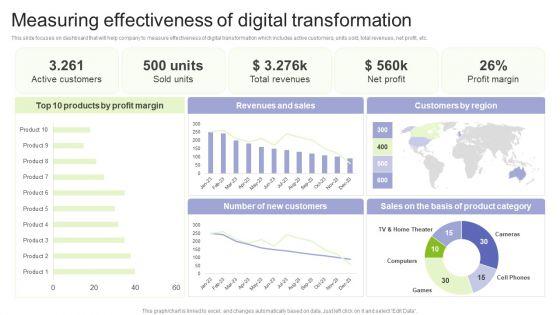
This slide focuses on dashboard that will help company to measure effectiveness of digital transformation which includes active customers, units sold, total revenues, net profit, etc. Want to ace your presentation in front of a live audience Our Implementing Change Management Strategy To Transform Business Processes Measuring Effectiveness Of Digital Information PDF can help you do that by engaging all the users towards you. Slidegeeks experts have put their efforts and expertise into creating these impeccable powerpoint presentations so that you can communicate your ideas clearly. Moreover, all the templates are customizable, and easy to edit and downloadable. Use these for both personal and commercial use.
Slide 1 of 2
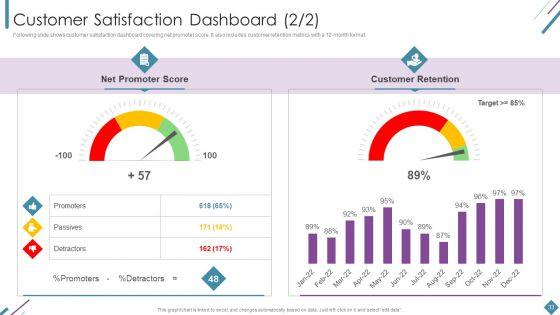
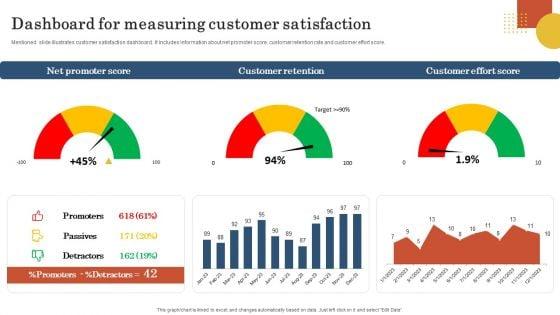
Mentioned slide illustrates customer satisfaction dashboard. It includes information about net promoter score, customer retention rate and customer effort score. Present like a pro with Retail Business Operation Management To Optimize Customer Experience Dashboard Measuring Customer Infographics PDF Create beautiful presentations together with your team, using our easy to use presentation slides. Share your ideas in real time and make changes on the fly by downloading our templates. So whether you are in the office, on the go, or in a remote location, you can stay in sync with your team and present your ideas with confidence. With Slidegeeks presentation got a whole lot easier. Grab these presentations today.
Slide 1 of 2
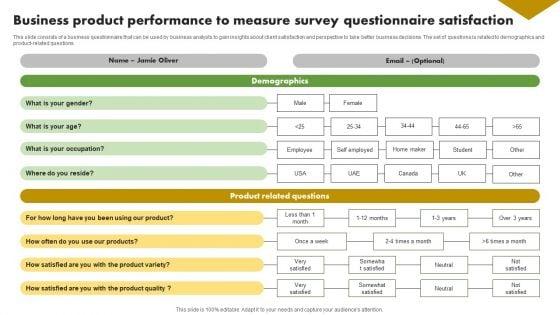
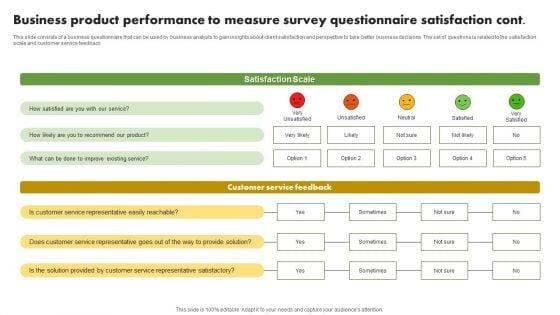
Showcasing this set of slides titled Business Product Performance To Measure Survey Questionnaire Satisfaction Survey SS. The topics addressed in these templates are Satisfaction, Product Related, Demographics . All the content presented in this PPT design is completely editable. Download it and make adjustments in color, background, font etc. as per your unique business setting.
SHOW
- 60
- 120
- 180
DISPLAYING: 60 of 394 Item(s)
Page
