- Sign up
- Sign In
 AI PPT Maker
 Templates
 PPT Bundles
 Design Services
 Business PPTs
 Business Plan
 Management
 Strategy
 Introduction PPT
 Roadmap
 Self Introduction
 Timelines
 Process
 Marketing
 Agenda
 Technology
 Medical
 Startup Business Plan
 Cyber Security
 Dashboards
 SWOT
SWOT Proposals
 Education
 Pitch Deck
 Digital Marketing
 KPIs
KPIs Project Management
 Product Management
 Artificial Intelligence
 Target Market
 Communication
 Supply Chain
 Google Slides
 Research Services
 One Pagers
 All Categories
Measure financial PowerPoint Presentation Templates and Google Slides
SHOW
- 60
- 120
- 180
DISPLAYING: 60 of 122 Item(s)
Page


Share a great deal of information on the topic by deploying this financial measurement of cash flow from operations profit ppt powerpoint presentation complete deck with slides. Support your ideas and thought process with this prefabricated set. It includes a set of twelve slides, all fully modifiable and editable. Each slide can be restructured and induced with the information and content of your choice. You can add or remove large content boxes as well, to make this PPT slideshow more personalized. Its high-quality graphics and visuals help in presenting a well-coordinated pitch. This PPT template is also a resourceful tool to take visual cues from and implement the best ideas to help your business grow and expand. The main attraction of this well-formulated deck is that everything is editable, giving you the freedom to adjust it to your liking and choice. Changes can be made in the background and theme as well to deliver an outstanding pitch. Therefore, click on the download button now to gain full access to this multifunctional set.


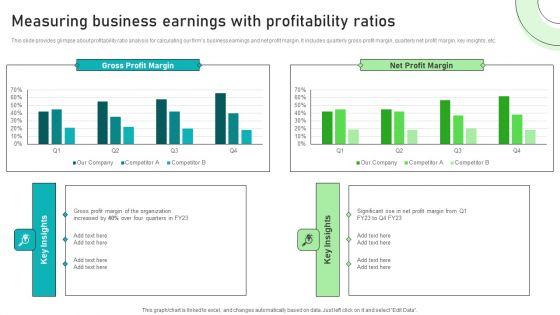

This slide provides glimpse about profitability ratio analysis for calculating our firms business earnings and net profit margin. It includes quarterly gross profit margin, quarterly net profit margin, key insights, etc. The Adjusting Financial Strategies And Planning Measuring Business Earnings With Profitability Ratios Download PDF is a compilation of the most recent design trends as a series of slides. It is suitable for any subject or industry presentation, containing attractive visuals and photo spots for businesses to clearly express their messages. This template contains a variety of slides for the user to input data, such as structures to contrast two elements, bullet points, and slides for written information. Slidegeeks is prepared to create an impression.
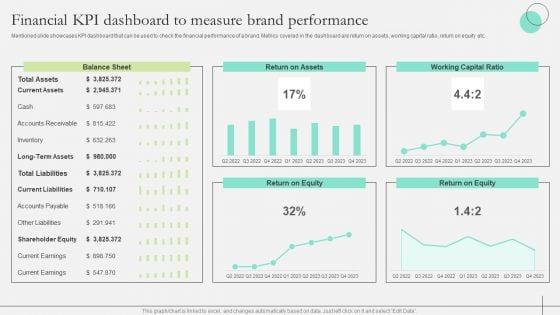

Mentioned slide showcases KPI dashboard that can be used to check the financial performance of a brand. Metrics covered in the dashboard are return on assets, working capital ratio, return on equity etc. Take your projects to the next level with our ultimate collection of Comprehensive Guide To Strengthen Brand Equity Financial KPI Dashboard Measure Brand Structure PDF. Slidegeeks has designed a range of layouts that are perfect for representing task or activity duration, keeping track of all your deadlines at a glance. Tailor these designs to your exact needs and give them a truly corporate look with your own brand colors they will make your projects stand out from the rest
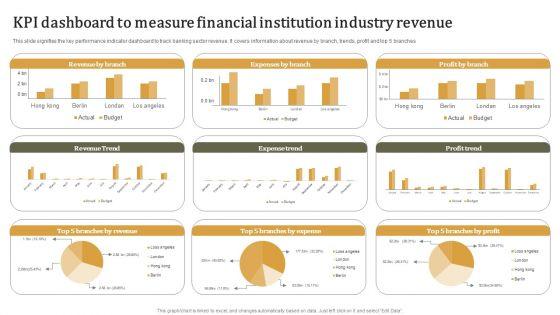
Pitch your topic with ease and precision using this KPI Dashboard To Measure Financial Institution Industry Revenue Summary PDF. This layout presents information on Measure Financial, Institution Industry . It is also available for immediate download and adjustment. So, changes can be made in the color, design, graphics or any other component to create a unique layout.
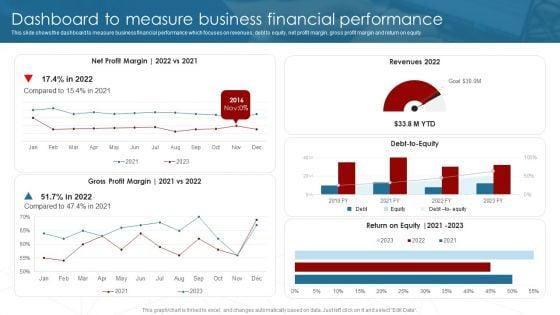

This slide shows the dashboard to measure business financial performance which focuses on revenues, debt to equity, net profit margin, gross profit margin and return on equity. Do you have to make sure that everyone on your team knows about any specific topic I yes, then you should give Deployment Of Business Process Dashboard To Measure Business Financial Performance Microsoft PDF a try. Our experts have put a lot of knowledge and effort into creating this impeccable Deployment Of Business Process Dashboard To Measure Business Financial Performance Microsoft PDF. You can use this template for your upcoming presentations, as the slides are perfect to represent even the tiniest detail. You can download these templates from the Slidegeeks website and these are easy to edit. So grab these today.
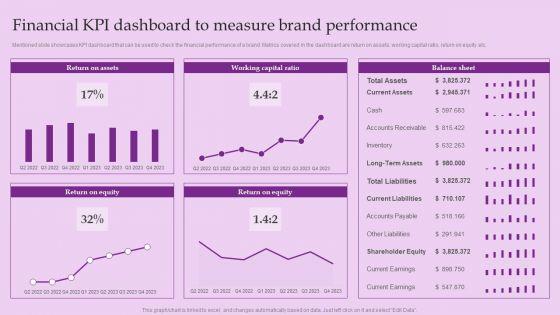
Mentioned slide showcases KPI dashboard that can be used to check the financial performance of a brand. Metrics covered in the dashboard are return on assets, working capital ratio, return on equity etc.Coming up with a presentation necessitates that the majority of the effort goes into the content and the message you intend to convey. The visuals of a PowerPoint presentation can only be effective if it supplements and supports the story that is being told. Keeping this in mind our experts created Financial KPI Dashboard To Measure Brand Performance Brand And Equity Evaluation Techniques Elements PDF to reduce the time that goes into designing the presentation. This way, you can concentrate on the message while our designers take care of providing you with the right template for the situation.
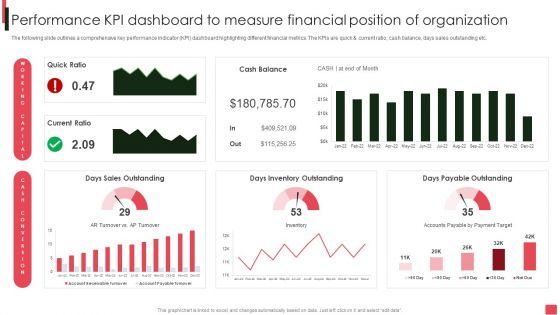
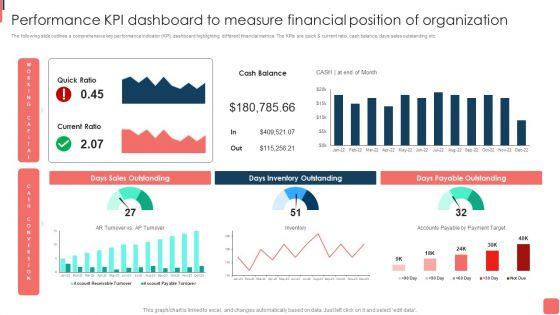
The following slide outlines a comprehensive key performance indicator KPI dashboard highlighting different financial metrics. The KPIs are quick and current ratio, cash balance, days sales outstanding etc. Welcome to our selection of the Overview Of Organizational Performance Kpi Dashboard To Measure Financial Position Sample PDF. These are designed to help you showcase your creativity and bring your sphere to life. Planning and Innovation are essential for any business that is just starting out. This collection contains the designs that you need for your everyday presentations. All of our PowerPoints are 100 percent editable, so you can customize them to suit your needs. This multi-purpose template can be used in various situations. Grab these presentation templates today.
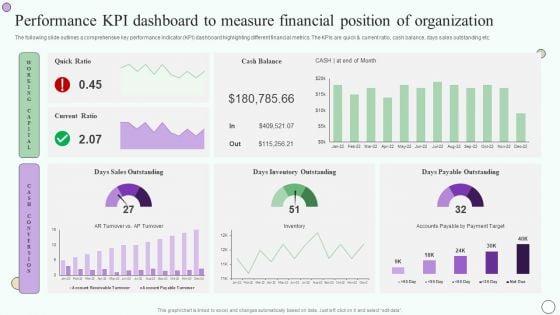

The following slide outlines a comprehensive key performance indicator KPI dashboard highlighting different financial metrics. The KPIs are quick and current ratio, cash balance, days sales outstanding etc. Welcome to our selection of the Estimating Business Overall Performance Kpi Dashboard To Measure Financial Position Inspiration PDF. These are designed to help you showcase your creativity and bring your sphere to life. Planning and Innovation are essential for any business that is just starting out. This collection contains the designs that you need for your everyday presentations. All of our PowerPoints are 100 percent editable, so you can customize them to suit your needs. This multi-purpose template can be used in various situations. Grab these presentation templates today.
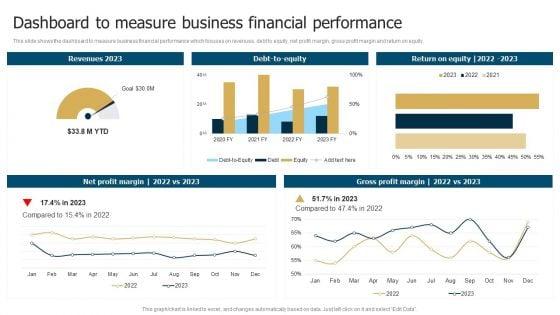

This slide shows the dashboard to measure business financial performance which focuses on revenues, debt to equity, net profit margin, gross profit margin and return on equity. If you are looking for a format to display your unique thoughts, then the professionally designed Business Restructuring Process Dashboard To Measure Business Financial Performance Rules PDF is the one for you. You can use it as a Google Slides template or a PowerPoint template. Incorporate impressive visuals, symbols, images, and other charts. Modify or reorganize the text boxes as you desire. Experiment with shade schemes and font pairings. Alter, share or cooperate with other people on your work. Download Business Restructuring Process Dashboard To Measure Business Financial Performance Rules PDF and find out how to give a successful presentation. Present a perfect display to your team and make your presentation unforgettable.


This slide shows the dashboard to measure business financial performance which focuses on revenues, debt to equity, net profit margin, gross profit margin and return on equity. Are you searching for a Dashboard To Measure Business Financial Performance Summary PDF that is uncluttered, straightforward, and original Its easy to edit, and you can change the colors to suit your personal or business branding. For a presentation that expresses how much effort youve put in, this template is ideal With all of its features, including tables, diagrams, statistics, and lists, its perfect for a business plan presentation. Make your ideas more appealing with these professional slides. Download Dashboard To Measure Business Financial Performance Summary PDF from Slidegeeks today.
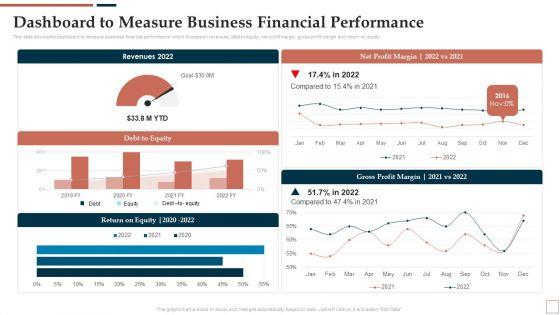

This slide shows the dashboard to measure business financial performance which focuses on revenues, debt to equity, net profit margin, gross profit margin and return on equity. Coming up with a presentation necessitates that the majority of the effort goes into the content and the message you intend to convey. The visuals of a PowerPoint presentation can only be effective if it supplements and supports the story that is being told. Keeping this in mind our experts created BPR To Develop Operational Effectiveness Dashboard To Measure Business Financial Performance Elements PDF to reduce the time that goes into designing the presentation. This way, you can concentrate on the message while our designers take care of providing you with the right template for the situation.
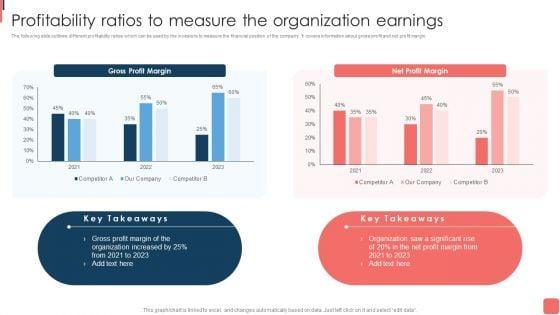

The following slide outlines different profitability ratios which can be used by the investors to measure the financial position of the company. It covers information about gross profit and net profit margin. Retrieve professionally designed Effective Financial Planning Assessment Techniques Profitability Ratios To Measure The Organization Earnings Inspiration PDF to effectively convey your message and captivate your listeners. Save time by selecting pre-made slideshows that are appropriate for various topics, from business to educational purposes. These themes come in many different styles, from creative to corporate, and all of them are easily adjustable and can be edited quickly. Access them as PowerPoint templates or as Google Slides themes. You do not have to go on a hunt for the perfect presentation because Slidegeeks got you covered from everywhere.

The following slide outlines a comprehensive key performance indicator KPI dashboard highlighting different financial metrics. The KPIs are quick and current ratio, cash balance, days sales outstanding etc. The best PPT templates are a great way to save time, energy, and resources. Slidegeeks have 100 precent editable powerpoint slides making them incredibly versatile. With these quality presentation templates, you can create a captivating and memorable presentation by combining visually appealing slides and effectively communicating your message. Download Effective Financial Planning Assessment Techniques Performance Kpi Dashboard To Measure Financial Graphics PDF from Slidegeeks and deliver a wonderful presentation.
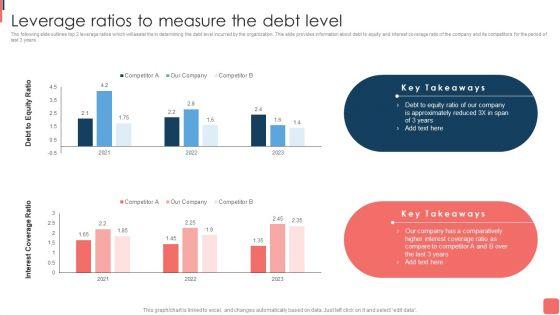
The following slide outlines top 2 leverage ratios which will assist the in determining the debt level incurred by the organization. This slide provides information about debt to equity and interest coverage ratio of the company and its competitors for the period of last 3 years. This modern and well-arranged Effective Financial Planning Assessment Techniques Leverage Ratios To Measure The Debt Level Sample PDF provides lots of creative possibilities. It is very simple to customize and edit with the Powerpoint Software. Just drag and drop your pictures into the shapes. All facets of this template can be edited with Powerpoint no extra software is necessary. Add your own material, put your images in the places assigned for them, adjust the colors, and then you can show your slides to the world, with an animated slide included.


Mentioned slide showcases KPI dashboard that can be used to check the financial performance of a brand. Metrics covered in the dashboard are return on assets, working capital ratio, return on equity etc.Coming up with a presentation necessitates that the majority of the effort goes into the content and the message you intend to convey. The visuals of a PowerPoint presentation can only be effective if it supplements and supports the story that is being told. Keeping this in mind our experts created Guide To Develop And Estimate Brand Value Financial KPI Dashboard To Measure Brand Performance Formats PDF to reduce the time that goes into designing the presentation. This way, you can concentrate on the message while our designers take care of providing you with the right template for the situation.
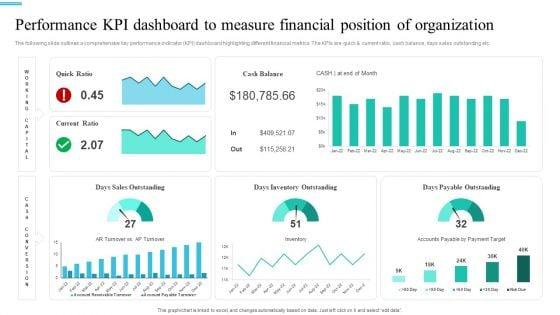

The following slide outlines a comprehensive key performance indicator KPI dashboard highlighting different financial metrics. The KPIs are quick and current ratio, cash balance, days sales outstanding etc. The best PPT templates are a great way to save time, energy, and resources. Slidegeeks have 100 percent editable powerpoint slides making them incredibly versatile. With these quality presentation templates, you can create a captivating and memorable presentation by combining visually appealing slides and effectively communicating your message. Download Monetary Planning And Evaluation Guide Performance KPI Dashboard To Measure Financial Position Of Organization Ppt File Slides PDF from Slidegeeks and deliver a wonderful presentation.

Mentioned slide showcases KPI dashboard that can be used to check the financial performance of a brand. Metrics covered in the dashboard are return on assets, working capital ratio, return on equity etc.Are you in need of a template that can accommodate all of your creative concepts This one is crafted professionally and can be altered to fit any style. Use it with Google Slides or PowerPoint. Include striking photographs, symbols, depictions, and other visuals. Fill, move around, or remove text boxes as desired. Test out color palettes and font mixtures. Edit and save your work, or work with colleagues. Download Financial Kpi Dashboard To Measure Brand Performance Brand Value Estimation Guide Inspiration PDF and observe how to make your presentation outstanding. Give an impeccable presentation to your group and make your presentation unforgettable.
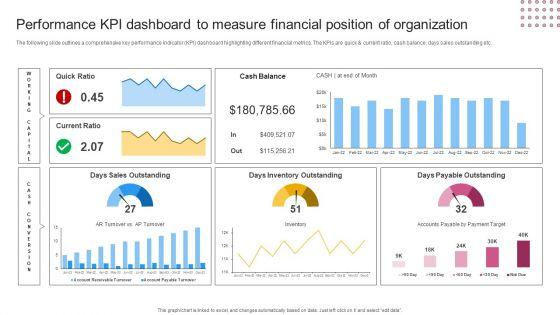

The following slide outlines a comprehensive key performance indicator KPI dashboard highlighting different financial metrics. The KPIs are quick and current ratio, cash balance, days sales outstanding etc. Slidegeeks is here to make your presentations a breeze with Performance KPI Dashboard To Measure Financial Position Of Organization Pictures PDF With our easy to use and customizable templates, you can focus on delivering your ideas rather than worrying about formatting. With a variety of designs to choose from, you are sure to find one that suits your needs. And with animations and unique photos, illustrations, and fonts, you can make your presentation pop. So whether you are giving a sales pitch or presenting to the board, make sure to check out Slidegeeks first.
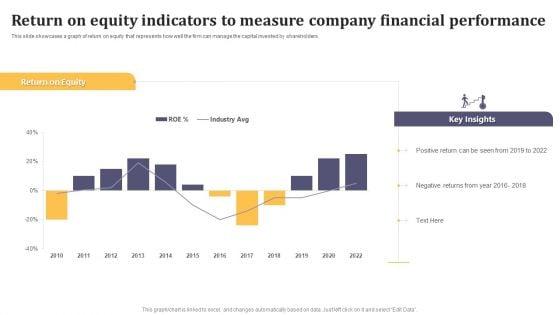
This slide showcases a graph of return on equity that represents how well the firm can manage the capital invested by shareholders. Pitch your topic with ease and precision using this Return On Equity Indicators To Measure Company Financial Performance Mockup PDF. This layout presents information on Return On Equity, Key Insights, Positive Return. It is also available for immediate download and adjustment. So, changes can be made in the color, design, graphics or any other component to create a unique layout.
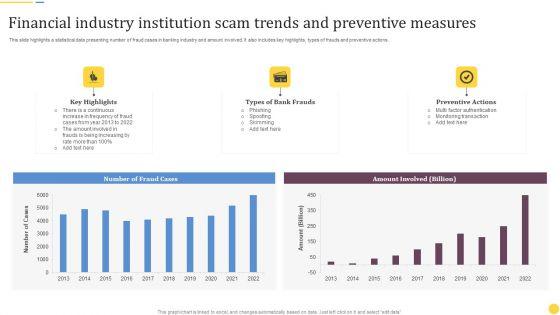

This slide highlights a statistical data presenting number of fraud cases in banking industry and amount involved. It also includes key highlights, types of frauds and preventive actions. Pitch your topic with ease and precision using this Financial Industry Institution Scam Trends And Preventive Measures Ideas PDF. This layout presents information on Key Highlights, Types Bank Frauds, Preventive Actions. It is also available for immediate download and adjustment. So, changes can be made in the color, design, graphics or any other component to create a unique layout.


This slide shows net cash flow measurement of financial feasibility to assess the practicality of project. It includes factors such as amount and cumulative net cash flow. Pitch your topic with ease and precision using this Net Cash Flow To Measure Monetary Financial Study Ppt Layouts Clipart Images PDF. This layout presents information on Cash Flow, Profit Generation, Quick Payment Terms. It is also available for immediate download and adjustment. So, changes can be made in the color, design, graphics or any other component to create a unique layout.


Following slide provides financial details of company including revenue and operating profit. Revenue recorded in FY22 was dollar 518,932 while operating profit recorded was dollar 481,932. Deliver an awe inspiring pitch with this creative Metrics To Measure Business Performance Key Financials Of The Company Elements PDF bundle. Topics like Revenue, Operating Profit can be discussed with this completely editable template. It is available for immediate download depending on the needs and requirements of the user.


This slide shows financial performance indicator dashboard covering net profit and net sales, profitability indicator ratios, cogs and net profit by region or channel. Deliver an awe inspiring pitch with this creative Metrics To Measure Business Performance Financial Performance Indicator Dashboard Pictures PDF bundle. Topics like Net Profit, Net Sales, Cost Goods, Sold Breakdown can be discussed with this completely editable template. It is available for immediate download depending on the needs and requirements of the user.
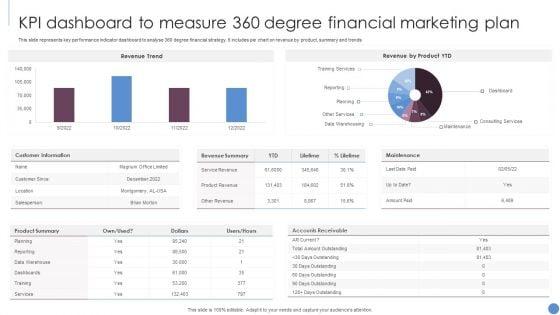

This slide represents key performance indicator dashboard to analyse 360 degree financial strategy. It includes pie chart on revenue by product, summary and trends. Showcasing this set of slides titled KPI Dashboard To Measure 360 Degree Financial Marketing Plan Slides PDF. The topics addressed in these templates are Revenue Trend, Revenue Product YTD, Customer Information. All the content presented in this PPT design is completely editable. Download it and make adjustments in color, background, font etc. as per your unique business setting.
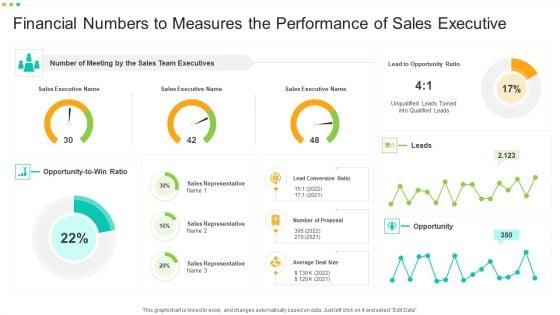
Showcasing this set of slides titled Financial Numbers To Measures The Performance Of Sales Executive Summary PDF. The topics addressed in these templates are Team, Executives, Sales. All the content presented in this PPT design is completely editable. Download it and make adjustments in color, background, font etc. as per your unique business setting.


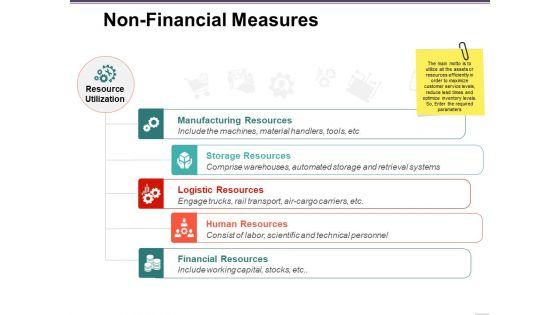
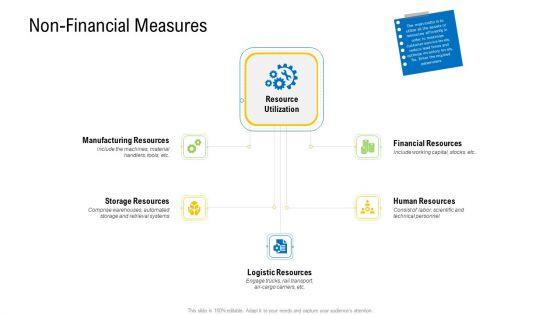
This is a scm and purchasing non financial measures ppt infographic template background images pdf template with various stages. Focus and dispense information on five stages using this creative set, that comes with editable features. It contains large content boxes to add your information on topics like manufacturing resources, storage resources, logistic resources . You can also showcase facts, figures, and other relevant content using this PPT layout. Grab it now.
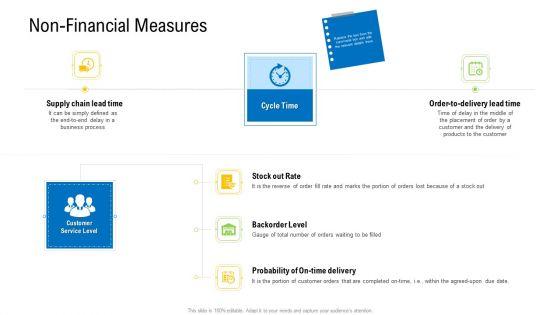
Presenting scm and purchasing non financial measures resources ppt icon outfit pdf to provide visual cues and insights. Share and navigate important information on three stages that need your due attention. This template can be used to pitch topics like backorder level, probability, customer, service . In addtion, this PPT design contains high resolution images, graphics, etc, that are easily editable and available for immediate download.


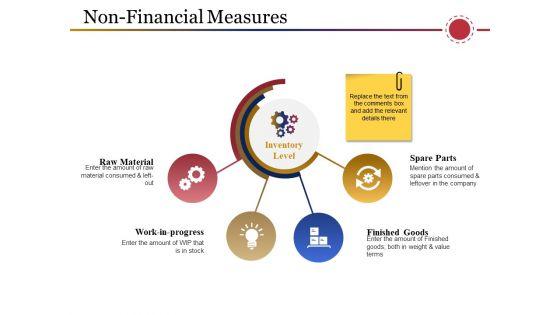
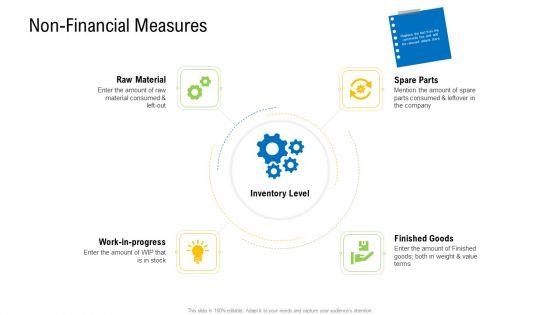
This is a scm and purchasing non financial measures material ppt gallery graphics download pdf template with various stages. Focus and dispense information on four stages using this creative set, that comes with editable features. It contains large content boxes to add your information on topics like raw material, consumed, value, finished goods . You can also showcase facts, figures, and other relevant content using this PPT layout. Grab it now.
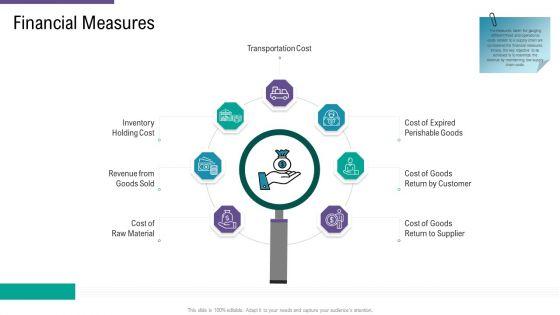

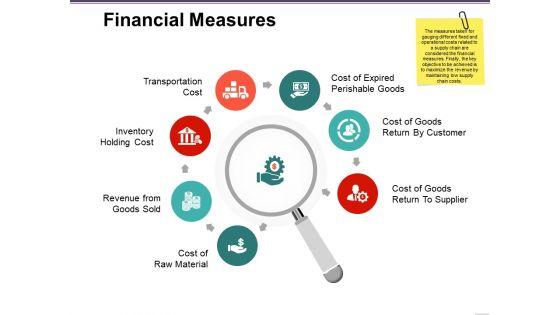
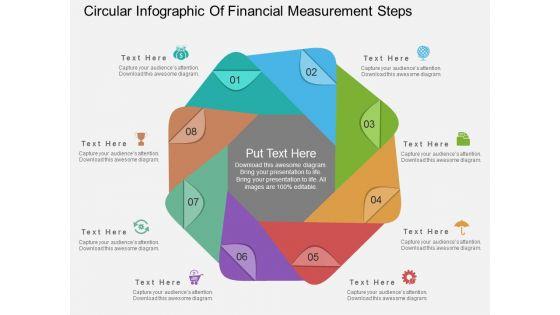
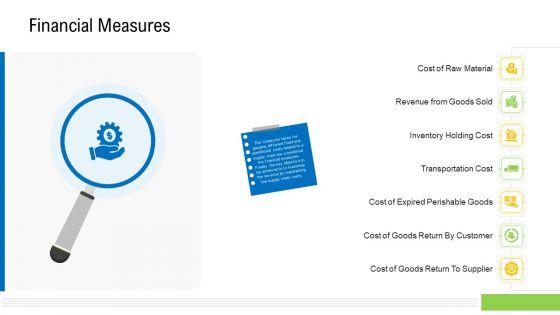
This is a scm and purchasing financial measure ppt portfolio example topics pdf template with various stages. Focus and dispense information on seven stages using this creative set, that comes with editable features. It contains large content boxes to add your information on topics like inventory, revenue, material, transportation . You can also showcase facts, figures, and other relevant content using this PPT layout. Grab it now.

Deliver an awe inspiring pitch with this creative viable logistics network management non financial measures introduction pdf bundle. Topics like non financial measures can be discussed with this completely editable template. It is available for immediate download depending on the needs and requirements of the user.

Presenting viable logistics network management master production planning option 2 of demand brochure pdf to provide visual cues and insights. Share and navigate important information on five stages that need your due attention. This template can be used to pitch topics like master production planning. In addtion, this PPT design contains high resolution images, graphics, etc, that are easily editable and available for immediate download.

This is a viable logistics network management master production planning option 2 of demand brochure pdf template with various stages. Focus and dispense information on four stages using this creative set, that comes with editable features. It contains large content boxes to add your information on topics like master production planning. You can also showcase facts, figures, and other relevant content using this PPT layout. Grab it now.

This is a viable logistics network management eoq cost model structure pdf template with various stages. Focus and dispense information on seven stages using this creative set, that comes with editable features. It contains large content boxes to add your information on topics like eoq cost model. You can also showcase facts, figures, and other relevant content using this PPT layout. Grab it now.

Deliver an awe inspiring pitch with this creative commercial property administration and advancement real estate financial performance measurement slides pdf bundle. Topics like performance parameter, capitalization, return on investment, cash on cash return can be discussed with this completely editable template. It is available for immediate download depending on the needs and requirements of the user.


This is a scm growth non financial measures resources ppt portfolio mockup pdf template with various stages. Focus and dispense information on five stages using this creative set, that comes with editable features. It contains large content boxes to add your information on topics like manufacturing resources, storage resources, logistic resources, human resources, financial resources. You can also showcase facts, figures, and other relevant content using this PPT layout. Grab it now.
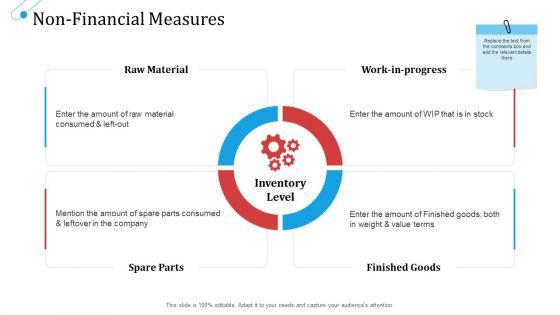

Presenting scm growth non financial measures material ppt ideas smartart pdf to provide visual cues and insights. Share and navigate important information on four stages that need your due attention. This template can be used to pitch topics like raw material, work in progress, spare parts, finished goods. In addtion, this PPT design contains high resolution images, graphics, etc, that are easily editable and available for immediate download.


This is a scm growth financial measures ppt outline visuals pdf template with various stages. Focus and dispense information on seven stages using this creative set, that comes with editable features. It contains large content boxes to add your information on topics like cost of raw material, revenue from goods sold, inventory holding cost, transportation cost, cost of expired perishable goods. You can also showcase facts, figures, and other relevant content using this PPT layout. Grab it now.
SHOW
- 60
- 120
- 180
DISPLAYING: 60 of 122 Item(s)
Page