AI PPT Maker
Templates
PPT Bundles
Design Services
Business PPTs
Business Plan
Management
Strategy
Introduction PPT
Roadmap
Self Introduction
Timelines
Process
Marketing
Agenda
Technology
Medical
Startup Business Plan
Cyber Security
Dashboards
SWOT
Proposals
Education
Pitch Deck
Digital Marketing
KPIs
Project Management
Product Management
Artificial Intelligence
Target Market
Communication
Supply Chain
Google Slides
Research Services
 One Pagers
All Categories
Monitoring Data PowerPoint Presentation Templates and Google Slides
15 Item(s)



Slide 1 of 7
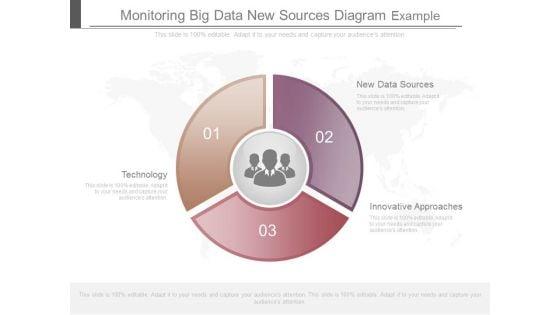
This is a monitoring big data new sources diagram example. This is a three stage process. The stages in this process are technology, innovative approaches, new data sources.
Slide 1 of 5
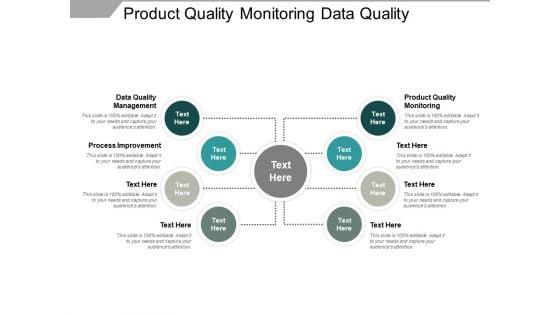
This is a product quality monitoring data quality management process improvement ppt powerpoint presentation show file formats. This is a eight stage process. The stages in this process are product quality monitoring, data quality management, process improvement.
Slide 1 of 2
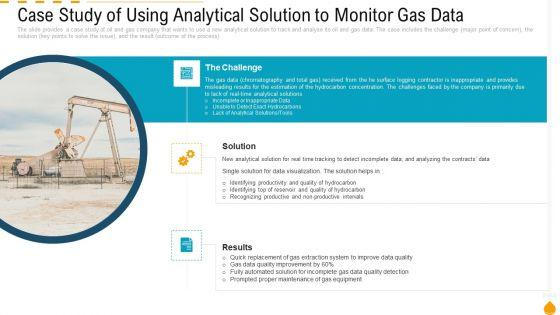
Deliver an awe inspiring pitch with this creative case study of using analytical solution to monitor gas data brochure pdf bundle. Topics like identifying productivity and quality of hydrocarbon, identifying top of reservoir and quality of hydrocarbon, recognizing productive and non productive intervals can be discussed with this completely editable template. It is available for immediate download depending on the needs and requirements of the user.


Slide 1 of 2
The slide provides a case study of oil and gas company that wants to use a new analytical solution to track and analyse its oil and gas data. The case includes the challenge major point of concern, the solution key points to solve the issue, and the result outcome of the process.Presenting case study of using analytical solution to monitor gas data clipart pdf. to provide visual cues and insights. Share and navigate important information on two stages that need your due attention. This template can be used to pitch topics like solution results, gas data quality improvement by 60 present. In addtion, this PPT design contains high resolution images, graphics, etc, that are easily editable and available for immediate download.
Slide 1 of 2
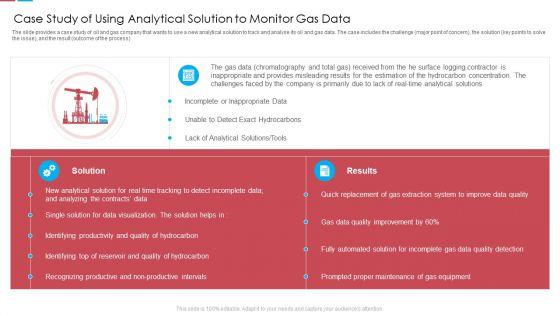
The slide provides a case study of oil and gas company that wants to use a new analytical solution to track and analyse its oil and gas data. The case includes the challenge major point of concern, the solution key points to solve the issue, and the result outcome of the process. Deliver an awe inspiring pitch with this creative case study of using analytical solution to monitor gas data ppt show gridlines pdf bundle. Topics like solution, results, case study of using analytical solution to monitor gas data can be discussed with this completely editable template. It is available for immediate download depending on the needs and requirements of the user.

Slide 1 of 2
The slide provides a case study of oil and gas company that wants to use a new analytical solution to track and analyse its oil and gas data. The case includes the challenge major point of concern, the solution key points to solve the issue, and the result outcome of the process. Deliver an awe inspiring pitch with this creative case competition petroleum sector issues case study of using analytical solution to monitor gas data slides pdf bundle. Topics like productivity and quality of hydrocarbon, quality of hydrocarbon, extraction system to improve data quality, prompted proper maintenance of gas equipment can be discussed with this completely editable template. It is available for immediate download depending on the needs and requirements of the user.
Slide 1 of 2
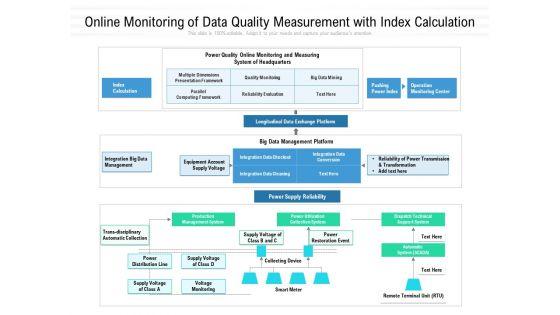
Presenting online monitoring of data quality measurement with index calculation ppt powerpoint presentation inspiration graphics template pdf to dispense important information. This template comprises one stages. It also presents valuable insights into the topics including quality monitoring, reliability evaluation, big data mining, pushing power index, index calculation, multiple dimensions presentation framework. This is a completely customizable PowerPoint theme that can be put to use immediately. So, download it and address the topic impactfully.


Slide 1 of 9
This slide displays various dentations for measuring quality of data procured by business entities. It includes elements such as accuracy, completeness, reasonability, uniqueness, etc. Presenting Elements To Track And Monitor Data Quality Clipart PDF to dispense important information. This template comprises seven stages. It also presents valuable insights into the topics including Accuracy, Completeness, Consistency, Reasonability, Timeliness, Uniqueness, Validity. This is a completely customizable PowerPoint theme that can be put to use immediately. So, download it and address the topic impactfully.
Slide 1 of 1
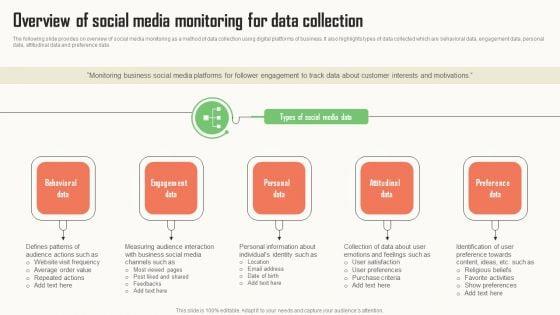
The following slide provides on overview of social media monitoring as a method of data collection using digital platforms of business. It also highlights types of data collected which are behavioral data, engagement data, personal data, attitudinal data and preference data. Boost your pitch with our creative Strategic Market Insight Implementation Guide Overview Of Social Media Monitoring For Data Collection Microsoft PDF. Deliver an awe-inspiring pitch that will mesmerize everyone. Using these presentation templates you will surely catch everyones attention. You can browse the ppts collection on our website. We have researchers who are experts at creating the right content for the templates. So you do not have to invest time in any additional work. Just grab the template now and use them.


Slide 1 of 9
Are you searching for a Data Center Infrastructure Management And Monitoring Data Center It Ppt File Design that is uncluttered, straightforward, and original Its easy to edit, and you can change the colors to suit your personal or business branding. For a presentation that expresses how much effort you have put in, this template is ideal With all of its features, including tables, diagrams, statistics, and lists, its perfect for a business plan presentation. Make your ideas more appealing with these professional slides. Download Data Center Infrastructure Management And Monitoring Data Center It Ppt File Design from Slidegeeks today. This slide explains how we manage and monitor data center infrastructure, focusing on key areas such as asset management, environmental and power monitoring, change management, and capacity management. It highlights our approach to keeping everything running smoothly and efficiently.


Slide 1 of 10
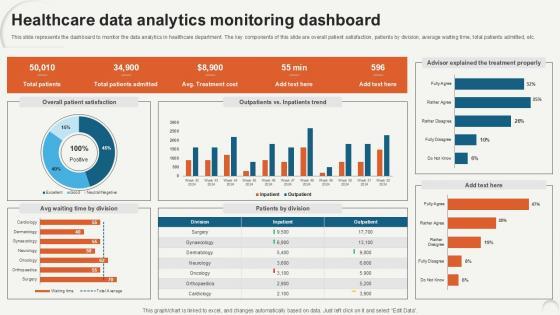
This slide represents the dashboard to monitor the data analytics in healthcare department. The key components of this slide are overall patient satisfaction, patients by division, average waiting time, total patients admitted, etc. Make sure to capture your audiences attention in your business displays with our gratis customizable Healthcare Data Analytics Monitoring Data Analytics For Informed Decision Ppt PowerPoint. These are great for business strategies, office conferences, capital raising or task suggestions. If you desire to acquire more customers for your tech business and ensure they stay satisfied, create your own sales presentation with these plain slides. This slide represents the dashboard to monitor the data analytics in healthcare department. The key components of this slide are overall patient satisfaction, patients by division, average waiting time, total patients admitted, etc.


Slide 1 of 10
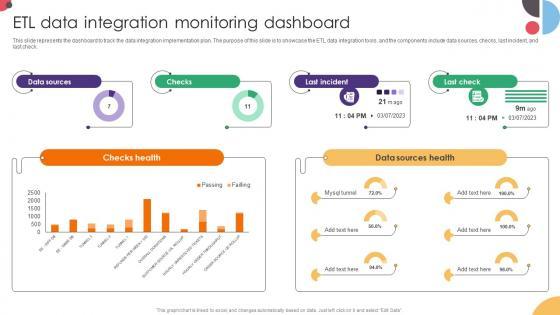
This slide represents the dashboard to track the data integration implementation plan. The purpose of this slide is to showcase the ETL data integration tools, and the components include data sources, checks, last incident, and last check. Are you searching for a ETL Data Integration Monitoring Dashboard Data Integration Strategies For Business that is uncluttered, straightforward, and original Its easy to edit, and you can change the colors to suit your personal or business branding. For a presentation that expresses how much effort you have put in, this template is ideal With all of its features, including tables, diagrams, statistics, and lists, its perfect for a business plan presentation. Make your ideas more appealing with these professional slides. Download ETL Data Integration Monitoring Dashboard Data Integration Strategies For Business from Slidegeeks today. This slide represents the dashboard to track the data integration implementation plan. The purpose of this slide is to showcase the ETL data integration tools, and the components include data sources, checks, last incident, and last check.


Slide 1 of 9
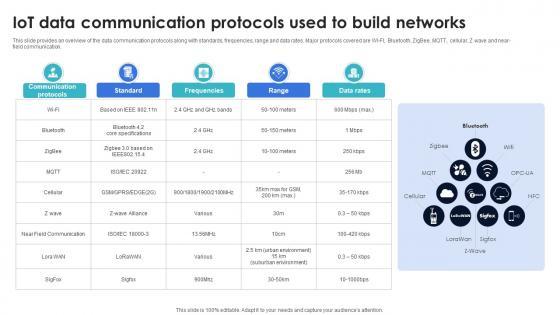
This slide provides an overview of the data communication protocols along with standards, frequencies, range and data rates. Major protocols covered are WI-FI, Bluetooth, ZigBee, MQTT, cellular, Z wave and near- field communication. Create an editable Optimization Of IoT Remote Monitoring IoT Data Communication Protocols Used To Build Networks IoT SS V that communicates your idea and engages your audience. Whether you are presenting a business or an educational presentation, pre-designed presentation templates help save time. Optimization Of IoT Remote Monitoring IoT Data Communication Protocols Used To Build Networks IoT SS V is highly customizable and very easy to edit, covering many different styles from creative to business presentations. Slidegeeks has creative team members who have crafted amazing templates. So, go and get them without any delay. This slide provides an overview of the data communication protocols along with standards, frequencies, range and data rates. Major protocols covered are WI-FI, Bluetooth, ZigBee, MQTT, cellular, Z wave and near- field communication.


Slide 1 of 9
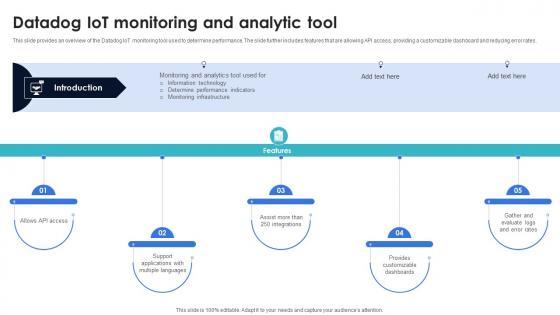
This slide provides an overview of the Datadog IoT monitoring tool used to determine performance. The slide further includes features that are allowing API access, providing a customizable dashboard and reducing error rates. Formulating a presentation can take up a lot of effort and time, so the content and message should always be the primary focus. The visuals of the PowerPoint can enhance the presenters message, so our Optimization Of IoT Remote Monitoring Datadog IoT Monitoring And Analytic Tool IoT SS V was created to help save time. Instead of worrying about the design, the presenter can concentrate on the message while our designers work on creating the ideal templates for whatever situation is needed. Slidegeeks has experts for everything from amazing designs to valuable content, we have put everything into Optimization Of IoT Remote Monitoring Datadog IoT Monitoring And Analytic Tool IoT SS V. This slide provides an overview of the Datadog IoT monitoring tool used to determine performance. The slide further includes features that are allowing API access, providing a customizable dashboard and reducing error rates.


Slide 1 of 9
Showcasing this set of slides titled Icon For Monitoring Big Data Impact On Digital Marketing Brochure Pdf. The topics addressed in these templates are Monitoring Big, Data Impact, Digital Marketing. All the content presented in this PPT design is completely editable. Download it and make adjustments in color, background, font etc. as per your unique business setting. Our Icon For Monitoring Big Data Impact On Digital Marketing Brochure Pdf are topically designed to provide an attractive backdrop to any subject. Use them to look like a presentation pro.
15 Item(s)
