AI PPT Maker
Templates
PPT Bundles
Design Services
Business PPTs
Business Plan
Management
Strategy
Introduction PPT
Roadmap
Self Introduction
Timelines
Process
Marketing
Agenda
Technology
Medical
Startup Business Plan
Cyber Security
Dashboards
SWOT
Proposals
Education
Pitch Deck
Digital Marketing
KPIs
Project Management
Product Management
Artificial Intelligence
Target Market
Communication
Supply Chain
Google Slides
Research Services
 One Pagers
All Categories
Monitoring Kpi Dashboard PowerPoint Presentation Templates and Google Slides
14 Item(s)

Slide 1 of 2
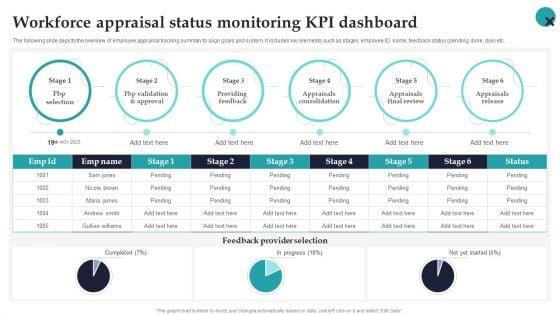
The following slide covers the management by objective MBO methodology to assess employee performance. It includes key elements such as details, advantages, disadvantages, best fit for etc. along with process workflow.Get a simple yet stunning designed Workforce Appraisal Status Monitoring Kpi Dashboard Employee Performance Management Rules PDF. It is the best one to establish the tone in your meetings. It is an excellent way to make your presentations highly effective. So, download this PPT today from Slidegeeks and see the positive impacts. Our easy-to-edit Workforce Appraisal Status Monitoring Kpi Dashboard Employee Performance Management Rules PDF can be your go-to option for all upcoming conferences and meetings. So, what are you waiting for Grab this template today.

Slide 1 of 2
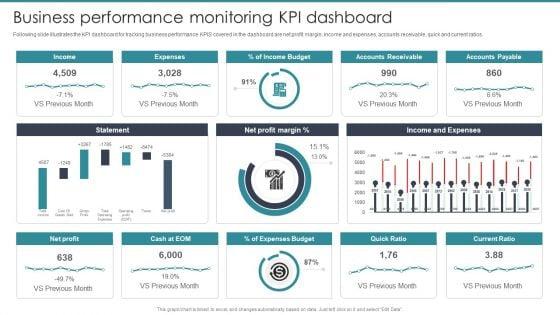
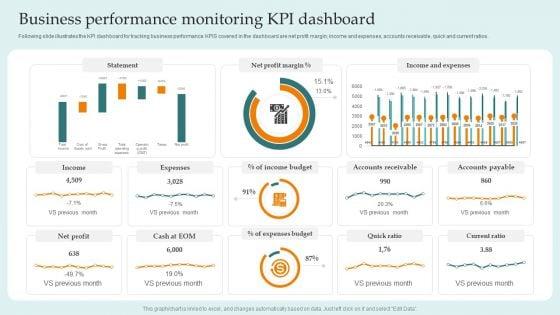
Following slide illustrates the KPI dashboard for tracking business performance. KPIS covered in the dashboard are net profit margin, income and expenses, accounts receivable, quick and current ratios. Here you can discover an assortment of the finest PowerPoint and Google Slides templates. With these templates, you can create presentations for a variety of purposes while simultaneously providing your audience with an eye catching visual experience. Download Guide To Mergers And Acquisitions Business Performance Monitoring KPI Dashboard Designs PDF to deliver an impeccable presentation. These templates will make your job of preparing presentations much quicker, yet still, maintain a high level of quality. Slidegeeks has experienced researchers who prepare these templates and write high quality content for you. Later on, you can personalize the content by editing the Guide To Mergers And Acquisitions Business Performance Monitoring KPI Dashboard Designs PDF.
Slide 1 of 2
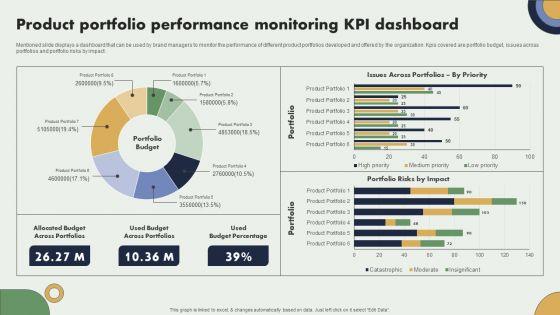
Mentioned slide displays a dashboard that can be used by brand managers to monitor the performance of different product portfolios developed and offered by the organization. Kpis covered are portfolio budget, issues across portfolios and portfolio risks by impact.Take your projects to the next level with our ultimate collection of Product Portfolio Performance Monitoring Kpi Dashboard Brand Expansion Plan Slides PDF. Slidegeeks has designed a range of layouts that are perfect for representing task or activity duration, keeping track of all your deadlines at a glance. Tailor these designs to your exact needs and give them a truly corporate look with your own brand colors they all make your projects stand out from the rest.
Slide 1 of 2
Business Performance Monitoring Kpi Dashboard Guide For Successful Merger And Acquisition Mockup PDF
Coming up with a presentation necessitates that the majority of the effort goes into the content and the message you intend to convey. The visuals of a PowerPoint presentation can only be effective if it supplements and supports the story that is being told. Keeping this in mind our experts created Business Performance Monitoring Kpi Dashboard Guide For Successful Merger And Acquisition Mockup PDF to reduce the time that goes into designing the presentation. This way, you can concentrate on the message while our designers take care of providing you with the right template for the situation.
Slide 1 of 2
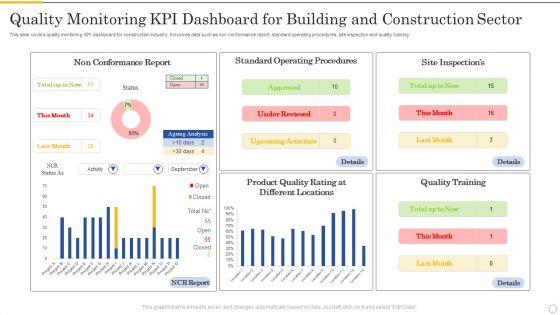
This slide covers quality monitoring KPI dashboard for construction industry. It involves data such as non conformance report, standard operating procedures, site inspection and quality training. Showcasing this set of slides titled Quality Monitoring Kpi Dashboard For Building And Construction Sector Portrait PDF. The topics addressed in these templates are Non Conformance Report, Standard Operating, Procedures. All the content presented in this PPT design is completely editable. Download it and make adjustments in color, background, font etc. as per your unique business setting.
Slide 1 of 2
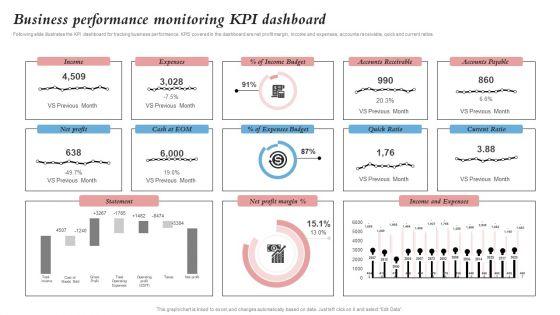
Business Performance Monitoring Kpi Dashboard Merger And Integration Procedure Playbook Brochure PDF
Following slide illustrates the KPI dashboard for tracking business performance. KPIS covered in the dashboard are net profit margin, income and expenses, accounts receivable, quick and current ratios.Deliver an awe inspiring pitch with this creative Business Performance Monitoring Kpi Dashboard Merger And Integration Procedure Playbook Brochure PDF bundle. Topics like Expenses Budget, Income Budget, Accounts Receivable can be discussed with this completely editable template. It is available for immediate download depending on the needs and requirements of the user.
Slide 1 of 2
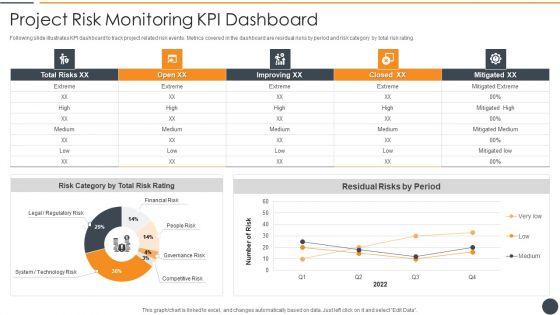
Following slide illustrates KPI dashboard to track project related risk events. Metrics covered in the dashboard are residual risks by period and risk category by total risk rating. Deliver and pitch your topic in the best possible manner with this effective initiation of information technology project project risk monitoring kpi dashboard microsoft pdf. Use them to share invaluable insights on mitigated extreme, residual risks by period, risk category by total risk rating and impress your audience. This template can be altered and modified as per your expectations. So, grab it now.


Slide 1 of 2
Following slide illustrates KPI dashboard to track project related risk events. Metrics covered in the dashboard are residual risks by period and risk category by total risk rating. Deliver and pitch your topic in the best possible manner with this information technology project initiation project risk monitoring kpi dashboard background pdf. Use them to share invaluable insights on project risk monitoring kpi dashboard and impress your audience. This template can be altered and modified as per your expectations. So, grab it now.


Slide 1 of 10
This slide exhibits monthly performance of oil and gas production to track wellhead uptime and overall efficiency. It includes various elements such as production efficiency, well uptime, gas production rate, oil production rate, top performing gas producing wells, etc. Take your projects to the next level with our ultimate collection of IoT Solutions For Oil Oil And Gas Production Monitoring KPI Dashboard IoT SS V. Slidegeeks has designed a range of layouts that are perfect for representing task or activity duration, keeping track of all your deadlines at a glance. Tailor these designs to your exact needs and give them a truly corporate look with your own brand colors they will make your projects stand out from the rest This slide exhibits monthly performance of oil and gas production to track wellhead uptime and overall efficiency. It includes various elements such as production efficiency, well uptime, gas production rate, oil production rate, top performing gas producing wells, etc.


Slide 1 of 10
This slide presents a well monitoring dashboard used by oil and gas engineers to track well performance safety and ensure compliance with regulations. It includes elements such as total wells, carbon gas emission, cost per barrel well integrity index, etc. This modern and well-arranged IoT Solutions For Oil IoT Based Oil And Gas Well Monitoring KPI Dashboard IoT SS V provides lots of creative possibilities. It is very simple to customize and edit with the Powerpoint Software. Just drag and drop your pictures into the shapes. All facets of this template can be edited with Powerpoint, no extra software is necessary. Add your own material, put your images in the places assigned for them, adjust the colors, and then you can show your slides to the world, with an animated slide included. This slide presents a well monitoring dashboard used by oil and gas engineers to track well performance safety and ensure compliance with regulations. It includes elements such as total wells, carbon gas emission, cost per barrel well integrity index, etc.


Slide 1 of 10
This slide presents a waste monitoring dashboard helpful in optimising recycling rate of waste produced. It includes elements such as recycled year to date, sent for recycling, not recyclable, savings returned, recycled year to date by category, etc. From laying roadmaps to briefing everything in detail, our templates are perfect for you. You can set the stage with your presentation slides. All you have to do is download these easy-to-edit and customizable templates. Waste Collection And Recycling Monitoring Kpi Dashboard Implementation Of E Waste Guidelines will help you deliver an outstanding performance that everyone would remember and praise you for. Do download this presentation today. This slide presents a waste monitoring dashboard helpful in optimising recycling rate of waste produced. It includes elements such as recycled year to date, sent for recycling, not recyclable, savings returned, recycled year to date by category, etc.


Slide 1 of 10
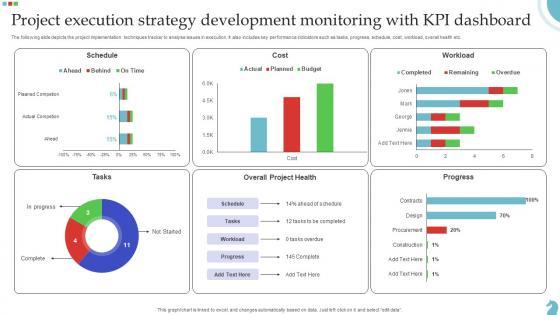
The following slide depicts the project implementation techniques tracker to analyse issues in execution. It also includes key performance indicators such as tasks, progress, schedule, cost, workload, overall health etc. Pitch your topic with ease and precision using this Project Execution Strategy Development Monitoring With Kpi Dashboard Download Pdf. This layout presents information on Project Execution, Strategy Development, Monitoring Kpi Dashboard. It is also available for immediate download and adjustment. So, changes can be made in the color, design, graphics or any other component to create a unique layout. The following slide depicts the project implementation techniques tracker to analyse issues in execution. It also includes key performance indicators such as tasks, progress, schedule, cost, workload, overall health etc.


Slide 1 of 10
The following slide depicts the overview of employee appraisal tracking summary to align goals and system. It includes key elements such as stages, employee ID, name, feedback status pending, done, due etc. There are so many reasons you need a Workforce Appraisal Status Monitoring Kpi Dashboard Executing Successful Staff Performance Graphics Pdf. The first reason is you can not spend time making everything from scratch, Thus, Slidegeeks has made presentation templates for you too. You can easily download these templates from our website easily. The following slide depicts the overview of employee appraisal tracking summary to align goals and system. It includes key elements such as stages, employee ID, name, feedback status pending, done, due etc.

Slide 1 of 2
The following slide depicts the overview of employee appraisal tracking summary to align goals and system. It includes key elements such as stages, employee ID, name, feedback status pending, done, due etc. Slidegeeks is here to make your presentations a breeze with Workforce Appraisal Status Monitoring Kpi Dashboard Template PDF With our easy to use and customizable templates, you can focus on delivering your ideas rather than worrying about formatting. With a variety of designs to choose from, you are sure to find one that suits your needs. And with animations and unique photos, illustrations, and fonts, you can make your presentation pop. So whether you are giving a sales pitch or presenting to the board, make sure to check out Slidegeeks first.
14 Item(s)
