 AI PPT Maker
 Templates
 PPT Bundles
 Design Services
 Business PPTs
 Business Plan
 Management
 Strategy
 Introduction PPT
 Roadmap
 Self Introduction
 Timelines
 Process
 Marketing
 Agenda
 Technology
 Medical
 Startup Business Plan
 Cyber Security
 Dashboards
 SWOT
SWOT Proposals
 Education
 Pitch Deck
 Digital Marketing
 KPIs
KPIs Project Management
 Product Management
 Artificial Intelligence
 Target Market
 Communication
 Supply Chain
 Google Slides
 Research Services
 One Pagers
 All Categories
Net Operating PowerPoint Presentation Templates and Google Slides
7 Item(s)

Presenting this set of slides with name net operating loss ppt powerpoint presentation pictures layout cpb pdf. This is an editable Powerpoint four stages graphic that deals with topics like net operating loss to help convey your message better graphically. This product is a premium product available for immediate download and is 100 percent editable in Powerpoint. Download this now and use it in your presentations to impress your audience.


Presenting this set of slides with name net operating working capital formula ppt powerpoint presentation inspiration demonstration cpb. This is an editable Powerpoint three stages graphic that deals with topics like net operating working capital formula to help convey your message better graphically. This product is a premium product available for immediate download and is 100 percent editable in Powerpoint. Download this now and use it in your presentations to impress your audience.

Presenting this set of slides with name net investment operating capital ppt powerpoint presentation slides infographics cpb. This is an editable Powerpoint six stages graphic that deals with topics like net investment operating capital to help convey your message better graphically. This product is a premium product available for immediate download and is 100 percent editable in Powerpoint. Download this now and use it in your presentations to impress your audience.


This slide represents net operating revenue spilt by geographical region Europe, Middle East, Africa, Latina America, North America and Asia Pacific. Crafting an eye-catching presentation has never been more straightforward. Let your presentation shine with this tasteful yet straightforward Net Operating Revenue Spilt By Liquid Refreshment Manufacturer Company Profile Ppt Example CP SS V template. It offers a minimalistic and classy look that is great for making a statement. The colors have been employed intelligently to add a bit of playfulness while still remaining professional. Construct the ideal Net Operating Revenue Spilt By Liquid Refreshment Manufacturer Company Profile Ppt Example CP SS V that effortlessly grabs the attention of your audience Begin now and be certain to wow your customers This slide represents net operating revenue spilt by geographical region Europe, Middle East, Africa, Latina America, North America and Asia Pacific.
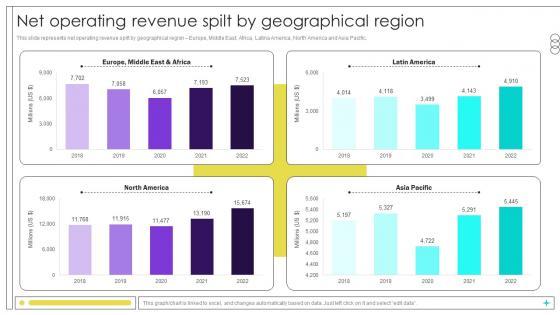
This slide represents net operating revenue spilt by geographical region Europe, Middle East, Africa, Latina America, North America and Asia Pacific. Are you in need of a template that can accommodate all of your creative concepts This one is crafted professionally and can be altered to fit any style. Use it with Google Slides or PowerPoint. Include striking photographs, symbols, depictions, and other visuals. Fill, move around, or remove text boxes as desired. Test out color palettes and font mixtures. Edit and save your work, or work with colleagues. Download Net Operating Revenue Spilt By Geographical Region Beverage Manufacturer Company Profile Ppt Template CP SS V and observe how to make your presentation outstanding. Give an impeccable presentation to your group and make your presentation unforgettable. This slide represents net operating revenue spilt by geographical region Europe, Middle East, Africa, Latina America, North America and Asia Pacific.
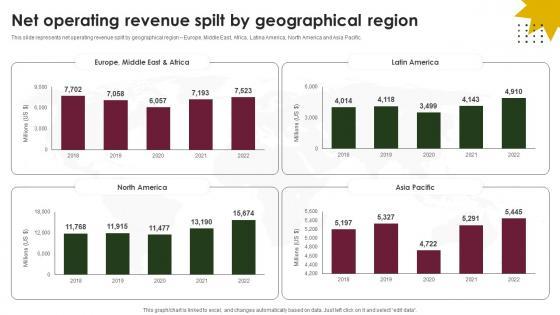

This slide represents net operating revenue spilt by geographical region Europe, Middle East, Africa, Latina America, North America and Asia Pacific.If your project calls for a presentation, then Slidegeeks is your go-to partner because we have professionally designed, easy-to-edit templates that are perfect for any presentation. After downloading, you can easily edit Net Operating Revenue Spilt By Geographical Region Beverage Company Profile CP SS V and make the changes accordingly. You can rearrange slides or fill them with different images. Check out all the handy templates This slide represents net operating revenue spilt by geographical region Europe, Middle East, Africa, Latina America, North America and Asia Pacific.
7 Item(s)