AI PPT Maker
Templates
PPT Bundles
Design Services
Business PPTs
Business Plan
Management
Strategy
Introduction PPT
Roadmap
Self Introduction
Timelines
Process
Marketing
Agenda
Technology
Medical
Startup Business Plan
Cyber Security
Dashboards
SWOT
Proposals
Education
Pitch Deck
Digital Marketing
KPIs
Project Management
Product Management
Artificial Intelligence
Target Market
Communication
Supply Chain
Google Slides
Research Services
 One Pagers
All Categories
Net revenues PowerPoint Presentation Templates and Google Slides
SHOW
- 60
- 120
- 180
DISPLAYING: 60 of 95 Item(s)
Page
Slide 1 of 6
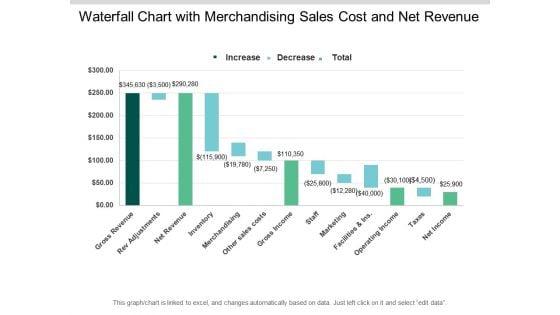
This is a waterfall chart with merchandising sales cost and net revenue ppt powerpoint presentation summary show. This is a three stage process. The stages in this process are sales waterfall, waterfall chart, business.
Slide 1 of 2
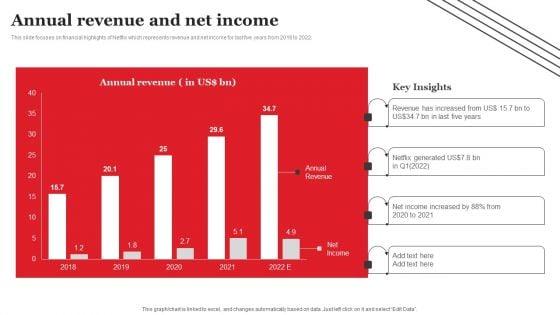
This slide focuses on financial highlights of Netflix which represents revenue and net income for last five years from 2018 to 2022. Here you can discover an assortment of the finest PowerPoint and Google Slides templates. With these templates, you can create presentations for a variety of purposes while simultaneously providing your audience with an eye catching visual experience. Download Streaming Platform Company Outline Annual Revenue And Net Income Slides PDF to deliver an impeccable presentation. These templates will make your job of preparing presentations much quicker, yet still, maintain a high level of quality. Slidegeeks has experienced researchers who prepare these templates and write high quality content for you. Later on, you can personalize the content by editing the Streaming Platform Company Outline Annual Revenue And Net Income Slides PDF.
Slide 1 of 2
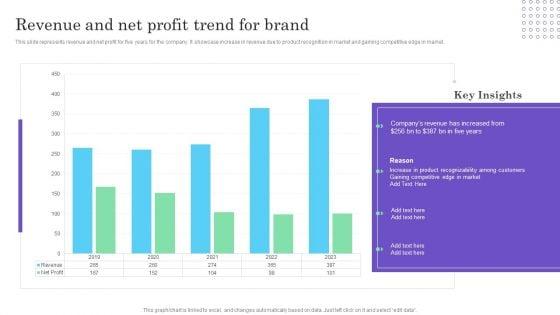
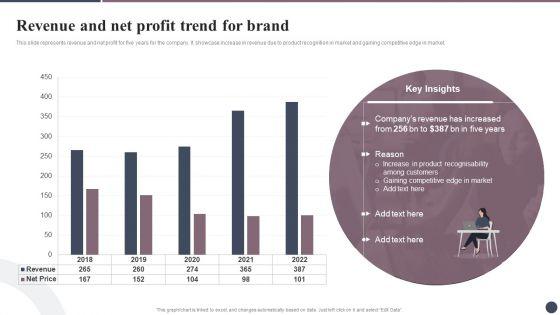
This slide represents revenue and net profit for five years for the company. It showcase increase in revenue due to product recognition in market and gaining competitive edge in market. Make sure to capture your audiences attention in your business displays with our gratis customizable Cultural Branding Marketing Strategy To Increase Lead Generation Revenue And Net Profit Trend For Brand Inspiration PDF. These are great for business strategies, office conferences, capital raising or task suggestions. If you desire to acquire more customers for your tech business and ensure they stay satisfied, create your own sales presentation with these plain slides.
Slide 1 of 2
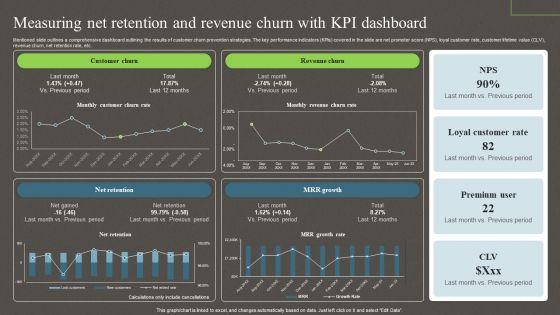
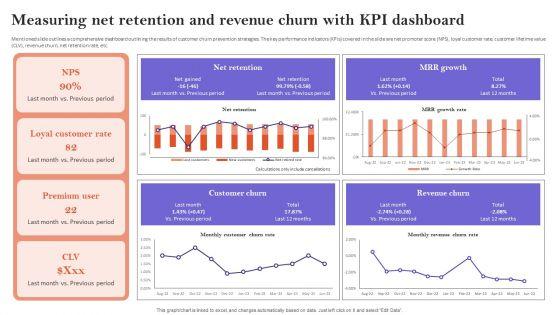
Mentioned slide outlines a comprehensive dashboard outlining the results of customer churn prevention strategies. The key performance indicators KPIs covered in the slide are net promoter score NPS, loyal customer rate, customer lifetime value CLV, revenue churn, net retention rate, etc. Boost your pitch with our creative Measuring Net Retention And Revenue Churn With Kpi Dashboard Ppt PowerPoint Presentation File Backgrounds PDF. Deliver an awe inspiring pitch that will mesmerize everyone. Using these presentation templates you will surely catch everyones attention. You can browse the ppts collection on our website. We have researchers who are experts at creating the right content for the templates. So you do not have to invest time in any additional work. Just grab the template now and use them.

Slide 1 of 2
This slide focuses on financial highlights of Web design company which represents revenue and net profit for last five years from 2018 to 2022. There are so many reasons you need a Website Design And Development Services Company Profile Revenue And Net Profit Analysis Formats PDF. The first reason is you can not spend time making everything from scratch, Thus, Slidegeeks has made presentation templates for you too. You can easily download these templates from our website easily.


Slide 1 of 2
This slide represents revenue and net profit for five years for the company. It showcase increase in revenue due to product recognition in market and gaining competitive edge in market. If your project calls for a presentation, then Slidegeeks is your go to partner because we have professionally designed, easy to edit templates that are perfect for any presentation. After downloading, you can easily edit Developing Brand Identity Culture Through Branding Revenue And Net Profit Trend For Brand Brochure PDF and make the changes accordingly. You can rearrange slides or fill them with different images. Check out all the handy templates
Slide 1 of 2
Mentioned slide outlines a comprehensive dashboard outlining the results of customer churn prevention strategies. The key performance indicators KPIs covered in the slide are net promoter score NPS, loyal customer rate, customer lifetime value CLV, revenue churn, net retention rate, etc. The Measuring Net Retention And Revenue Churn With Kpi Dashboard Ideas PDF is a compilation of the most recent design trends as a series of slides. It is suitable for any subject or industry presentation, containing attractive visuals and photo spots for businesses to clearly express their messages. This template contains a variety of slides for the user to input data, such as structures to contrast two elements, bullet points, and slides for written information. Slidegeeks is prepared to create an impression.
Slide 1 of 2
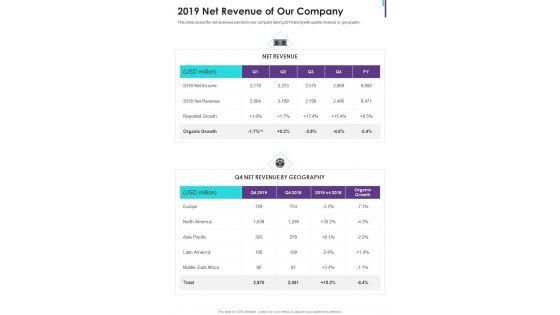
This slide covers the net revenues earned by our company during 2019 along with quarter revenue by geography. Presenting you an exemplary 2019 Net Revenue Of Our Company One Pager Documents. Our one-pager comprises all the must-have essentials of an inclusive document. You can edit it with ease, as its layout is completely editable. With such freedom, you can tweak its design and other elements to your requirements. Download this 2019 Net Revenue Of Our Company One Pager Documents brilliant piece now.


Slide 1 of 2
This slide shows the Total Revenues and Net Income of ABC Corporation for five years in Million dollar Coming up with a presentation necessitates that the majority of the effort goes into the content and the message you intend to convey. The visuals of a PowerPoint presentation can only be effective if it supplements and supports the story that is being told. Keeping this in mind our experts created Financial Reporting To Analyze Total Revenues And Net Income For Five Years Guidelines PDF to reduce the time that goes into designing the presentation. This way, you can concentrate on the message while our designers take care of providing you with the right template for the situation.

Slide 1 of 2
This slide represents the business model of film production company which covers key partners, activities, value proposition, customer relationships, key resources, channels, cost structure, revenue streams, etc.Want to ace your presentation in front of a live audience Our Revenue And Net Profits Movie Editing Company Outline Infographics PDF can help you do that by engaging all the users towards you. Slidegeeks experts have put their efforts and expertise into creating these impeccable powerpoint presentations so that you can communicate your ideas clearly. Moreover, all the templates are customizable, and easy-to-edit and downloadable. Use these for both personal and commercial use.
Slide 1 of 2
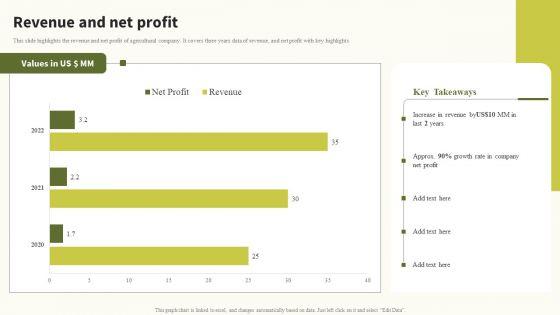
This slide highlights the revenue and net profit of agricultural company. It covers three years data of revenue, and net profit with key highlights. Present like a pro with Revenue And Net Profit Global Food Products Company Profile Information PDF Create beautiful presentations together with your team, using our easy-to-use presentation slides. Share your ideas in real-time and make changes on the fly by downloading our templates. So whether you are in the office, on the go, or in a remote location, you can stay in sync with your team and present your ideas with confidence. With Slidegeeks presentation got a whole lot easier. Grab these presentations today.
Slide 1 of 2
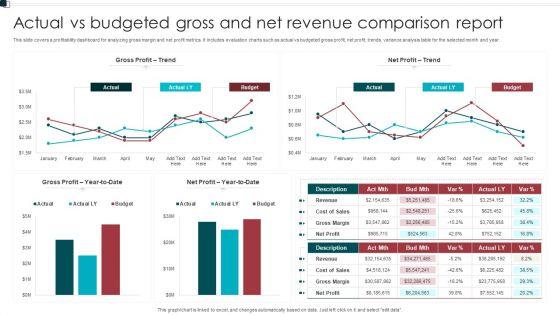
This slide covers a profitability dashboard for analyzing gross margin and net profit metrics. It includes evaluation charts such as actual vs budgeted gross profit, net profit, trends, variance analysis table for the selected month and year. Pitch your topic with ease and precision using this Actual Vs Budgeted Gross And Net Revenue Comparison Report Sample PDF. This layout presents information on Gross Profit, Net Profit, Budget. It is also available for immediate download and adjustment. So, changes can be made in the color, design, graphics or any other component to create a unique layout.
Slide 1 of 2
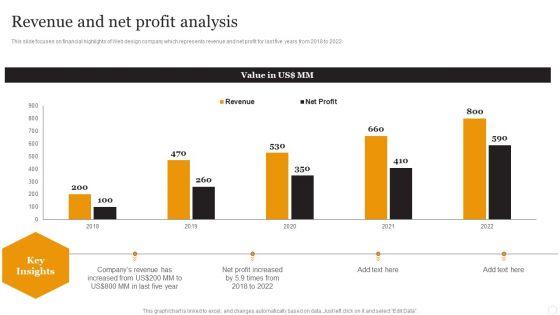
This slide focuses on financial highlights of Web design company which represents revenue and net profit for last five years from 2018 to 2022. Here you can discover an assortment of the finest PowerPoint and Google Slides templates. With these templates, you can create presentations for a variety of purposes while simultaneously providing your audience with an eye-catching visual experience. Download Website Designing Solutions Company Profile Revenue And Net Profit Analysis Background PDF to deliver an impeccable presentation. These templates will make your job of preparing presentations much quicker, yet still, maintain a high level of quality. Slidegeeks has experienced researchers who prepare these templates and write high-quality content for you. Later on, you can personalize the content by editing the Website Designing Solutions Company Profile Revenue And Net Profit Analysis Background PDF.

Slide 1 of 2
If you are looking for a format to display your unique thoughts, then the professionally designed Revenue And Net Profit Trend For Brand Adopting Culture Branding Strategy Portrait PDF is the one for you. You can use it as a Google Slides template or a PowerPoint template. Incorporate impressive visuals, symbols, images, and other charts. Modify or reorganize the text boxes as you desire. Experiment with shade schemes and font pairings. Alter, share or cooperate with other people on your work. Download Revenue And Net Profit Trend For Brand Adopting Culture Branding Strategy Portrait PDF and find out how to give a successful presentation. Present a perfect display to your team and make your presentation unforgettable.

Slide 1 of 2
This slide focuses on financial highlights of Web design company which represents revenue and net profit for last five years from 2018 to 2022 Explore a selection of the finest Revenue And Net Profit Analysis Web Design And Development Company Profile Ideas PDF here. With a plethora of professionally designed and pre made slide templates, you can quickly and easily find the right one for your upcoming presentation. You can use our Revenue And Net Profit Analysis Web Design And Development Company Profile Ideas PDF to effectively convey your message to a wider audience. Slidegeeks has done a lot of research before preparing these presentation templates. The content can be personalized and the slides are highly editable. Grab templates today from Slidegeeks.


Slide 1 of 2
This slide shows the Total Revenues and Net Income of ABC Corporation for five years In Million dollar Do you have an important presentation coming up Are you looking for something that will make your presentation stand out from the rest Look no further than Financial Data Revelation To Varied Stakeholders Total Revenues And Net Income For Five Years Brochure PDF. With our professional designs, you can trust that your presentation will pop and make delivering it a smooth process. And with Slidegeeks, you can trust that your presentation will be unique and memorable. So why wait Grab Financial Data Revelation To Varied Stakeholders Total Revenues And Net Income For Five Years Brochure PDF today and make your presentation stand out from the rest.

Slide 1 of 2
This slide focuses on financial highlights of Web design company which represents revenue and net profit for last five years from 2019 to 2023. The Web Interface Development Services Company Summary Revenue And Net Profit Analysis Slides PDF is a compilation of the most recent design trends as a series of slides. It is suitable for any subject or industry presentation, containing attractive visuals and photo spots for businesses to clearly express their messages. This template contains a variety of slides for the user to input data, such as structures to contrast two elements, bullet points, and slides for written information. Slidegeeks is prepared to create an impression.

Slide 1 of 2
This slide represents revenue and net profit for five years for the company. It showcase increase in revenue due to product recognition in market and gaining competitive edge in market. Want to ace your presentation in front of a live audience Our Expanding Target Audience With Cultural Branding Revenue And Net Profit Trend For Brand Clipart PDF can help you do that by engaging all the users towards you.. Slidegeeks experts have put their efforts and expertise into creating these impeccable powerpoint presentations so that you can communicate your ideas clearly. Moreover, all the templates are customizable, and easy-to-edit and downloadable. Use these for both personal and commercial use.

Slide 1 of 2
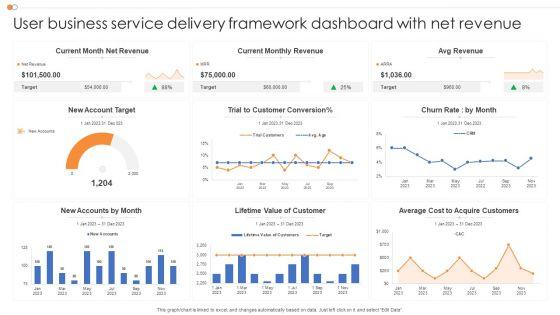
Showcasing this set of slides titled User Business Service Delivery Framework Dashboard With Net Revenue Microsoft PDF. The topics addressed in these templates are Service Delivery, Framework Dashboard, Net Revenue. All the content presented in this PPT design is completely editable. Download it and make adjustments in color, background, font etc. as per your unique business setting.


Slide 1 of 2
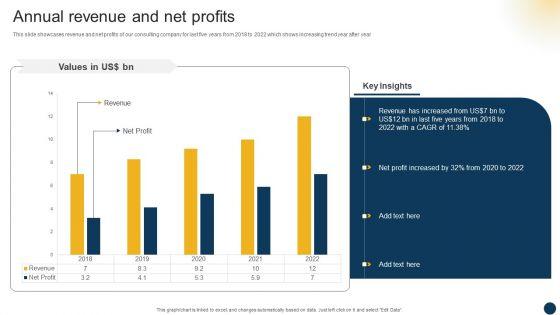
This slide focuses on financial highlights of Web design company which represents revenue and net profit for last five years from 2018 to 2022. Do you have to make sure that everyone on your team knows about any specific topic I yes, then you should give Web Design Company Overview Revenue And Net Profit Analysis Designs PDF a try. Our experts have put a lot of knowledge and effort into creating this impeccable Web Design Company Overview Revenue And Net Profit Analysis Designs PDF. You can use this template for your upcoming presentations, as the slides are perfect to represent even the tiniest detail. You can download these templates from the Slidegeeks website and these are easy to edit. So grab these today.

Slide 1 of 2
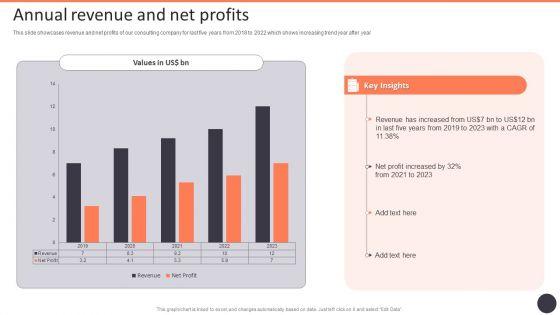
This slide showcases revenue and net profits of our consulting company for last five years from 2018 to 2022 which shows increasing trend year after year. Presenting this PowerPoint presentation, titled Organizational Advisory Solutions Business Profile Annual Revenue And Net Profits Background PDF with topics curated by our researchers after extensive research. This editable Organizational Advisory Solutions Business Profile Annual Revenue And Net Profits Background PDF is available for immediate download and provides attractive features when used. Download now and captivate your audience. Presenting this Organizational Advisory Solutions Business Profile Annual Revenue And Net Profits Background PDF. Our researchers have carefully researched and created these slides with all aspects taken into consideration. This is a completely customizable Organizational Advisory Solutions Business Profile Annual Revenue And Net Profits Background PDF that is available for immediate downloading. Download now and make an impact on your audience. Highlight the attractive features available with our PPTs.
Slide 1 of 2
This slide showcases revenue and net profits of our consulting company for last five years from 2018 to 2022 which shows increasing trend year after year. Presenting this PowerPoint presentation, titled Business Strategy Consulting Solutions Company Outline Annual Revenue And Net Profits Clipart PDF with topics curated by our researchers after extensive research. This editable presentation is available for immediate download and provides attractive features when used. Download now and captivate your audience. Presenting this Business Strategy Consulting Solutions Company Outline Annual Revenue And Net Profits Clipart PDF. Our researchers have carefully researched and created these slides with all aspects taken into consideration. This is a completely customizable Business Strategy Consulting Solutions Company Outline Annual Revenue And Net Profits Clipart PDF that is available for immediate downloading. Download now and make an impact on your audience. Highlight the attractive features available with our PPTs.

Slide 1 of 2
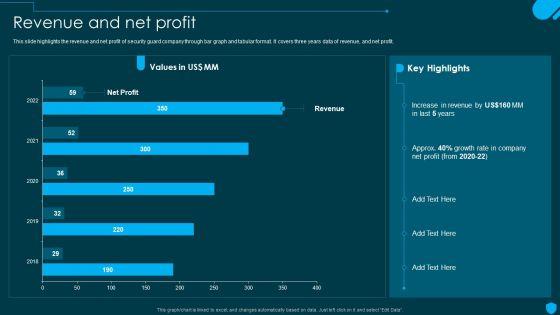
This slide highlights the revenue and net profit of security guard company through bar graph and tabular format. It covers three years data of revenue, and net profit. Explore a selection of the finest Security And Human Resource Services Business Profile Revenue And Net Profit Designs PDF here. With a plethora of professionally designed and pre-made slide templates, you can quickly and easily find the right one for your upcoming presentation. You can use our Security And Human Resource Services Business Profile Revenue And Net Profit Designs PDF to effectively convey your message to a wider audience. Slidegeeks has done a lot of research before preparing these presentation templates. The content can be personalized and the slides are highly editable. Grab templates today from Slidegeeks.

Slide 1 of 2
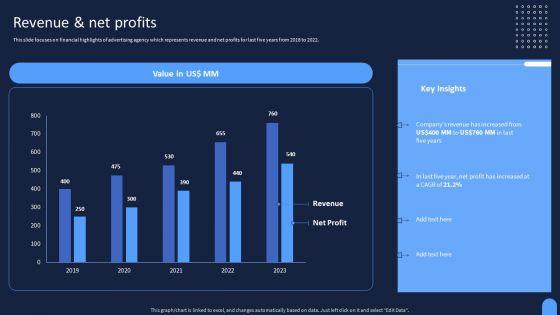
This slide focuses on financial highlights of advertising agency which represents revenue and net profits for last five years from 2018 to 2022. Welcome to our selection of the Ad And Media Agency Company Profile Revenue And Net Profits Diagrams PDF. These are designed to help you showcase your creativity and bring your sphere to life. Planning and Innovation are essential for any business that is just starting out. This collection contains the designs that you need for your everyday presentations. All of our PowerPoints are 100 percent editable, so you can customize them to suit your needs. This multi-purpose template can be used in various situations. Grab these presentation templates today.

Slide 1 of 2
This slide showcases revenue and net profits of our consulting company for last five years from 2018 to 2022 which shows increasing trend year after year. Deliver an awe inspiring pitch with this creative Strategic Management Consultancy Business Profile Annual Revenue And Net Profits Microsoft PDF bundle. Topics like Reduced Operating Expenses, Revenue can be discussed with this completely editable template. It is available for immediate download depending on the needs and requirements of the user.

Slide 1 of 2
This slide highlights the revenue and net profit of security guard company through bar graph and tabular format. It covers three years data of revenue, and net profit. Deliver and pitch your topic in the best possible manner with this Manpower Corporate Security Business Profile Revenue And Net Profit Inspiration PDF. Use them to share invaluable insights on Revenue, Profit, Growth Rate and impress your audience. This template can be altered and modified as per your expectations. So, grab it now.

Slide 1 of 2
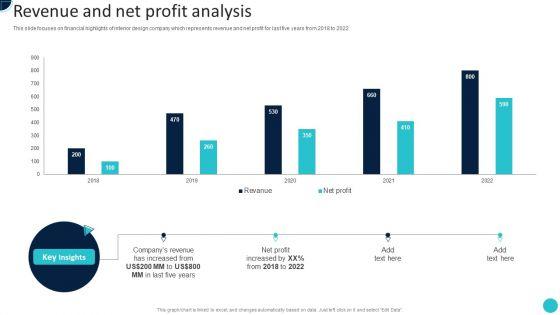
This slide focuses on financial highlights of interior design company which represents revenue and net profit for last five years from 2018 to 2022.Deliver an awe inspiring pitch with this creative Home Decoration Company Profile Revenue And Net Profit Analysis Themes PDF bundle. Topics like Net Profit, Increased, Companys Revenue can be discussed with this completely editable template. It is available for immediate download depending on the needs and requirements of the user.
Slide 1 of 2
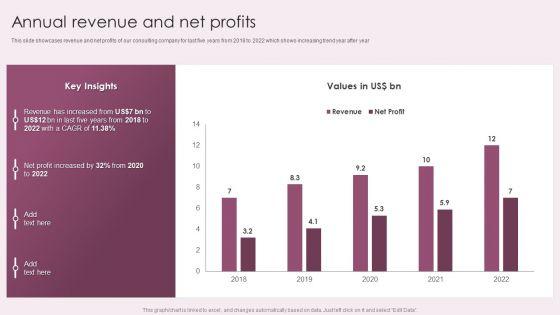
This slide showcases revenue and net profits of our consulting company for last five years from 2018 to 2022 which shows increasing trend year after year. Deliver an awe inspiring pitch with this creative Business Advisory Solutions Company Profile Annual Revenue And Net Profits Slides PDF bundle. Topics like Key Insights, Net Profit Increased, 2018 To 2022 can be discussed with this completely editable template. It is available for immediate download depending on the needs and requirements of the user.
Slide 1 of 2
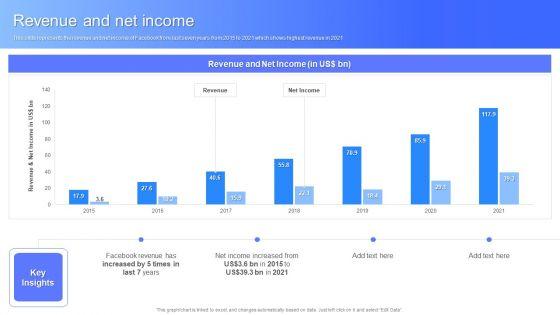
This slide represents the revenue and net income of Facebook from last seven years from 2015 to 2021 which shows highest revenue in 2021. Deliver and pitch your topic in the best possible manner with this Revenue And Net Income Facebook Business Outline Information PDF. Use them to share invaluable insights on Revenue, Net Income and impress your audience. This template can be altered and modified as per your expectations. So, grab it now.

Slide 1 of 2
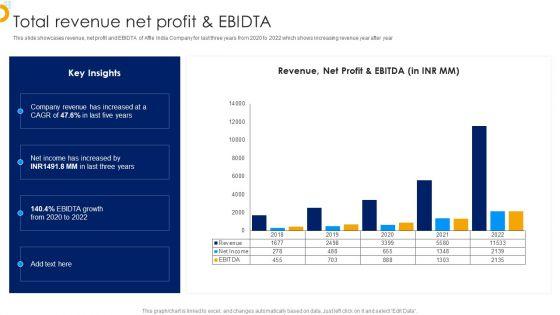
Deliver an awe inspiring pitch with this creative Affle India Ltd Business Profile Total Revenue Net Profit And Ebidta Graphics PDF bundle. Topics like Company Revenue, Growth, Net Profit can be discussed with this completely editable template. It is available for immediate download depending on the needs and requirements of the user.
Slide 1 of 2
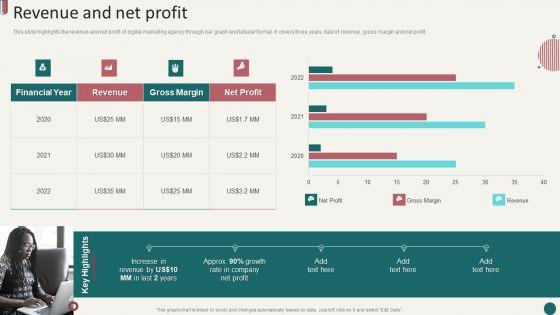
This slide highlights the revenue and net profit of digital marketing agency through bar graph and tabular format. It covers three years data of revenue, gross margin and net profit.Deliver an awe inspiring pitch with this creative Website Marketing Enterprise Profile Revenue And Net Profit Ppt PowerPoint Presentation Icon Format Ideas PDF bundle. Topics like Revenue, Gross Margin, Net Profit can be discussed with this completely editable template. It is available for immediate download depending on the needs and requirements of the user.
Slide 1 of 2
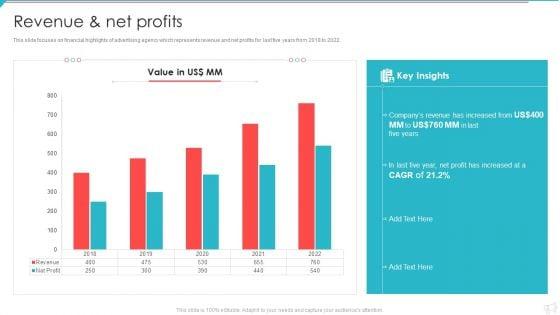
This slide focuses on financial highlights of advertising agency which represents revenue and net profits for last five years from 2018 to 2022. Deliver and pitch your topic in the best possible manner with this Advertisement And Marketing Agency Company Profile Revenue And Net Profits Formats PDF. Use them to share invaluable insights on Companys Revenue, Profit Increased, 2018 To 2022 and impress your audience. This template can be altered and modified as per your expectations. So, grab it now.

Slide 1 of 2
This slide highlights the revenue and net profit of security guard company through bar graph and tabular format. It covers three years data of revenue, and net profit. Deliver and pitch your topic in the best possible manner with this Security Agency Business Profile Revenue And Net Profit Structure PDF. Use them to share invaluable insights on Growth Rate, Net Profit, Revenue and impress your audience. This template can be altered and modified as per your expectations. So, grab it now.

Slide 1 of 2
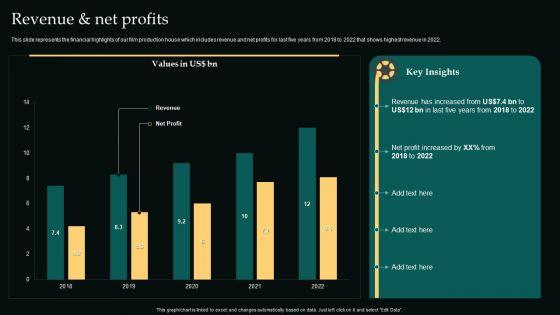
This slide represents the financial highlights of our film production house which includes revenue and net profits for last five years from 2018 to 2022 that shows highest revenue in 2022. Deliver an awe inspiring pitch with this creative Motion Pictures Production Company Profile Revenue And Net Profits Demonstration PDF bundle. Topics like Revenue, Net Profit Increased, 2018 To 2022 can be discussed with this completely editable template. It is available for immediate download depending on the needs and requirements of the user.
Slide 1 of 2
This slide highlights the revenue and net profit of digital marketing agency through bar graph and tabular format. It covers three years data of revenue, gross margin and net profit. Deliver and pitch your topic in the best possible manner with this Social Media Marketing Company Profile Revenue And Net Profit Ppt Summary Gallery PDF. Use them to share invaluable insights on Financial Year, Revenue, Gross Margin and impress your audience. This template can be altered and modified as per your expectations. So, grab it now.
Slide 1 of 2
This slide highlights the revenue and net profit of agricultural company. It covers three years data of revenue, and net profit with key highlights. Deliver an awe inspiring pitch with this creative Food And Agro Company Outline Revenue And Net Profit Ppt Icon Visual Aids PDF bundle. Topics like Increase Revenue, Growth Rate, Revenue, Net Profit can be discussed with this completely editable template. It is available for immediate download depending on the needs and requirements of the user.
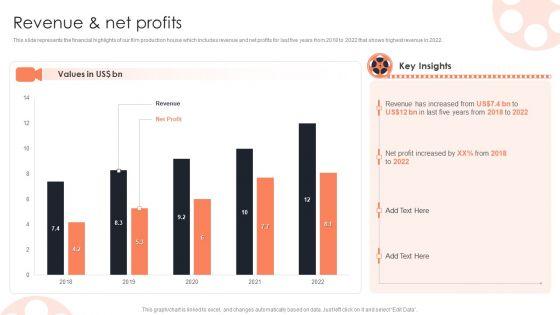

Slide 1 of 2
Deliver an awe inspiring pitch with this creative Revenue And Net Profits Film Media Company Profile Ppt PowerPoint Presentation Model Summary PDF bundle. Topics like Revenue Increased, Profit Increased, Values can be discussed with this completely editable template. It is available for immediate download depending on the needs and requirements of the user.


Slide 1 of 2
This slide represents the financial highlights of our film production house which includes revenue and net profits for last five years from 2018 to 2022 that shows highest revenue in 2022.Deliver an awe inspiring pitch with this creative Film Making Company Outline Revenue And Net Profits Ppt PowerPoint Presentation Ideas Slide Portrait PDF bundle. Topics like Revenue Increased, Five Years, Profit Increased can be discussed with this completely editable template. It is available for immediate download depending on the needs and requirements of the user.
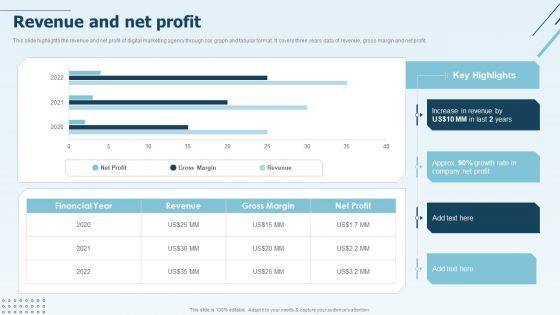

Slide 1 of 2
This slide highlights the revenue and net profit of digital marketing agency through bar graph and tabular format. It covers three years data of revenue, gross margin and net profit.Deliver an awe inspiring pitch with this creative Digital Marketing Company Profile Revenue And Net Profit Download PDF bundle. Topics like Increase Revenue, Gross Margin, Net Profit can be discussed with this completely editable template. It is available for immediate download depending on the needs and requirements of the user.
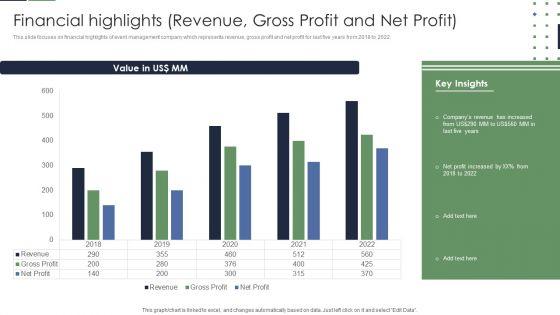
Slide 1 of 2
This slide focuses on financial highlights of event management company which represents revenue, gross profit and net profit for last five years from 2018 to 2022. Deliver an awe inspiring pitch with this creative Event Planner Company Profile Financial Highlights Revenue Gross Profit And Net Profit Summary PDF bundle. Topics like Value, Revenue, Net Profit can be discussed with this completely editable template. It is available for immediate download depending on the needs and requirements of the user.
Slide 1 of 2
This slide focuses on financial highlights of advertising agency which represents revenue and net profits for last five years from 2018 to 2022. Deliver and pitch your topic in the best possible manner with this Advertising Solutions Company Details Revenue And Net Profits Ppt PowerPoint Presentation Icon Files PDF. Use them to share invaluable insights on Net Profit, Revenue, 2018 To 2022 and impress your audience. This template can be altered and modified as per your expectations. So, grab it now.
Slide 1 of 2
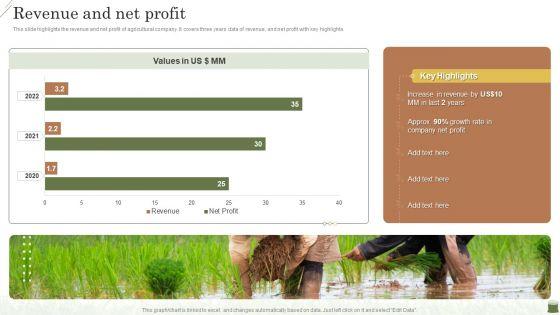
This slide highlights the revenue and net profit of agricultural company. It covers three years data of revenue, and net profit with key highlights.Deliver an awe inspiring pitch with this creative Farming Business Company Profile Revenue And Net Profit Sample PDF bundle. Topics like Increase Revenue, Company Profit, Values can be discussed with this completely editable template. It is available for immediate download depending on the needs and requirements of the user.
Slide 1 of 2
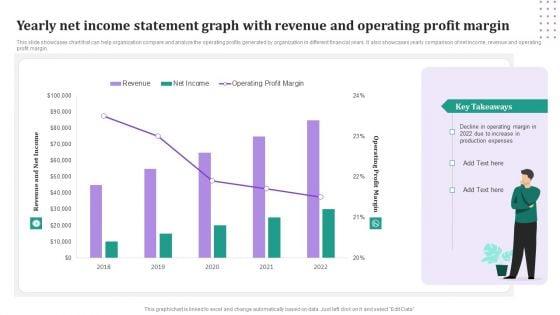
This slide showcases chart that can help organization compare and analyze the operating profits generated by organization in different financial years. It also showcases yearly comparison of net income, revenue and operating profit margin. Pitch your topic with ease and precision using this Yearly Net Income Statement Graph With Revenue And Operating Profit Margin Download PDF. This layout presents information on Revenue, Net Income, Operating Profit Margin. It is also available for immediate download and adjustment. So, changes can be made in the color, design, graphics or any other component to create a unique layout.

Slide 1 of 2
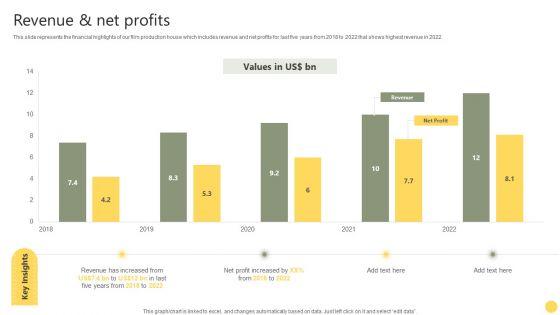
This slide represents the financial highlights of our film production house which includes revenue and net profits for last five years from 2018 to 2022 that shows highest revenue in 2022. Deliver an awe inspiring pitch with this creative Film Making Firm Profile Revenue And Net Profits Ppt PowerPoint Presentation Gallery Template PDF bundle. Topics like 2018 To 2022, Net Profit Increased, Revenue can be discussed with this completely editable template. It is available for immediate download depending on the needs and requirements of the user.
Slide 1 of 2
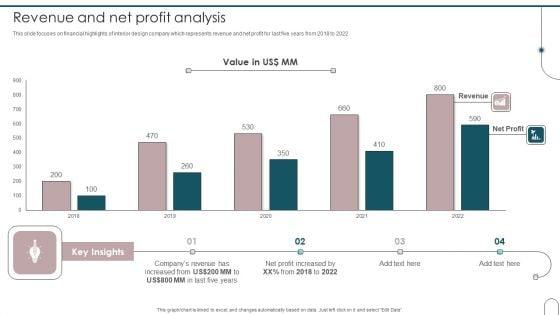
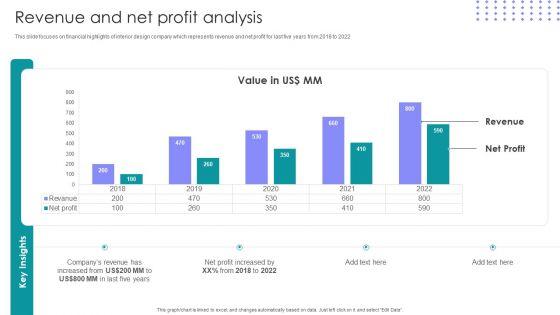
This slide focuses on financial highlights of interior design company which represents revenue and net profit for last five years from 2018 to 2022. Deliver and pitch your topic in the best possible manner with this Home Interior Design And Decoration Company Profile Revenue And Net Profit Analysis Summary PDF. Use them to share invaluable insights on Revenue, Net Profit, 2018 To 2022 and impress your audience. This template can be altered and modified as per your expectations. So, grab it now.
Slide 1 of 2
This slide focuses on financial highlights of interior design company which represents revenue and net profit for last five years from 2018 to 2022. Deliver an awe inspiring pitch with this creative Interior Design Company Outline Revenue And Net Profit Analysis Ppt PowerPoint Presentation Gallery Influencers PDF bundle. Topics like Revenue, Net Profit, 2018 To 2022 can be discussed with this completely editable template. It is available for immediate download depending on the needs and requirements of the user.
Slide 1 of 2
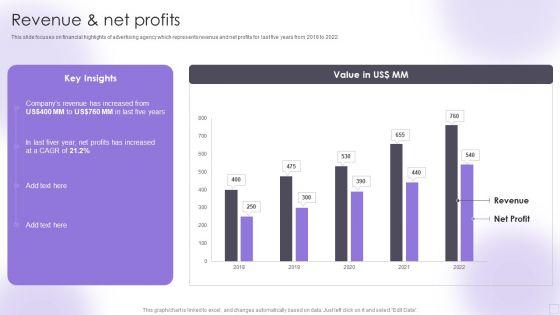
This slide focuses on financial highlights of advertising agency which represents revenue and net profits for last five years from 2018 to 2022. Deliver and pitch your topic in the best possible manner with this Advertising Services Company Profile Revenue And Net Profits Background PDF. Use them to share invaluable insights on Revenue, Net Profits and impress your audience. This template can be altered and modified as per your expectations. So, grab it now.
Slide 1 of 2
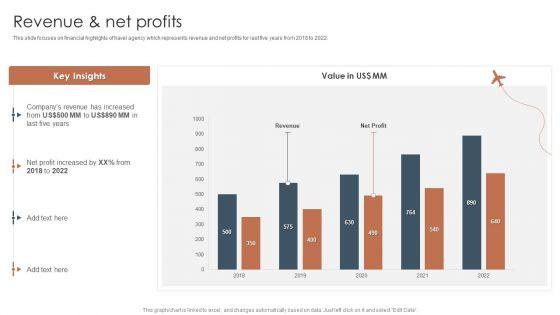
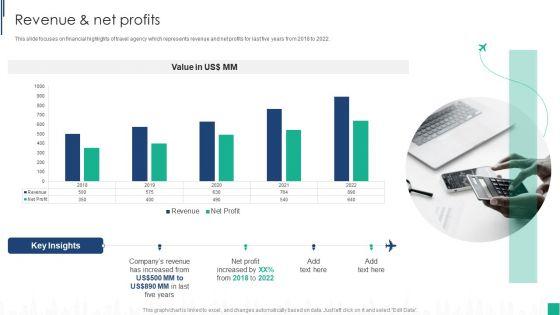
This slide focuses on financial highlights of travel agency which represents revenue and net profits for last five years from 2018 to 2022.Deliver an awe inspiring pitch with this creative Tour And Travels Agency Profile Revenue And Net Profits Inspiration PDF bundle. Topics like Companys Revenue, Profit Increased, Revenue can be discussed with this completely editable template. It is available for immediate download depending on the needs and requirements of the user.
Slide 1 of 2
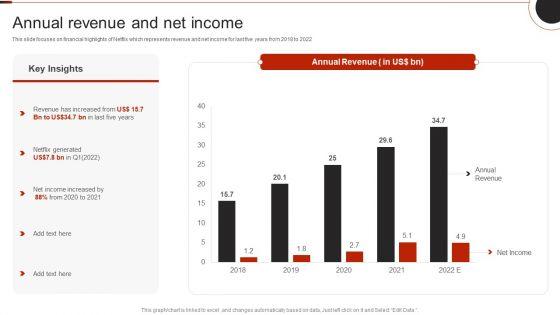
This slide focuses on financial highlights of Netflix which represents revenue and net income for last five years from 2018 to 2022.Deliver an awe inspiring pitch with this creative Netflix Company Outline Annual Revenue And Net Income Pictures PDF bundle. Topics like Annual Revenue, Income Increased, Netflix Generated can be discussed with this completely editable template. It is available for immediate download depending on the needs and requirements of the user.
Slide 1 of 2
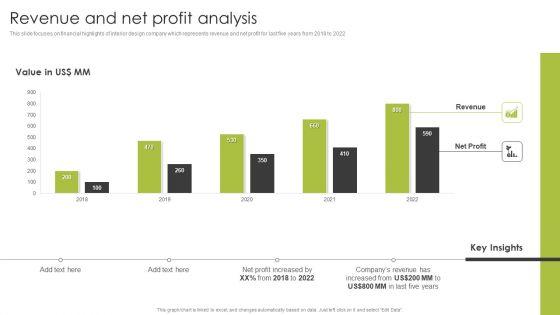
Deliver an awe inspiring pitch with this creative Home Interior Styling Services Company Profile Revenue And Net Profit Analysis Infographics PDF bundle. Topics like Profit Increased, Companys Revenue, Increased can be discussed with this completely editable template. It is available for immediate download depending on the needs and requirements of the user.

Slide 1 of 2
This slide focuses on financial highlights of travel agency which represents revenue and net profits for last five years from 2018 to 2022.Deliver an awe inspiring pitch with this creative Online Tour And Travel Company Profile Revenue And Net Profits Introduction PDF bundle. Topics like Profit Increased, Increased, Value can be discussed with this completely editable template. It is available for immediate download depending on the needs and requirements of the user.


Slide 1 of 2
This slide highlights the revenue and net profit of security guard company through bar graph and tabular format. It covers three years data of revenue, and net profit. Deliver an awe inspiring pitch with this creative Security Officer Service Company Profile Revenue And Net Profit Ppt PowerPoint Presentation Gallery Graphic Images PDF bundle. Topics like Net Profit, Increase Revenue, 2018 To 2022 can be discussed with this completely editable template. It is available for immediate download depending on the needs and requirements of the user.
Slide 1 of 2
This slide focuses on financial highlights of travel agency which represents revenue and net profits for last five years from 2018 to 2022.Deliver an awe inspiring pitch with this creative Tour Agency Business Profile Revenue And Net Profits Topics PDF bundle. Topics like Value, Key Insights, Revenue Increased can be discussed with this completely editable template. It is available for immediate download depending on the needs and requirements of the user.
Slide 1 of 2
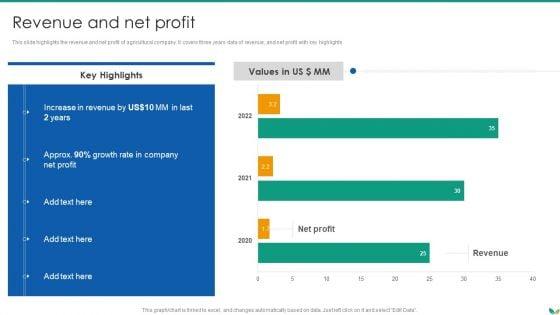
This slide highlights the revenue and net profit of agricultural company. It covers three years data of revenue, and net profit with key highlights.Deliver an awe inspiring pitch with this creative Agricultural Business Company Profile Revenue And Net Profit Demonstration PDF bundle. Topics like Increase In Revenue, Growth Rate, Net Profit can be discussed with this completely editable template. It is available for immediate download depending on the needs and requirements of the user.
Slide 1 of 2
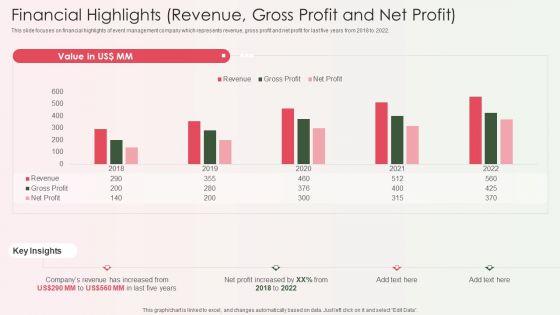
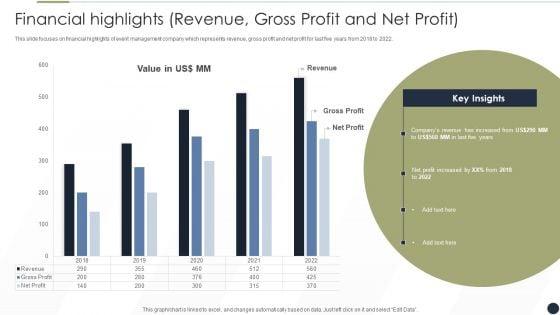
This slide focuses on financial highlights of event management company which represents revenue, gross profit and net profit for last five years from 2018 to 2022.Deliver and pitch your topic in the best possible manner with this Event Organizer And Coordinator Company Profile Financial Highlights Revenue Gross Profit And Net Profit Formats PDF Use them to share invaluable insights on Revenue Increased, Profit Increased, Key Insights and impress your audience. This template can be altered and modified as per your expectations. So, grab it now.

Slide 1 of 2
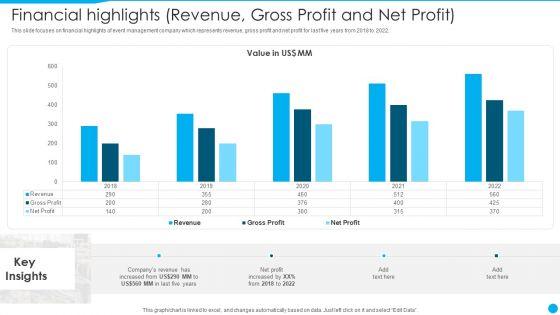
This slide focuses on financial highlights of event management company which represents revenue, gross profit and net profit for last five years from 2018 to 2022.Deliver and pitch your topic in the best possible manner with this Event Management Services Company Profile Financial Highlights Revenue Gross Profit And Net Profit Template PDF Use them to share invaluable insights on Gross Profit, Key Insights, profit increased and impress your audience. This template can be altered and modified as per your expectations. So, grab it now.
Slide 1 of 2
This slide focuses on financial highlights of event management company which represents revenue, gross profit and net profit for last five years from 2018 to 2022.Deliver and pitch your topic in the best possible manner with this Event Management Firm Overview Financial Highlights Revenue Gross Profit And Net Profit Information PDF Use them to share invaluable insights on Value, Gross Profit, Net Profit and impress your audience. This template can be altered and modified as per your expectations. So, grab it now.

Slide 1 of 2
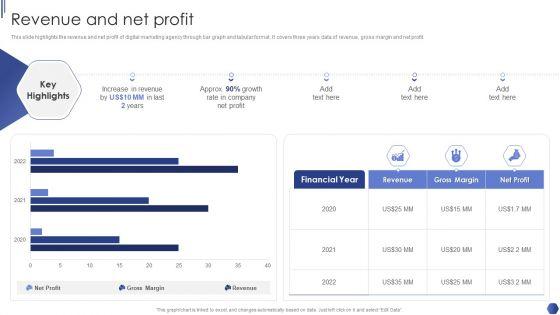
This slide highlights the revenue and net profit of digital marketing agency through bar graph and tabular format. It covers three years data of revenue, gross margin and net profit. Deliver and pitch your topic in the best possible manner with this Digital Marketing Agency Business Profile Revenue And Net Profit Diagrams PDF. Use them to share invaluable insights on Increase In Revenue, Growth Rate, Net Profit and impress your audience. This template can be altered and modified as per your expectations. So, grab it now.
Slide 1 of 2
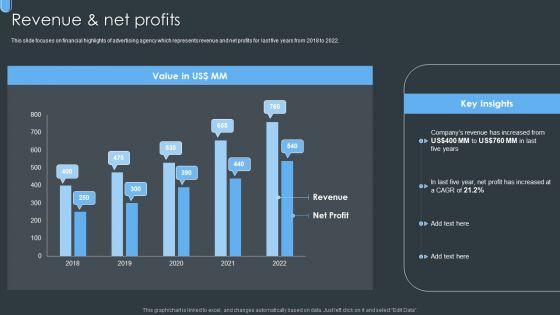
This slide focuses on financial highlights of advertising agency which represents revenue and net profits for last five years from 2018 to 2022. Deliver and pitch your topic in the best possible manner with this Digital Ad Marketing Services Company Profile Revenue And Net Profits Professional PDF. Use them to share invaluable insights on Revenue, Net Profit, Revenue and impress your audience. This template can be altered and modified as per your expectations. So, grab it now.
Slide 1 of 2
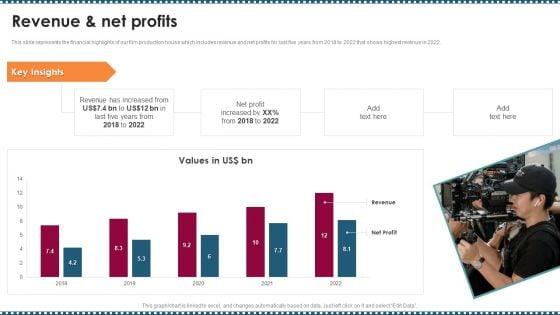
This slide represents the financial highlights of our film production house which includes revenue and net profits for last five years from 2018 to 2022 that shows highest revenue in 2022.Deliver an awe inspiring pitch with this creative Feature Film Production Company Profile Revenue And Net Profits Brochure PDF bundle. Topics like Key Insights, Revenue Increased, Profit Increased can be discussed with this completely editable template. It is available for immediate download depending on the needs and requirements of the user.
SHOW
- 60
- 120
- 180
DISPLAYING: 60 of 95 Item(s)
Page
