 AI PPT Maker
 Templates
 PPT Bundles
 Design Services
 Business PPTs
 Business Plan
 Management
 Strategy
 Introduction PPT
 Roadmap
 Self Introduction
 Timelines
 Process
 Marketing
 Agenda
 Technology
 Medical
 Startup Business Plan
 Cyber Security
 Dashboards
 SWOT
SWOT Proposals
 Education
 Pitch Deck
 Digital Marketing
 KPIs
KPIs Project Management
 Product Management
 Artificial Intelligence
 Target Market
 Communication
 Supply Chain
 Google Slides
 Research Services
 One Pagers
 All Categories
Operating Revenues PowerPoint Presentation Templates and Google Slides
33 Item(s)
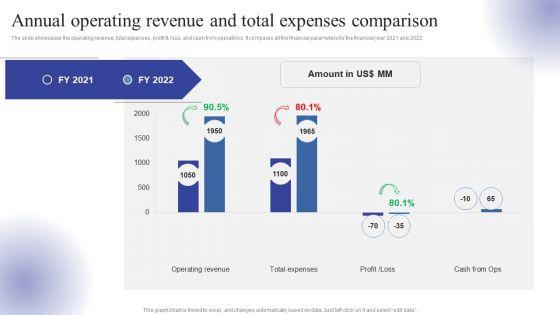

The slide showcases the operating revenue, total expenses, profit and loss, and cash from operations. It compares all the financial parameters for the financial year 2021 and 2022. Want to ace your presentation in front of a live audience Our Annual Operating Revenue And Total Expenses Comparison Ppt Infographic Template Rules PDF can help you do that by engaging all the users towards you.. Slidegeeks experts have put their efforts and expertise into creating these impeccable powerpoint presentations so that you can communicate your ideas clearly. Moreover, all the templates are customizable, and easy-to-edit and downloadable. Use these for both personal and commercial use.

The slide shows the revenue comparison of management vs consensus. It provides the historical 2015-2020 and forecasted 2021-2024 revenue. Create an editable Selling Strategy And Operational Plan Revenue Forecast Management Vs Consensus Ppt Layouts Examples PDF that communicates your idea and engages your audience. Whether you are presenting a business or an educational presentation, pre-designed presentation templates help save time. Selling Strategy And Operational Plan Revenue Forecast Management Vs Consensus Ppt Layouts Examples PDF is highly customizable and very easy to edit, covering many different styles from creative to business presentations. Slidegeeks has creative team members who have crafted amazing templates. So, go and get them without any delay.


This slide shows the business model of a franchise which largely serves as a center of social interaction, provides patrons with a place to congregate and talk in small groups. It includes details related to revenue growth and breakdown in billions and detail related to company operated vs licensed stores. Showcasing this set of slides titled Coffee Shop Franchise Operating Revenue Growth Model Ppt Layouts Sample PDF. The topics addressed in these templates are Revenue Growth, Revenue Breakdown, Company Operated Stores. All the content presented in this PPT design is completely editable. Download it and make adjustments in color, background, font etc. as per your unique business setting.
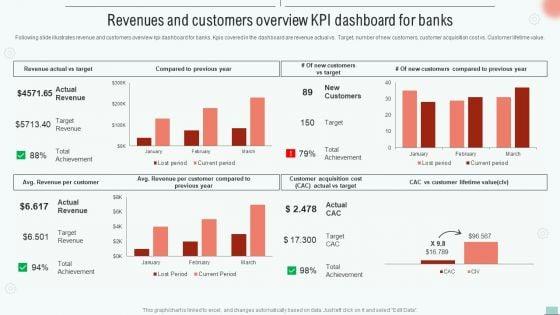

Following slide illustrates revenue and customers overview kpi dashboard for banks. Kpis covered in the dashboard are revenue actual vs. Target, number of new customers, customer acquisition cost vs. Customer lifetime value.This Implementing BPM Tool To Enhance Operational Efficiency Revenues And Customers Overview Kpi Dashboard Rules PDF is perfect for any presentation, be it in front of clients or colleagues. It is a versatile and stylish solution for organizing your meetings. The Implementing BPM Tool To Enhance Operational Efficiency Revenues And Customers Overview Kpi Dashboard Rules PDF features a modern design for your presentation meetings. The adjustable and customizable slides provide unlimited possibilities for acing up your presentation. Slidegeeks has done all the homework before launching the product for you. So, do not wait, grab the presentation templates today.


This slide illustrates performance analysis using operating revenue, operating expenditure opex and income metrics which can be referred by organizations to evaluate their inflows and outflows to make relevant decisions for increasing profitability. It includes information about operating revenue, operating expense and income before taxes. Pitch your topic with ease and precision using this Performance Analysis Using Operating Revenue Business Operational Expenditure And Income Metrics Diagrams PDF. This layout presents information on Taxes, Highest Operating, Recorded. It is also available for immediate download and adjustment. So, changes can be made in the color, design, graphics or any other component to create a unique layout.

Deliver and pitch your topic in the best possible manner with this Affle India Ltd Business Profile Operational Revenue Split By Geography Brochure PDF. Use them to share invaluable insights on Operational Revenue Split, Geography and impress your audience. This template can be altered and modified as per your expectations. So, grab it now.
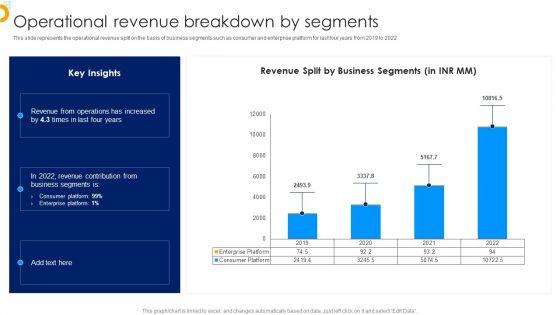

Deliver an awe inspiring pitch with this creative Affle India Ltd Business Profile Operational Revenue Breakdown By Segments Infographics PDF bundle. Topics like Consumer Platform, Enterprise Platform, Revenue can be discussed with this completely editable template. It is available for immediate download depending on the needs and requirements of the user.


This slide represents the statistical data of operating revenue generated through solid waste management by an organization. It includes data related to waste recycling, transfer, landfill etc. Pitch your topic with ease and precision using this Integrated Solid Waste Administration Operating Revenue Statistics Formats PDF. This layout presents information on Revenue, Recycling, Commercials. It is also available for immediate download and adjustment. So, changes can be made in the color, design, graphics or any other component to create a unique layout.

Deliver and pitch your topic in the best possible manner with this dashboard related to the company products and operations revenue rules pdf. Use them to share invaluable insights on area population, largest bottler, employees, net revenue, vending equipment and impress your audience. This template can be altered and modified as per your expectations. So, grab it now.
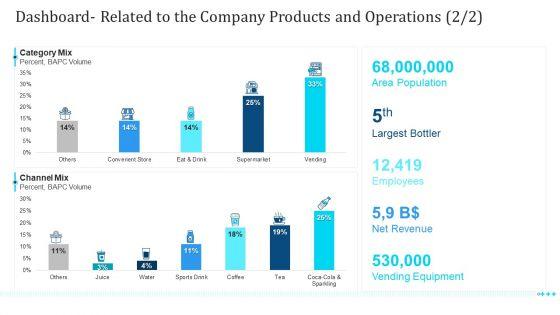
Deliver and pitch your topic in the best possible manner with this dashboard related to the company products and operations revenue ppt portfolio deck pdf. Use them to share invaluable insights on dashboard related to the company products and operations and impress your audience. This template can be altered and modified as per your expectations. So, grab it now.
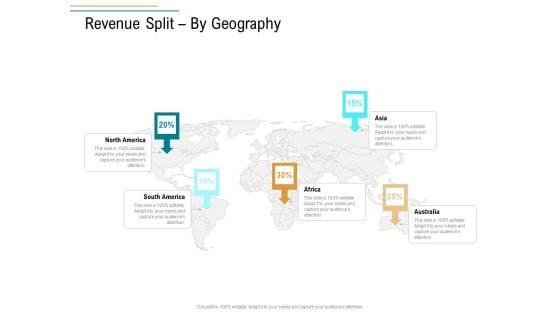
This is a business operations assessment revenue split by geography ppt layouts guidelines pdf template with various stages. Focus and dispense information on five stages using this creative set, that comes with editable features. It contains large content boxes to add your information on topics like revenue split by geography. You can also showcase facts, figures, and other relevant content using this PPT layout. Grab it now.
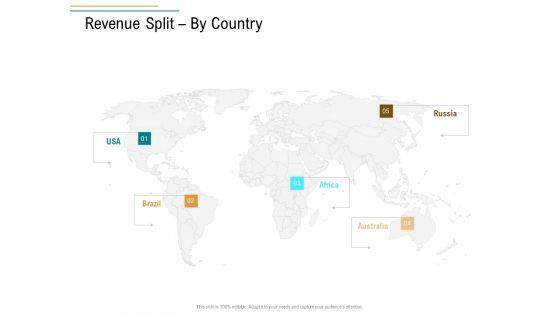
Presentingbusiness operations assessment revenue split by country ppt layouts slide download pdf to provide visual cues and insights. Share and navigate important information on five stages that need your due attention. This template can be used to pitch topics like split by geography. In addition, this PPT design contains high-resolution images, graphics, etc, that are easily editable and available for immediate download.


Deliver an awe-inspiring pitch with this creative business operations assessment revenue and cogs forecasting ppt layouts show pdf bundle. Topics like forecasted revenue, cost goods sold, units sold annually, average price per unit, annual revenue per product can be discussed with this completely editable template. It is available for immediate download depending on the needs and requirements of the user.
Presenting this set of slides with name equity analysis project review and rating operating revenue ppt powerpoint presentation icon styles pdf. The topics discussed in these slides are criteria, figures, rating, profit equity ratio, market capitalization, valuation score, operating revenue . This is a completely editable PowerPoint presentation and is available for immediate download. Download now and impress your audience.
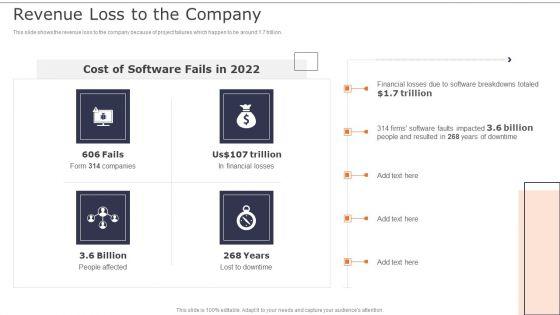


This slide shows the revenue loss to the company because of project failures which happen to be around 1.7 trillion.Get a simple yet stunning designed Deploying XP Practices To Enhance Operational Efficiency Revenue Loss To The Company Infographics PDF. It is the best one to establish the tone in your meetings. It is an excellent way to make your presentations highly effective. So, download this PPT today from Slidegeeks and see the positive impacts. Our easy-to-edit Deploying XP Practices To Enhance Operational Efficiency Revenue Loss To The Company Infographics PDF can be your go-to option for all upcoming conferences and meetings. So, what are you waiting for Grab this template today.
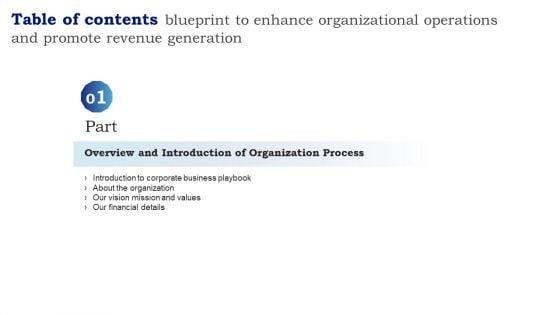
Explore a selection of the finest Table Of Contents Blueprint Enhance Organizational Operations Promote Revenue Generation Vision Template PDF here. With a plethora of professionally designed and pre made slide templates, you can quickly and easily find the right one for your upcoming presentation. You can use our Table Of Contents Blueprint Enhance Organizational Operations Promote Revenue Generation Vision Template PDF to effectively convey your message to a wider audience. Slidegeeks has done a lot of research before preparing these presentation templates. The content can be personalized and the slides are highly editable. Grab templates today from Slidegeeks.
Introducing our well designed Icons Slide For Blueprint Enhance Organizational Operations Promote Revenue Generation Summary PDF set of slides. The slide displays editable icons to enhance your visual presentation. The icons can be edited easily. So customize according to your business to achieve a creative edge. Download and share it with your audience.

The following slide highlights the revenue stream as it displays major areas through which the organization can generate. The provides slide displays the various revenues model that the organization is using and the entire business process. This Blueprint To Enhance Organizational Operations Our Revenue Stream Ideas PDF is perfect for any presentation, be it in front of clients or colleagues. It is a versatile and stylish solution for organizing your meetings. The product features a modern design for your presentation meetings. The adjustable and customizable slides provide unlimited possibilities for acing up your presentation. Slidegeeks has done all the homework before launching the product for you. So, do not wait, grab the presentation templates today.
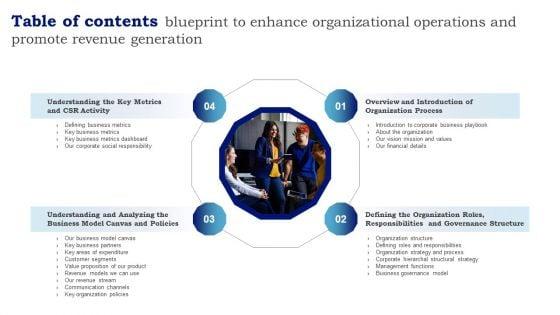
If your project calls for a presentation, then Slidegeeks is your go to partner because we have professionally designed, easy to edit templates that are perfect for any presentation. After downloading, you can easily edit Table Of Contents Blueprint Enhance Organizational Operations Promote Revenue Generation Inspiration PDF and make the changes accordingly. You can rearrange slides or fill them with different images. Check out all the handy templates.
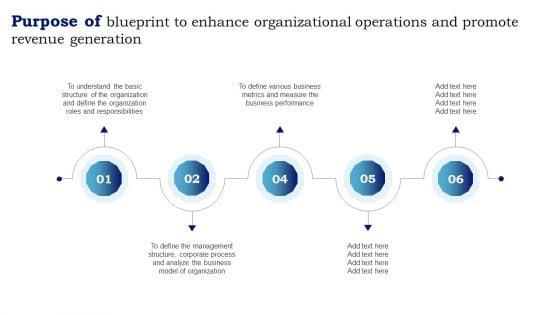
Find highly impressive Purpose Of Blueprint Enhance Organizational Operations Promote Revenue Generation Summary PDF on Slidegeeks to deliver a meaningful presentation. You can save an ample amount of time using these presentation templates. No need to worry to prepare everything from scratch because Slidegeeks experts have already done a huge research and work for you. You need to download Purpose Of Blueprint Enhance Organizational Operations Promote Revenue Generation Summary PDF for your upcoming presentation. All the presentation templates are 100 percent editable and you can change the color and personalize the content accordingly. Download now.

Purpose of the following slide is to highlight multiple revenue models that the organization can use to generate income. These model can be transaction based, advertisement based, commission based, and recurring revenue model. Do you have an important presentation coming up Are you looking for something that will make your presentation stand out from the rest Look no further than Blueprint To Enhance Organizational Operations Revenue Models We Can Use Demonstration PDF. With our professional designs, you can trust that your presentation will pop and make delivering it a smooth process. And with Slidegeeks, you can trust that your presentation will be unique and memorable. So why wait Grab Blueprint To Enhance Organizational Operations Revenue Models We Can Use Demonstration PDF today and make your presentation stand out from the rest.

The slide showcases the competitor comparison by operations and revenue. It depicts comparison metrics which includes service coverage, fleet size, order size, total deliveries, workforce, revenue and net profit.Deliver an awe inspiring pitch with this creative Transportation Company Profile Competitor Comparison By Operations And Revenue Ppt PowerPoint Presentation Model Inspiration PDF bundle. Topics like National Transport, Freight Movers, Transport Solutions can be discussed with this completely editable template. It is available for immediate download depending on the needs and requirements of the user.
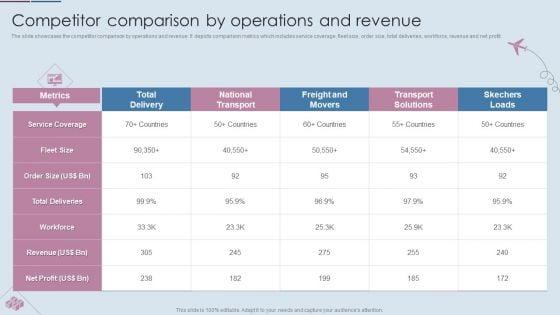
The slide showcases the competitor comparison by operations and revenue. It depicts comparison metrics which includes service coverage, fleet size, order size, total deliveries, workforce, revenue and net profit. Deliver and pitch your topic in the best possible manner with this Logistics Shipment Company Profile Competitor Comparison By Operations And Revenue Brochure PDF. Use them to share invaluable insights on Service Coverage, Order Size, Total Deliveries and impress your audience. This template can be altered and modified as per your expectations. So, grab it now.

The slide showcases the competitor comparison by operations and revenue. It depicts comparison metrics which includes service coverage, fleet size, order size, total deliveries, workforce, revenue and net profit.Deliver an awe inspiring pitch with this creative Freight Shipping Company Profile Competitor Comparison By Operations And Revenue Template PDF bundle. Topics like Service Coverage, Total Deliveries, National Transport can be discussed with this completely editable template. It is available for immediate download depending on the needs and requirements of the user.


This slide represents net operating revenue spilt by geographical region Europe, Middle East, Africa, Latina America, North America and Asia Pacific. Crafting an eye-catching presentation has never been more straightforward. Let your presentation shine with this tasteful yet straightforward Net Operating Revenue Spilt By Liquid Refreshment Manufacturer Company Profile Ppt Example CP SS V template. It offers a minimalistic and classy look that is great for making a statement. The colors have been employed intelligently to add a bit of playfulness while still remaining professional. Construct the ideal Net Operating Revenue Spilt By Liquid Refreshment Manufacturer Company Profile Ppt Example CP SS V that effortlessly grabs the attention of your audience Begin now and be certain to wow your customers This slide represents net operating revenue spilt by geographical region Europe, Middle East, Africa, Latina America, North America and Asia Pacific.
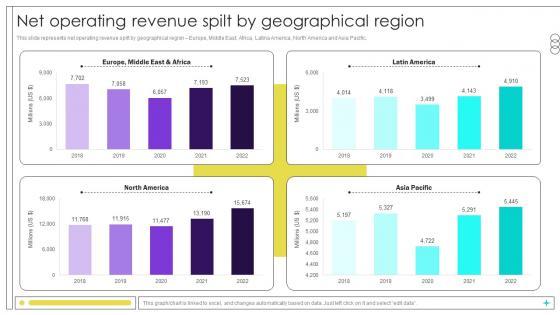
This slide represents net operating revenue spilt by geographical region Europe, Middle East, Africa, Latina America, North America and Asia Pacific. Are you in need of a template that can accommodate all of your creative concepts This one is crafted professionally and can be altered to fit any style. Use it with Google Slides or PowerPoint. Include striking photographs, symbols, depictions, and other visuals. Fill, move around, or remove text boxes as desired. Test out color palettes and font mixtures. Edit and save your work, or work with colleagues. Download Net Operating Revenue Spilt By Geographical Region Beverage Manufacturer Company Profile Ppt Template CP SS V and observe how to make your presentation outstanding. Give an impeccable presentation to your group and make your presentation unforgettable. This slide represents net operating revenue spilt by geographical region Europe, Middle East, Africa, Latina America, North America and Asia Pacific.
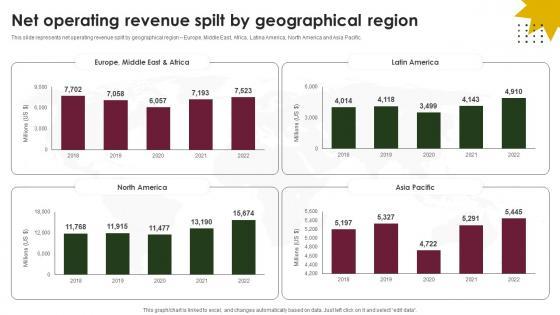

This slide represents net operating revenue spilt by geographical region Europe, Middle East, Africa, Latina America, North America and Asia Pacific.If your project calls for a presentation, then Slidegeeks is your go-to partner because we have professionally designed, easy-to-edit templates that are perfect for any presentation. After downloading, you can easily edit Net Operating Revenue Spilt By Geographical Region Beverage Company Profile CP SS V and make the changes accordingly. You can rearrange slides or fill them with different images. Check out all the handy templates This slide represents net operating revenue spilt by geographical region Europe, Middle East, Africa, Latina America, North America and Asia Pacific.
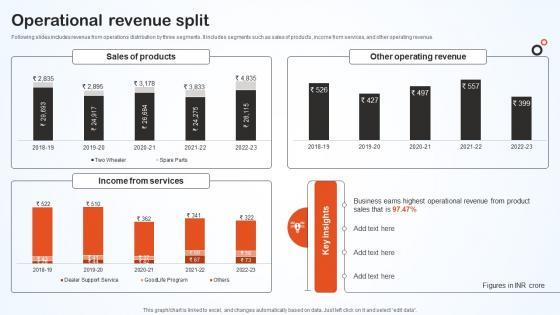

Following slides includes revenue from operations distribution by three segments. It includes segments such as sales of products, income from services, and other operating revenue. Here you can discover an assortment of the finest PowerPoint and Google Slides templates. With these templates, you can create presentations for a variety of purposes while simultaneously providing your audience with an eye-catching visual experience. Download Operational Revenue Split Hero Bike Company Profile CP SS V to deliver an impeccable presentation. These templates will make your job of preparing presentations much quicker, yet still, maintain a high level of quality. Slidegeeks has experienced researchers who prepare these templates and write high-quality content for you. Later on, you can personalize the content by editing the Operational Revenue Split Hero Bike Company Profile CP SS V. Following slides includes revenue from operations distribution by three segments. It includes segments such as sales of products, income from services, and other operating revenue.
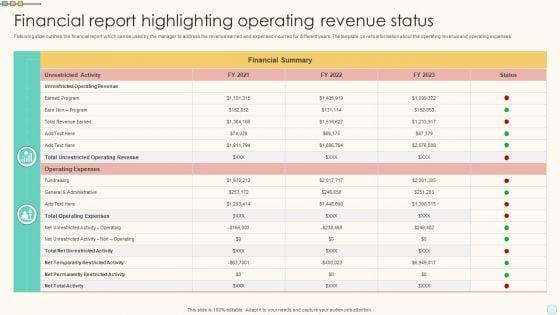
Following slide outlines the financial report which can be used by the manager to address the revenue earned and expensed incurred for different years. The template covers information about the operating revenue and operating expenses. Showcasing this set of slides titled Financial Report Highlighting Operating Revenue Status Rules PDF. The topics addressed in these templates are Operating Expenses, Revenue, Fundraising. All the content presented in this PPT design is completely editable. Download it and make adjustments in color, background, font etc. as per your unique business setting.
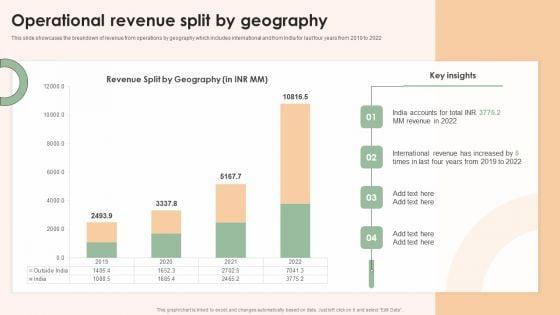

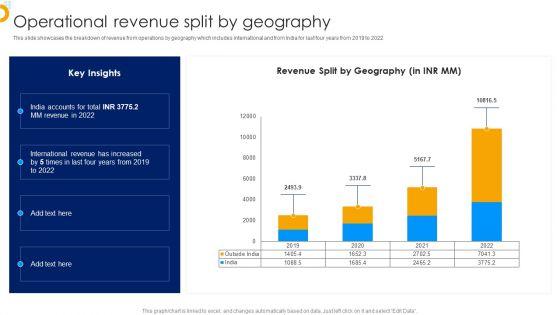
This slide showcases the breakdown of revenue from operations by geography which includes international and from India for last four years from 2019 to 2022 This Online Advertising Firm Business Profile Operational Revenue Split By Geography Elements PDF is perfect for any presentation, be it in front of clients or colleagues. It is a versatile and stylish solution for organizing your meetings. The Online Advertising Firm Business Profile Operational Revenue Split By Geography Elements PDF features a modern design for your presentation meetings. The adjustable and customizable slides provide unlimited possibilities for acing up your presentation. Slidegeeks has done all the homework before launching the product for you. So, do not wait, grab the presentation templates today
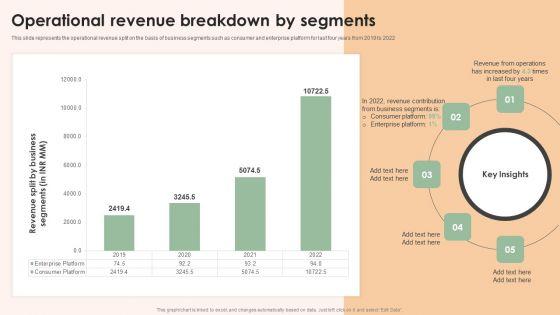

This slide represents the operational revenue split on the basis of business segments such as consumer and enterprise platform for last four years from 2019 to 2022 This modern and well arranged Online Advertising Firm Business Profile Operational Revenue Breakdown By Segments Formats PDF provides lots of creative possibilities. It is very simple to customize and edit with the Powerpoint Software. Just drag and drop your pictures into the shapes. All facets of this template can be edited with Powerpoint no extra software is necessary. Add your own material, put your images in the places assigned for them, adjust the colors, and then you can show your slides to the world, with an animated slide included.
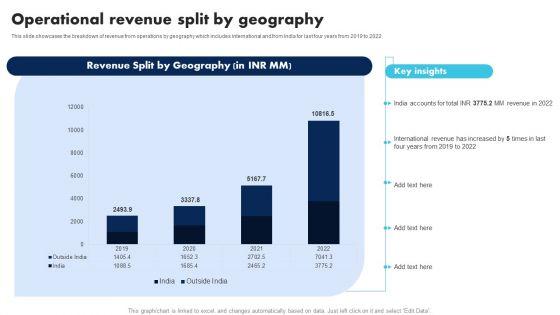

This slide showcases the breakdown of revenue from operations by geography which includes international and from India for last four years from 2019 to 2022 Formulating a presentation can take up a lot of effort and time, so the content and message should always be the primary focus. The visuals of the PowerPoint can enhance the presenters message, so our Information Technology Solutions Company Outline Operational Revenue Split By Geography Formats PDF was created to help save time. Instead of worrying about the design, the presenter can concentrate on the message while our designers work on creating the ideal templates for whatever situation is needed. Slidegeeks has experts for everything from amazing designs to valuable content, we have put everything into Information Technology Solutions Company Outline Operational Revenue Split By Geography Formats PDF
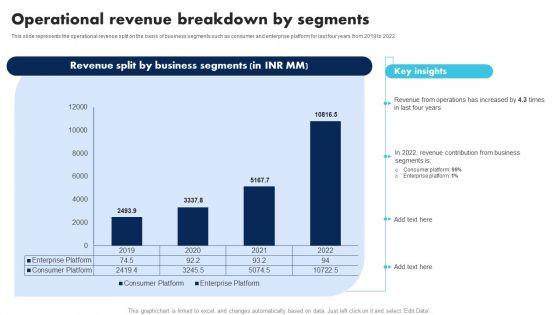
This slide represents the operational revenue split on the basis of business segments such as consumer and enterprise platform for last four years from 2019 to 2022 Make sure to capture your audiences attention in your business displays with our gratis customizable Information Technology Solutions Company Outline Operational Revenue Breakdown By Segments Pictures PDF. These are great for business strategies, office conferences, capital raising or task suggestions. If you desire to acquire more customers for your tech business and ensure they stay satisfied, create your own sales presentation with these plain slides.
33 Item(s)