AI PPT Maker
Templates
PPT Bundles
Design Services
Business PPTs
Business Plan
Management
Strategy
Introduction PPT
Roadmap
Self Introduction
Timelines
Process
Marketing
Agenda
Technology
Medical
Startup Business Plan
Cyber Security
Dashboards
SWOT
Proposals
Education
Pitch Deck
Digital Marketing
KPIs
Project Management
Product Management
Artificial Intelligence
Target Market
Communication
Supply Chain
Google Slides
Research Services
 One Pagers
All Categories
Performance Data PowerPoint Presentation Templates and Google Slides
55 Item(s)


Slide 1 of 11
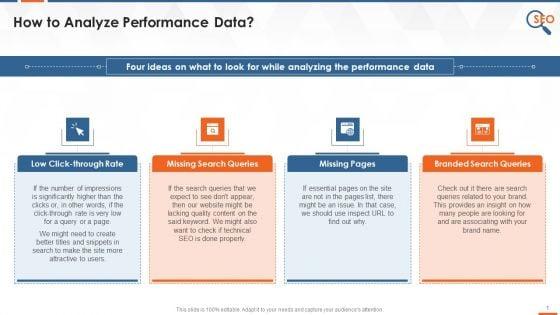
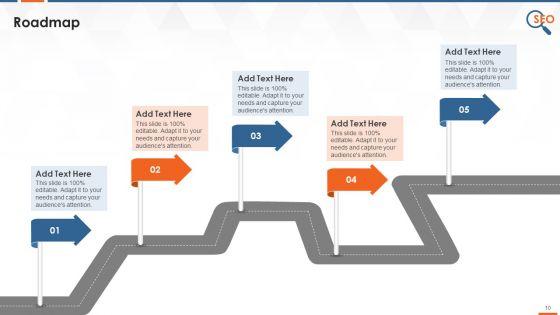
This slide covers four ways to analyze performance data such as Low click-through rate, Missing search queries, missing pages and branded search queries.
Slide 1 of 11
Improve your presentation delivery using this audit icon performing data workplace culture ppt powerpoint presentation complete deck. Support your business vision and objectives using this well-structured PPT deck. This template offers a great starting point for delivering beautifully designed presentations on the topic of your choice. Comprising eleven slides this professionally designed template is all you need to host discussion and meetings with collaborators. Each slide is self-explanatory and equipped with high-quality graphics that can be adjusted to your needs. Therefore, you will face no difficulty in portraying your desired content using this PPT slideshow. This PowerPoint slideshow contains every important element that you need for a great pitch. It is not only editable but also available for immediate download and utilization. The color, font size, background, shapes everything can be modified to create your unique presentation layout. Therefore, download it now.



Slide 1 of 9
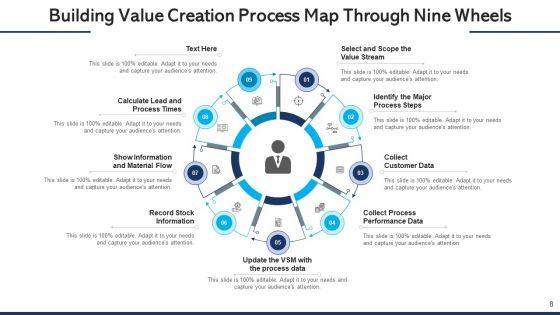
Boost your confidence and team morale with this well-structured building value creation process map performance data ppt powerpoint presentation complete deck with slides. This prefabricated set gives a voice to your presentation because of its well-researched content and graphics. Our experts have added all the components very carefully, thus helping you deliver great presentations with a single click. Not only that, it contains a set of nine slides that are designed using the right visuals, graphics, etc. Various topics can be discussed, and effective brainstorming sessions can be conducted using the wide variety of slides added in this complete deck. Apart from this, our PPT design contains clear instructions to help you restructure your presentations and create multiple variations. The color, format, design anything can be modified as deemed fit by the user. Not only this, it is available for immediate download. So, grab it now.


Slide 1 of 7
This is a performance data detailed data presentation powerpoint. This is a three stage process. The stages in this process are performance data, trend summary data, detailed data.


Slide 1 of 5
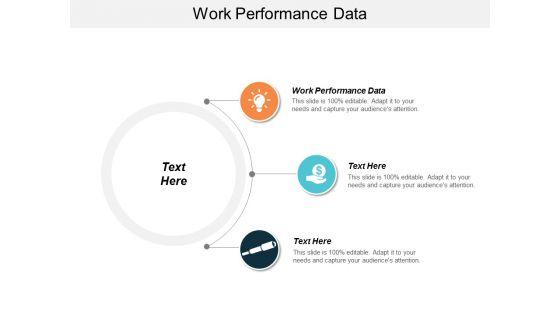
Presenting this set of slides with name work performance data ppt powerpoint presentation show visual aids cpb. This is an editable Powerpoint three stages graphic that deals with topics like work performance data to help convey your message better graphically. This product is a premium product available for immediate download and is 100 percent editable in Powerpoint. Download this now and use it in your presentations to impress your audience.
Slide 1 of 5
Presenting this set of slides with name high performance data intelligence tools ppt powerpoint presentation icon skills cpb. This is an editable Powerpoint five stages graphic that deals with topics like high performance data intelligence tools to help convey your message better graphically. This product is a premium product available for immediate download and is 100 percent editable in Powerpoint. Download this now and use it in your presentations to impress your audience.


Slide 1 of 5
This is a market performance analysis data chart with arrow ppt powerpoint presentation inspiration graphics. This is a four stage process. The stages in this process are marketing analytics, marketing performance, marketing discovery.

Slide 1 of 5
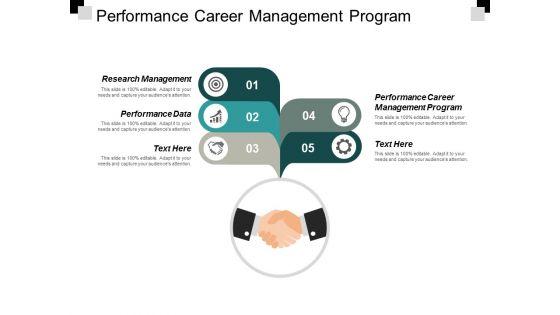
This is a performance career management program research management performance data ppt powerpoint presentation outline design inspiration. This is a fivr stage process. The stages in this process are performance career management program, research management, performance data.


Slide 1 of 5
This is a quality performance improvement data protection ppt powerpoint presentation portfolio grid. This is a three stage process. The stages in this process are quality performance improvement, data protection.


Slide 1 of 5
This is a financial performance analysis data ppt powerpoint presentation topics. This is a three stage process. The stages in this process are finance, percentage, marketing, business, growth.


Slide 1 of 2
Mentioned slide portrays environmental performance data of the company. It covers information about CO2 emission, its intensity and water consumption statistics. Presenting you a fantastic Environmental Performance Data Of The Firm One Pager Documents. This piece is crafted on hours of research and professional design efforts to ensure you have the best resource. It is completely editable and its design allow you to rehash its elements to suit your needs. Get this Environmental Performance Data Of The Firm One Pager Documents A4 One-pager now.
Slide 1 of 2
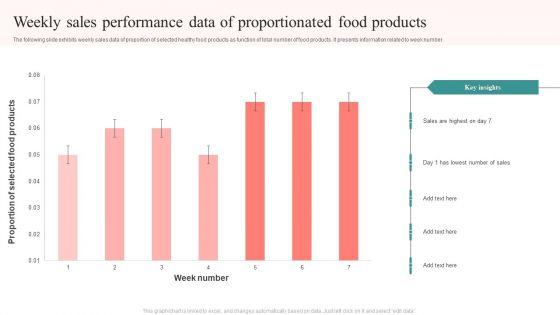
The following slide exhibits weekly sales data of proportion of selected healthy food products as function of total number of food products. It presents information related to week number. Showcasing this set of slides titled Weekly Sales Performance Data Of Proportionated Food Products Structure PDF. The topics addressed in these templates are Proportion Selected, Food Products, Week Number, Sales Highest. All the content presented in this PPT design is completely editable. Download it and make adjustments in color, background, font etc. as per your unique business setting.
Slide 1 of 2
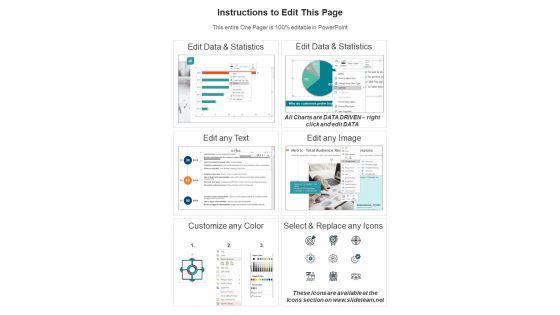
Here we present the Contractor Performance Evaluation Data In One Pager PDF Document PPT Template. This One-pager template includes everything you require. You can edit this document and make changes according to your needs it offers complete freedom of customization. Grab this Contractor Performance Evaluation Data In One Pager PDF Document PPT Template Download now.
Slide 1 of 2
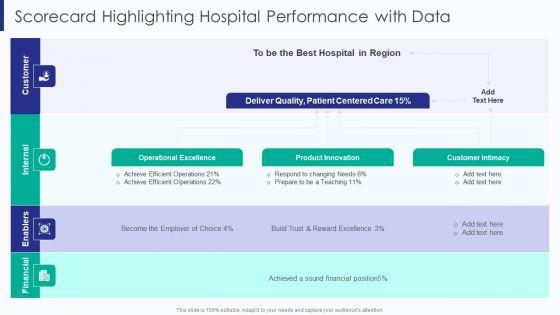
Deliver and pitch your topic in the best possible manner with this Healthcare Scorecard Highlighting Hospital Performance With Data Ppt Summary Example PDF. Use them to share invaluable insights on Deliver Quality Customer, Patient Centered Care, Operational Excellence Product and impress your audience. This template can be altered and modified as per your expectations. So, grab it now.
Slide 1 of 2
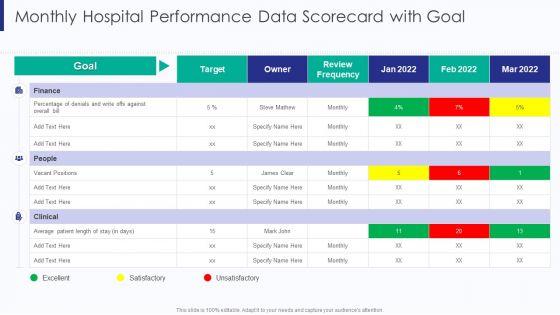
Deliver an awe inspiring pitch with this creative Healthcare Monthly Hospital Performance Data Scorecard With Goal Ppt Show Slides PDF bundle. Topics like Finance Goal Target, Review Frequency Excellent can be discussed with this completely editable template. It is available for immediate download depending on the needs and requirements of the user.

Slide 1 of 2
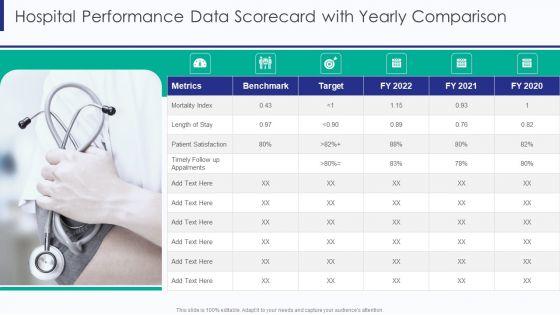
Deliver and pitch your topic in the best possible manner with this Healthcare Hospital Performance Data Scorecard With Yearly Comparison Ppt Model Templates PDF. Use them to share invaluable insights on Mortality Index Metrics, Patient Satisfaction Target, Length Of Stay and impress your audience. This template can be altered and modified as per your expectations. So, grab it now.

Slide 1 of 2
Healthcare Hospital Performance Data Scorecard With Patient Satisfaction Survey Ppt Design Ideas PDF
This graphor chart is linked to excel, and changes automatically based on data. Just left click on it and select Edit Data. Deliver an awe inspiring pitch with this creative Healthcare Hospital Performance Data Scorecard With Patient Satisfaction Survey Ppt Design Ideas PDF bundle. Topics like Average Waiting Times, Lab Test Turnaround, Patient Satisfaction Manner can be discussed with this completely editable template. It is available for immediate download depending on the needs and requirements of the user.


Slide 1 of 2
This graphor chart is linked to excel, and changes automatically based on data. Just left click on it and select Edit Data. Deliver and pitch your topic in the best possible manner with this Healthcare Hospital Performance Data Scorecard With Patient Readmission Rate Ppt Model Objects PDF. Use them to share invaluable insights on Time To Service, Average Patient Satisfaction, Patient Readmission Rate and impress your audience. This template can be altered and modified as per your expectations. So, grab it now.

Slide 1 of 2
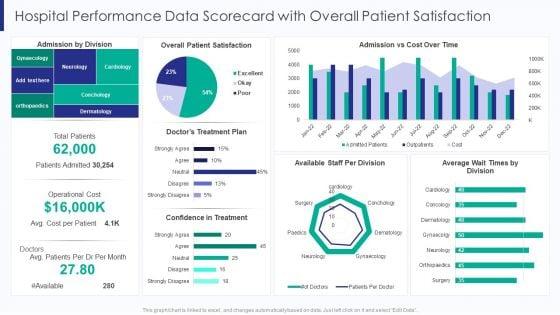
This graphor chart is linked to excel, and changes automatically based on data. Just left click on it and select Edit Data. Deliver an awe inspiring pitch with this creative Healthcare Hospital Performance Data Scorecard With Overall Patient Satisfaction Ppt File Deck PDF bundle. Topics like Overall Patient Satisfaction, Doctors Treatment Plan, Available Staff Per can be discussed with this completely editable template. It is available for immediate download depending on the needs and requirements of the user.

Slide 1 of 2
This graphor chart is linked to excel, and changes automatically based on data. Just left click on it and select Edit Data. Deliver and pitch your topic in the best possible manner with this Healthcare Hospital Performance Data Scorecard With Outpatients And Inpatients Trends Ppt Summary Good PDF. Use them to share invaluable insights on Overall Patient Satisfaction, Outpatients Vs Inpatients, Trend Years 2022 and impress your audience. This template can be altered and modified as per your expectations. So, grab it now.


Slide 1 of 2
This graphor chart is linked to excel, and changes automatically based on data. Just left click on it and select Edit Data. Deliver an awe inspiring pitch with this creative Healthcare Hospital Performance Data Scorecard With Operating Margin Ppt Styles Slideshow PDF bundle. Topics like Operating Margin Cost, Revenue Per Employee, Physician Performance Average, Patient Costs Per can be discussed with this completely editable template. It is available for immediate download depending on the needs and requirements of the user.

Slide 1 of 2
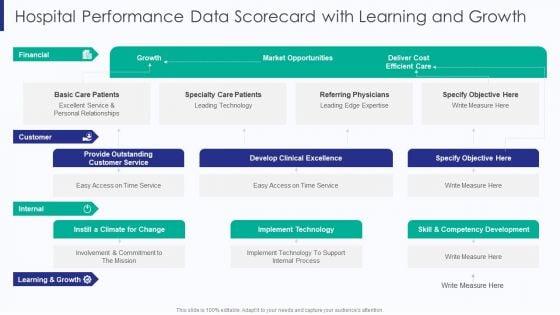
Deliver and pitch your topic in the best possible manner with this Healthcare Hospital Performance Data Scorecard With Learning And Growth Ppt File Vector PDF. Use them to share invaluable insights on Market Opportunities Growth, Deliver Cost Efficient, Care Implement Technology and impress your audience. This template can be altered and modified as per your expectations. So, grab it now.
Slide 1 of 2
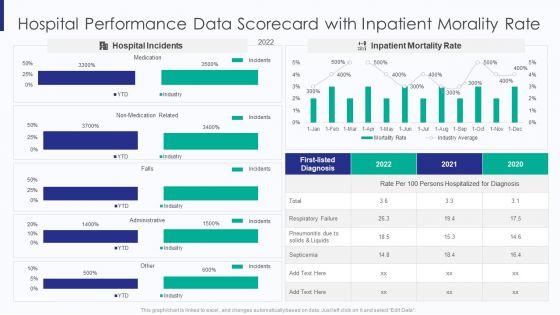
This graphor chart is linked to excel, and changes automatically based on data. Just left click on it and select Edit Data. Deliver an awe inspiring pitch with this creative Healthcare Hospital Performance Data Scorecard With Inpatient Morality Rate Ppt Gallery Designs Download PDF bundle. Topics like Hospital Incidents 2022, Inpatient Mortality Rate can be discussed with this completely editable template. It is available for immediate download depending on the needs and requirements of the user.

Slide 1 of 2
Deliver and pitch your topic in the best possible manner with this Healthcare Hospital Performance Data Scorecard With Financial Perspective Ppt Portfolio Tips PDF. Use them to share invaluable insights on Increase Hospital Revenue, Growth Financial Perspective, Administered Medication Safety and impress your audience. This template can be altered and modified as per your expectations. So, grab it now.

Slide 1 of 2
This graphor chart is linked to excel, and changes automatically based on data. Just left click on it and select Edit Data. Deliver an awe inspiring pitch with this creative Healthcare Hospital Performance Data Scorecard With Bed Occupancy Rate Ppt Professional Graphics Tutorials PDF bundle. Topics like Bed Occupancy Rate, Average Length Stay, Asset Utilization Rate can be discussed with this completely editable template. It is available for immediate download depending on the needs and requirements of the user.
Slide 1 of 2
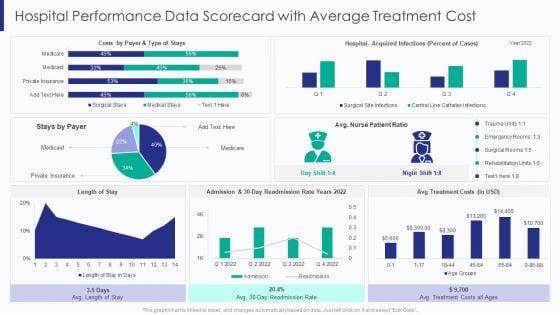
This graph or chart is linked to excel, and changes automatically based on data. Just left click on it and select Edit Data. Deliver and pitch your topic in the best possible manner with this Healthcare Hospital Performance Data Scorecard With Average Treatment Cost Ppt Ideas Guide PDF. Use them to share invaluable insights on Type Of Stays, Stays By Payer, Avg Treatment Costs, 30 Day Readmission and impress your audience. This template can be altered and modified as per your expectations. So, grab it now.
Slide 1 of 2
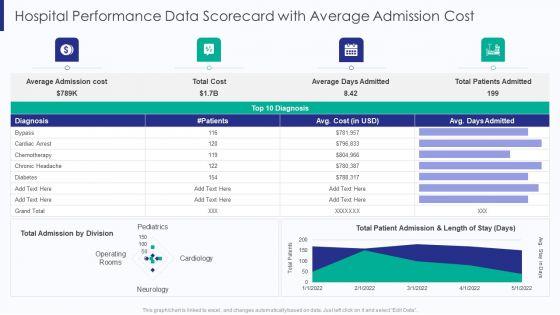
This graph or chart is linked to excel, and changes automatically based on data. Just left click on it and select Edit Data. Deliver an awe inspiring pitch with this creative Healthcare Hospital Performance Data Scorecard With Average Admission Cost Ppt Summary Grid PDF bundle. Topics like Average Admission Cost, Total Cost Patients, Average Days Admitted, Total Patients Admitted can be discussed with this completely editable template. It is available for immediate download depending on the needs and requirements of the user.


Slide 1 of 2
Deliver and pitch your topic in the best possible manner with this Healthcare Department Wise Hospital Performance Data Scorecard Ppt Inspiration Format Ideas PDF. Use them to share invaluable insights on Hospital Department Wise, Score Labour Room, Auxiliary Mortuary Services and impress your audience. This template can be altered and modified as per your expectations. So, grab it now.

Slide 1 of 2
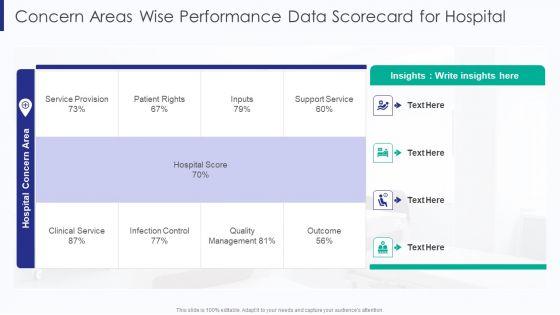
Healthcare Concern Areas Wise Performance Data Scorecard For Hospital Ppt Portfolio Introduction PDF
Deliver an awe inspiring pitch with this creative Healthcare Concern Areas Wise Performance Data Scorecard For Hospital Ppt Portfolio Introduction PDF bundle. Topics like Service Provision Inputs, Clinical Service Infection can be discussed with this completely editable template. It is available for immediate download depending on the needs and requirements of the user.


Slide 1 of 2
The following slide highlights the keywords performance data profiling and analysis dashboard illustrating spend vs cost per click, campaign report, high performing keywords, low performing keywords and advertisement performance Showcasing this set of slides titled keywords performance data mining and analysis dashboard microsoft pdf . The topics addressed in these templates are keywords performance data mining and analysis dashboard . All the content presented in this PPT design is completely editable. Download it and make adjustments in color, background, font etc. as per your unique business setting.


Slide 1 of 2
Following slide displays performance rating data sheet. It includes vendor performance rating in various criterias set by the firm namely delivery, quality, price and reliability performance This is a instigating efficient value process performance rating data sheet designs pdf template with various stages. Focus and dispense information on one stages using this creative set, that comes with editable features. It contains large content boxes to add your information on topics like description, assignment, quality performance. You can also showcase facts, figures, and other relevant content using this PPT layout. Grab it now.


Slide 1 of 2
Following slide displays performance rating data sheet. It includes vendor performance rating in various criterias set by the firm namely delivery, quality, price and reliability performance. Deliver an awe-inspiring pitch with this creative benchmarking supplier operation control procedure performance rating data sheet portrait pdf bundle. Topics like project, assignment, supplier can be discussed with this completely editable template. It is available for immediate download depending on the needs and requirements of the user.


Slide 1 of 2
Following slide displays performance rating data sheet. It includes vendor performance rating in various criterias set by the firm namely delivery, quality, price and reliability performance. This is a benchmarking vendor operation control procedure performance rating data sheet template pdf. template with various stages. Focus and dispense information on five stages using this creative set, that comes with editable features. It contains large content boxes to add your information on topics like price, reliability performance, quality performance, delivery or completion performance, performance parameter. You can also showcase facts, figures, and other relevant content using this PPT layout. Grab it now.

Slide 1 of 2
Following slide displays performance rating data sheet. It includes vendor performance rating in various criterias set by the firm namely delivery, quality, price and reliability performance. Deliver an awe inspiring pitch with this creative inculcating supplier operation improvement plan performance rating data sheet rules pdf bundle. Topics like performance parameter, quality performance, reliability performance, price, delivery completion performance can be discussed with this completely editable template. It is available for immediate download depending on the needs and requirements of the user.
Slide 1 of 2
Presenting this set of slides with name audit officer icon for performing data quality investigation ppt powerpoint presentation file templates pdf. This is a three stage process. The stages in this process are audit officer icon for performing data quality investigation. This is a completely editable PowerPoint presentation and is available for immediate download. Download now and impress your audience.
Slide 1 of 2
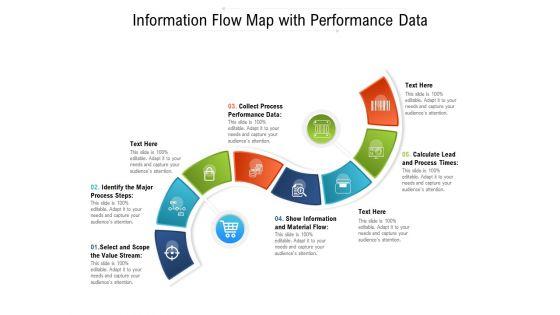
Presenting this set of slides with name information flow map with performance data ppt powerpoint presentation file infographics pdf. This is a five stage process. The stages in this process are process, value, performance. This is a completely editable PowerPoint presentation and is available for immediate download. Download now and impress your audience.


Slide 1 of 2
Presenting this set of slides with name performance management data analytics ppt powerpoint presentation model grid cpb. This is an editable Powerpoint three stages graphic that deals with topics like performance management data analytics to help convey your message better graphically. This product is a premium product available for immediate download and is 100 percent editable in Powerpoint. Download this now and use it in your presentations to impress your audience.


Slide 1 of 9
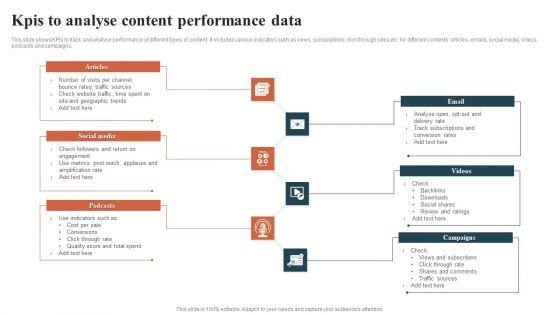
This slide shows KPIs to track and analyse performance of different types of content. It includes various indicators such as views, subscriptions, click through rates etc. for different contents articles, emails, social media, videos, podcasts and campaigns. Persuade your audience using this Kpis To Analyse Content Performance Data Rules PDF. This PPT design covers Six stages, thus making it a great tool to use. It also caters to a variety of topics including Articles, Email, Videos, Campaigns. Download this PPT design now to present a convincing pitch that not only emphasizes the topic but also showcases your presentation skills.


Slide 1 of 9
This slide highlights the pros of conducting data driven testing in software development. The purpose of this slide is to discuss the benefits of data driven testing which include time saving, recyclable tests, etc. Whether you have daily or monthly meetings, a brilliant presentation is necessary. Benefits Of Performing Data Driven Testing Smoke Testing Ppt Presentation can be your best option for delivering a presentation. Represent everything in detail using Benefits Of Performing Data Driven Testing Smoke Testing Ppt Presentation and make yourself stand out in meetings. The template is versatile and follows a structure that will cater to your requirements. All the templates prepared by Slidegeeks are easy to download and edit. Our research experts have taken care of the corporate themes as well. So, give it a try and see the results. This slide highlights the pros of conducting data driven testing in software development. The purpose of this slide is to discuss the benefits of data driven testing which include time saving, recyclable tests, etc.


Slide 1 of 10
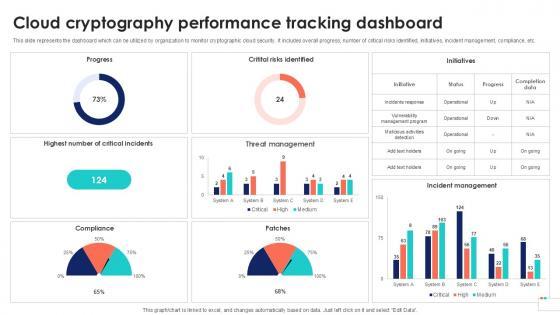
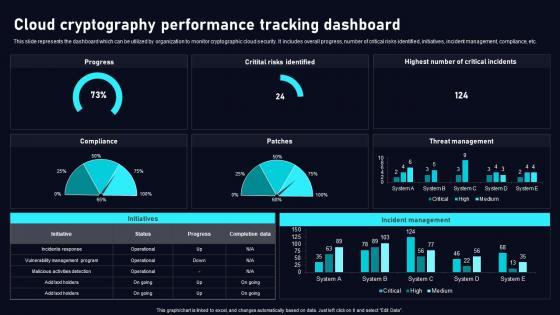
This slide represents the dashboard which can be utilized by organization to monitor cryptographic cloud security. It includes overall progress, number of critical risks identified, initiatives, incident management, compliance, etc. If you are looking for a format to display your unique thoughts, then the professionally designed Cloud Cryptography Performance Data Security In Cloud Computing Ppt Presentation is the one for you. You can use it as a Google Slides template or a PowerPoint template. Incorporate impressive visuals, symbols, images, and other charts. Modify or reorganize the text boxes as you desire. Experiment with shade schemes and font pairings. Alter, share or cooperate with other people on your work. Download Cloud Cryptography Performance Data Security In Cloud Computing Ppt Presentation and find out how to give a successful presentation. Present a perfect display to your team and make your presentation unforgettable. This slide represents the dashboard which can be utilized by organization to monitor cryptographic cloud security. It includes overall progress, number of critical risks identified, initiatives, incident management, compliance, etc.


Slide 1 of 9
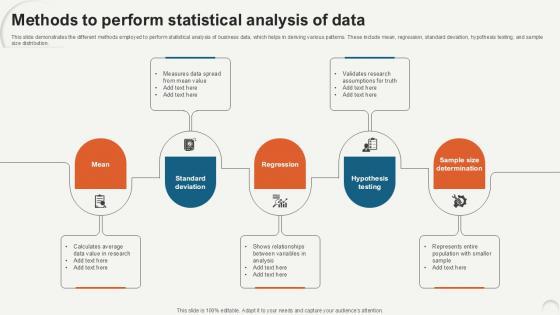
This slide demonstrates the different methods employed to perform statistical analysis of business data, which helps in deriving various patterns. These include mean, regression, standard deviation, hypothesis testing, and sample size distribution. The best PPT templates are a great way to save time, energy, and resources. Slidegeeks have 100 percent editable powerpoint slides making them incredibly versatile. With these quality presentation templates, you can create a captivating and memorable presentation by combining visually appealing slides and effectively communicating your message. Download Methods To Perform Statistical Data Analytics For Informed Decision Ppt Presentation from Slidegeeks and deliver a wonderful presentation. This slide demonstrates the different methods employed to perform statistical analysis of business data, which helps in deriving various patterns. These include mean, regression, standard deviation, hypothesis testing, and sample size distribution.


Slide 1 of 9
This slide represents the checklist to conduct statistical data analysis. The fundamental approaches are writing hypothesis and plan research design, collect data from a sample, summarize data with descriptive statistics, test hypotheses, result interpretation, etc. Get a simple yet stunning designed Checklist To Perform Statistical Data Analytics For Informed Decision Ppt Slide. It is the best one to establish the tone in your meetings. It is an excellent way to make your presentations highly effective. So, download this PPT today from Slidegeeks and see the positive impacts. Our easy-to-edit Checklist To Perform Statistical Data Analytics For Informed Decision Ppt Slide can be your go-to option for all upcoming conferences and meetings. So, what are you waiting for Grab this template today. This slide represents the checklist to conduct statistical data analysis. The fundamental approaches are writing hypothesis and plan research design, collect data from a sample, summarize data with descriptive statistics, test hypotheses, result interpretation, etc.


Slide 1 of 9
This slide outlines the different costs involved in conducting statistical data analysis. The cost categories are software and tools, hardware and infrastructure, data collection and cleaning, personnel, reporting and documentation, data storage, etc. There are so many reasons you need a Budget For Performing Statistical Data Analytics For Informed Decision Ppt Template. The first reason is you can not spend time making everything from scratch, Thus, Slidegeeks has made presentation templates for you too. You can easily download these templates from our website easily. This slide outlines the different costs involved in conducting statistical data analysis. The cost categories are software and tools, hardware and infrastructure, data collection and cleaning, personnel, reporting and documentation, data storage, etc.


Slide 1 of 9
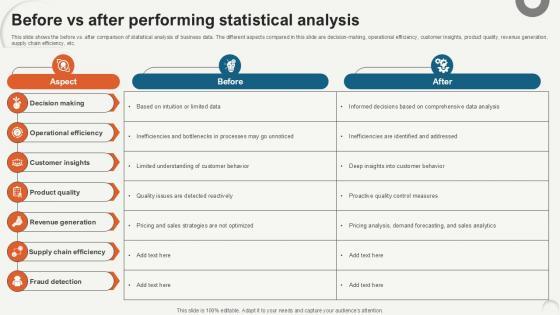
This slide shows the before vs. after comparison of statistical analysis of business data. The different aspects compared in this slide are decision-making, operational efficiency, customer insights, product quality, revenue generation, supply chain efficiency, etc. Create an editable Before Vs After Performing Data Analytics For Informed Decision Ppt Template that communicates your idea and engages your audience. Whether you are presenting a business or an educational presentation, pre-designed presentation templates help save time. Before Vs After Performing Data Analytics For Informed Decision Ppt Template is highly customizable and very easy to edit, covering many different styles from creative to business presentations. Slidegeeks has creative team members who have crafted amazing templates. So, go and get them without any delay. This slide shows the before vs. after comparison of statistical analysis of business data. The different aspects compared in this slide are decision-making, operational efficiency, customer insights, product quality, revenue generation, supply chain efficiency, etc.


Slide 1 of 9
Find a pre-designed and impeccable 30 60 90 Days Plan To Perform Data Analytics For Informed Decision Ppt Slide. The templates can ace your presentation without additional effort. You can download these easy-to-edit presentation templates to make your presentation stand out from others. So, what are you waiting for Download the template from Slidegeeks today and give a unique touch to your presentation. This slide represents 30-60-90 plan to conduct statistical data analysis. The purpose of this slide is to illustrate the plans of the first 90 days from the start of the project including steps to be followed at interval of one month.


Slide 1 of 9
This slide represents the checklist to conduct statistical data analysis. The fundamental approaches are writing hypothesis and plan research design, collect data from a sample, summarize data with descriptive statistics, test hypotheses, result interpretation, etc. Whether you have daily or monthly meetings, a brilliant presentation is necessary. Statistical Tools For Evidence Checklist To Perform Statistical Data Analysis can be your best option for delivering a presentation. Represent everything in detail using Statistical Tools For Evidence Checklist To Perform Statistical Data Analysis and make yourself stand out in meetings. The template is versatile and follows a structure that will cater to your requirements. All the templates prepared by Slidegeeks are easy to download and edit. Our research experts have taken care of the corporate themes as well. So, give it a try and see the results. This slide represents the checklist to conduct statistical data analysis. The fundamental approaches are writing hypothesis and plan research design, collect data from a sample, summarize data with descriptive statistics, test hypotheses, result interpretation, etc.


Slide 1 of 9
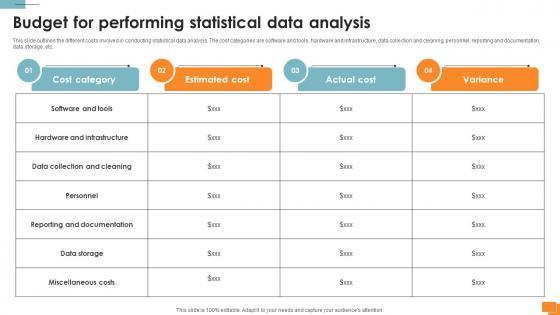
This slide outlines the different costs involved in conducting statistical data analysis. The cost categories are software and tools, hardware and infrastructure, data collection and cleaning, personnel, reporting and documentation, data storage, etc. Slidegeeks is here to make your presentations a breeze with Statistical Tools For Evidence Budget For Performing Statistical Data Analysis With our easy-to-use and customizable templates, you can focus on delivering your ideas rather than worrying about formatting. With a variety of designs to choose from, you are sure to find one that suits your needs. And with animations and unique photos, illustrations, and fonts, you can make your presentation pop. So whether you are giving a sales pitch or presenting to the board, make sure to check out Slidegeeks first This slide outlines the different costs involved in conducting statistical data analysis. The cost categories are software and tools, hardware and infrastructure, data collection and cleaning, personnel, reporting and documentation, data storage, etc.


Slide 1 of 9
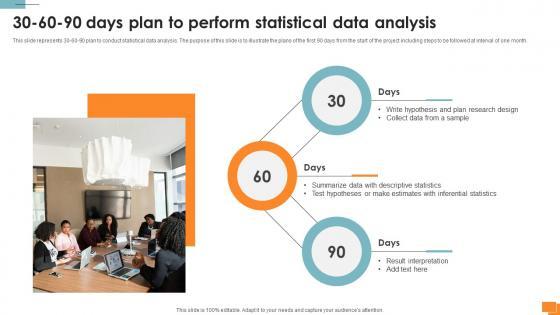
This slide represents 30-60-90 plan to conduct statistical data analysis. The purpose of this slide is to illustrate the plans of the first 90 days from the start of the project including steps to be followed at interval of one month. Do you have to make sure that everyone on your team knows about any specific topic I yes, then you should give Statistical Tools For Evidence 30 60 90 Days Plan To Perform Statistical Data Analysis a try. Our experts have put a lot of knowledge and effort into creating this impeccable Statistical Tools For Evidence 30 60 90 Days Plan To Perform Statistical Data Analysis. You can use this template for your upcoming presentations, as the slides are perfect to represent even the tiniest detail. You can download these templates from the Slidegeeks website and these are easy to edit. So grab these today This slide represents 30-60-90 plan to conduct statistical data analysis. The purpose of this slide is to illustrate the plans of the first 90 days from the start of the project including steps to be followed at interval of one month.


Slide 1 of 9
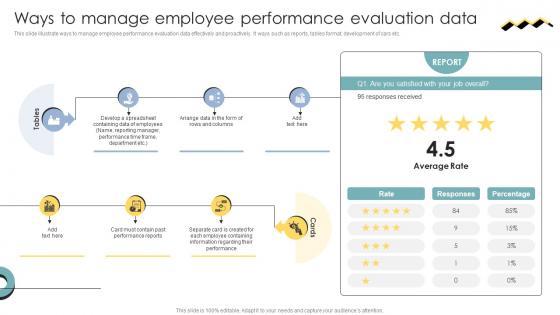
This slide illustrate ways to manage employee performance evaluation data effectively and proactively. It ways such as reports, tables format, development of cars etc. Here you can discover an assortment of the finest PowerPoint and Google Slides templates. With these templates, you can create presentations for a variety of purposes while simultaneously providing your audience with an eye-catching visual experience. Download Skill Enhancement Performance Ways To Manage Employee Performance Evaluation Data to deliver an impeccable presentation. These templates will make your job of preparing presentations much quicker, yet still, maintain a high level of quality. Slidegeeks has experienced researchers who prepare these templates and write high-quality content for you. Later on, you can personalize the content by editing the Skill Enhancement Performance Ways To Manage Employee Performance Evaluation Data. This slide illustrate ways to manage employee performance evaluation data effectively and proactively. It ways such as reports, tables format, development of cars etc.


Slide 1 of 10
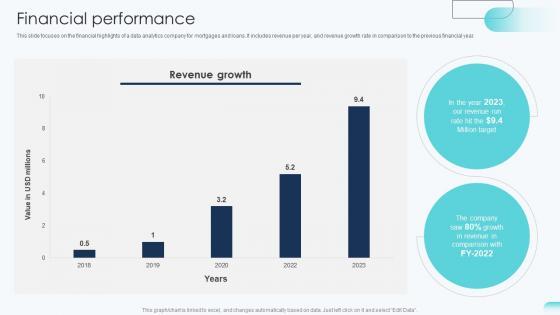
This slide focuses on the financial highlights of a data analytics company for mortgages and loans. It includes revenue per year, and revenue growth rate in comparison to the previous financial year. Present like a pro with Financial Performance Big Data Analytics Investor Funding Elevator Pitch Deck. Create beautiful presentations together with your team, using our easy-to-use presentation slides. Share your ideas in real-time and make changes on the fly by downloading our templates. So whether you are in the office, on the go, or in a remote location, you can stay in sync with your team and present your ideas with confidence. With Slidegeeks presentation got a whole lot easier. Grab these presentations today. This slide focuses on the financial highlights of a data analytics company for mortgages and loans. It includes revenue per year, and revenue growth rate in comparison to the previous financial year.


Slide 1 of 10
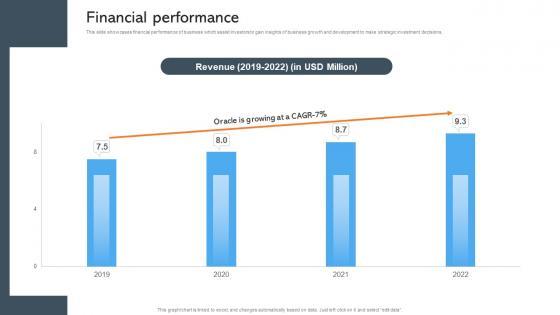
This slide showcases financial performance of business which assist investors to gain insights of business growth and development to make strategic investment decisions. Present like a pro with Financial Performance Data Management Company Investor Funding Pitch Deck. Create beautiful presentations together with your team, using our easy-to-use presentation slides. Share your ideas in real-time and make changes on the fly by downloading our templates. So whether you are in the office, on the go, or in a remote location, you can stay in sync with your team and present your ideas with confidence. With Slidegeeks presentation got a whole lot easier. Grab these presentations today. This slide showcases financial performance of business which assist investors to gain insights of business growth and development to make strategic investment decisions.


Slide 1 of 10
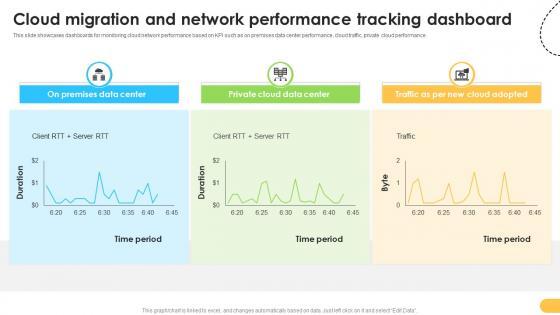
This slide showcases dashboards for monitoring cloud network performance based on KPI such as on premises data center performance, cloud traffic, private cloud performance. Present like a pro with Cloud Migration And Network Performance Data Migration From On Premises. Create beautiful presentations together with your team, using our easy-to-use presentation slides. Share your ideas in real-time and make changes on the fly by downloading our templates. So whether you are in the office, on the go, or in a remote location, you can stay in sync with your team and present your ideas with confidence. With Slidegeeks presentation got a whole lot easier. Grab these presentations today. This slide showcases dashboards for monitoring cloud network performance based on KPI such as on premises data center performance, cloud traffic, private cloud performance.


Slide 1 of 10
This slide represents the dashboard which can be utilized by organization to monitor cryptographic cloud security. It includes overall progress, number of critical risks identified, initiatives, incident management, compliance, etc. Make sure to capture your audiences attention in your business displays with our gratis customizable Cloud Cryptography Performance Cloud Data Security Using Cryptography Sample Pdf. These are great for business strategies, office conferences, capital raising or task suggestions. If you desire to acquire more customers for your tech business and ensure they stay satisfied, create your own sales presentation with these plain slides. This slide represents the dashboard which can be utilized by organization to monitor cryptographic cloud security. It includes overall progress, number of critical risks identified, initiatives, incident management, compliance, etc.


Slide 1 of 10
Mentioned slide showcase the data cloud company annual and quarterly revenue. It includes key components such as annual revenue and quarterly revenue in millions. Present like a pro with Financial Performance Cloud Data Computing Company Fund Raising Information PDF Create beautiful presentations together with your team, using our easy-to-use presentation slides. Share your ideas in real-time and make changes on the fly by downloading our templates. So whether you are in the office, on the go, or in a remote location, you can stay in sync with your team and present your ideas with confidence. With Slidegeeks presentation got a whole lot easier. Grab these presentations today. Mentioned slide showcase the data cloud company annual and quarterly revenue. It includes key components such as annual revenue and quarterly revenue in millions.


Slide 1 of 10
This slide shows the data model performance tracking dashboard. The purpose of this slide is to represent the Information related to the change brought by data models graphically. Present like a pro with Data Model Performance Tracking Data Modeling Approaches For Modern Analytics Formats Pdf Create beautiful presentations together with your team, using our easy to use presentation slides. Share your ideas in real time and make changes on the fly by downloading our templates. So whether you are in the office, on the go, or in a remote location, you can stay in sync with your team and present your ideas with confidence. With Slidegeeks presentation got a whole lot easier. Grab these presentations today. This slide shows the data model performance tracking dashboard. The purpose of this slide is to represent the Information related to the change brought by data models graphically.
55 Item(s)
