AI PPT Maker
Templates
PPT Bundles
Design Services
Business PPTs
Business Plan
Management
Strategy
Introduction PPT
Roadmap
Self Introduction
Timelines
Process
Marketing
Agenda
Technology
Medical
Startup Business Plan
Cyber Security
Dashboards
SWOT
Proposals
Education
Pitch Deck
Digital Marketing
KPIs
Project Management
Product Management
Artificial Intelligence
Target Market
Communication
Supply Chain
Google Slides
Research Services
 One Pagers
All Categories
Performance Graph PowerPoint Presentation Templates and Google Slides
SHOW
- 60
- 120
- 180
DISPLAYING: 60 of 130 Item(s)
Page


Slide 1 of 7
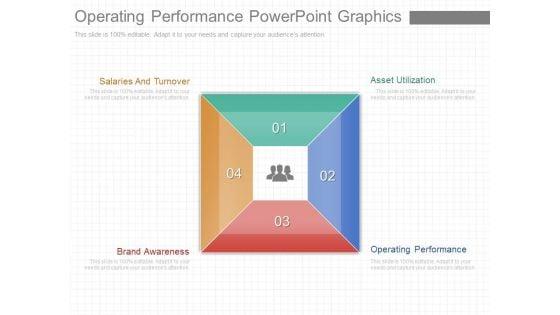
This is a operating performance powerpoint graphics. This is a four stage process. The stages in this process are salaries and turnover, brand awareness, asset utilization, operating performance.
Slide 1 of 5
Presenting this set of slides with name business performance graph on screen icon ppt powerpoint presentation show layouts. This is a three stage process. The stages in this process are data visualization icon, research analysis, business focus. This is a completely editable PowerPoint presentation and is available for immediate download. Download now and impress your audience.
Slide 1 of 5
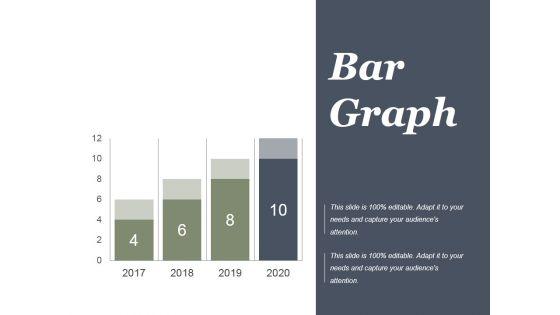
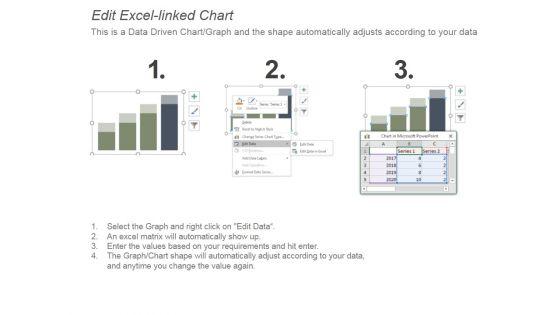
This is a project performance bar graph ppt powerpoint presentation outline. This is a four stage process. The stages in this process are finance, year, business, marketing, future, marketing.



Slide 1 of 5
This is a performance management graph ppt powerpoint presentation template. This is a four stage process. The stages in this process are graph, growth, performance, years, finance.


Slide 1 of 5
This is a channel sales performance graph ppt slide examples. This is a four stage process. The stages in this process are jan, feb, mar, apr, may, jun, jul, aug, sep.


Slide 1 of 3
Performance Graph Business PowerPoint Templates And PowerPoint Themes PPT designs-Microsoft Powerpoint Templates and Background with graph with arrow Promote your views with our Performance Graph Business PowerPoint Templates And PowerPoint Themes 0512. Download without worries with our money back guaranteee.


Slide 1 of 2
The slide outlines the financial performance highlighting the companys revenue and growth in revenue. This modern and well arranged Chat Messenger Investor Funding Elevator Pitch Deck Financial Performance Graphics PDF provides lots of creative possibilities. It is very simple to customize and edit with the Powerpoint Software. Just drag and drop your pictures into the shapes. All facets of this template can be edited with Powerpoint no extra software is necessary. Add your own material, put your images in the places assigned for them, adjust the colors, and then you can show your slides to the world, with an animated slide included.

Slide 1 of 2
Mentioned slide shows comparative assessment of various business sites to determine best performance location. It includes elements such as targeted sales, actual sales and monthly wise sales on sites. Pitch your topic with ease and precision using this Monthly Sites Sales Performance Assessment Graph Designs PDF. This layout presents information on Sales Performance, Sales Targets, Performance Assessment Graph . It is also available for immediate download and adjustment. So, changes can be made in the color, design, graphics or any other component to create a unique layout.
Slide 1 of 2
This slide provides information regarding rebranding performance tracking dashboard in order to track renewed brand. It includes details about total spent, total link clicks, total conversations, etc. Want to ace your presentation in front of a live audience Our Core Components Of Strategic Brand Administration Rebranding Performance Tracking Graphics PDF can help you do that by engaging all the users towards you.. Slidegeeks experts have put their efforts and expertise into creating these impeccable powerpoint presentations so that you can communicate your ideas clearly. Moreover, all the templates are customizable, and easy-to-edit and downloadable. Use these for both personal and commercial use.

Slide 1 of 2
This slide provides glimpse about analysis of PPC advertising campaign and how it can help our business organization for promoting current product lines in the market. It includes weekly PPC response, metrics, current month, previous month, etc. Find a pre designed and impeccable Analyzing Pay Per Click Marketing Campaign Performance Graphics PDF. The templates can ace your presentation without additional effort. You can download these easy to edit presentation templates to make your presentation stand out from others. So, what are you waiting for Download the template from Slidegeeks today and give a unique touch to your presentation.

Slide 1 of 2
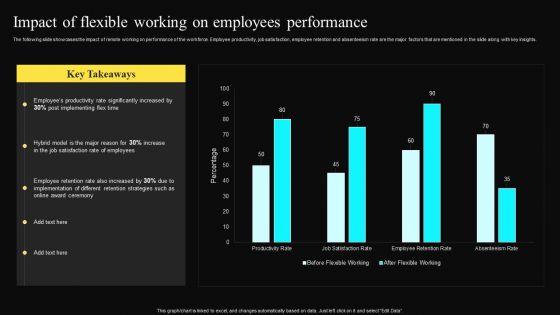
The following slide showcases the impact of remote working on performance of the workforce. Employee productivity, job satisfaction, employee retention and absenteeism rate are the major factors that are mentioned in the slide along with key insights. The best PPT templates are a great way to save time, energy, and resources. Slidegeeks have 100 percent editable powerpoint slides making them incredibly versatile. With these quality presentation templates, you can create a captivating and memorable presentation by combining visually appealing slides and effectively communicating your message. Download Impact Of Flexible Working On Employees Performance Graphics PDF from Slidegeeks and deliver a wonderful presentation.
Slide 1 of 2
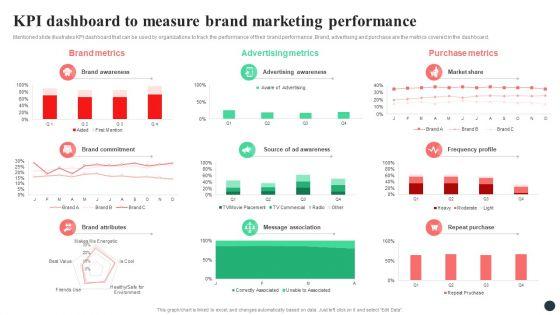
Mentioned slide illustrates KPI dashboard that can be used by organizations to track the performance of their brand performance. Brand, advertising and purchase are the metrics covered in the dashboard. Are you in need of a template that can accommodate all of your creative concepts. This one is crafted professionally and can be altered to fit any style. Use it with Google Slides or PowerPoint. Include striking photographs, symbols, depictions, and other visuals. Fill, move around, or remove text boxes as desired. Test out color palettes and font mixtures. Edit and save your work, or work with colleagues. Download Strategic Guide For Positioning Expanded Brand KPI Dashboard To Measure Brand Marketing Performance Graphics PDF and observe how to make your presentation outstanding. Give an impeccable presentation to your group and make your presentation unforgettable.

Slide 1 of 2
This slide represents website promotion dashboard. It covers total visits, average session duration, bounce rate, page views etc. This Deploying Online Marketing Email Promotion Campaign Dashboard For Performance Graphics PDF is perfect for any presentation, be it in front of clients or colleagues. It is a versatile and stylish solution for organizing your meetings. The Deploying Online Marketing Email Promotion Campaign Dashboard For Performance Graphics PDF features a modern design for your presentation meetings. The adjustable and customizable slides provide unlimited possibilities for acing up your presentation. Slidegeeks has done all the homework before launching the product for you. So, dont wait, grab the presentation templates today.

Slide 1 of 2
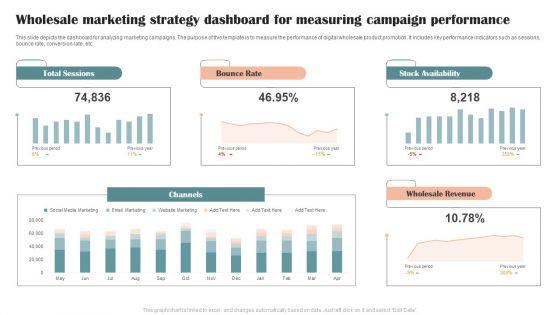
This slide depicts the dashboard for analyzing marketing campaigns. The purpose of this template is to measure the performance of digital wholesale product promotion. It includes key performance indicators such as sessions, bounce rate, conversion rate, etc. Showcasing this set of slides titled Wholesale Marketing Strategy Dashboard For Measuring Campaign Performance Graphics PDF. The topics addressed in these templates are Total Sessions, Bounce Rate, Stock Availability. All the content presented in this PPT design is completely editable. Download it and make adjustments in color, background, font etc. as per your unique business setting.

Slide 1 of 2
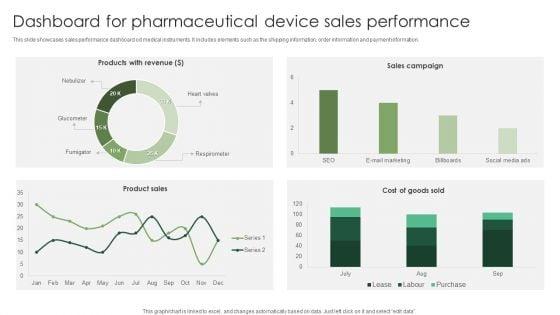
This slide showcases sales performance dashboard od medical instruments. It includes elements such as the shipping information, order information and payment information. Showcasing this set of slides titled Dashboard For Pharmaceutical Device Sales Performance Graphics PDF. The topics addressed in these templates are Pharmaceutical Device, Sales Performance. All the content presented in this PPT design is completely editable. Download it and make adjustments in color, background, font etc. as per your unique business setting.
Slide 1 of 2
This slide represents graph showing key performance indicators tracked by companies for assessment of safety and health performance of their workplace. It includes key metrics such as workforce awareness, safety meetings held, recordable injuries, lost work days, compliance, severity rates etc. Pitch your topic with ease and precision using this Safety And Health Kpis For Tracking Performance Graph Mockup PDF. This layout presents information on Safety And Health, Kpis For Tracking, Performance Graph. It is also available for immediate download and adjustment. So, changes can be made in the color, design, graphics or any other component to create a unique layout.

Slide 1 of 2
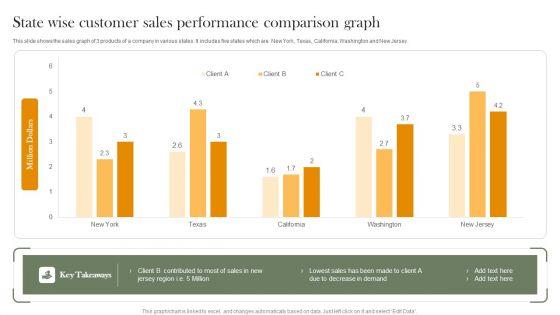
This slide shows the sales graph of 3 products of a company in various states. It includes five states which are New York, Texas, California, Washington and New Jersey. Showcasing this set of slides titled State Wise Customer Sales Performance Comparison Graph Introduction PDF. The topics addressed in these templates are Lowest Sales, Decrease Demand. All the content presented in this PPT design is completely editable. Download it and make adjustments in color, background, font etc. as per your unique business setting.
Slide 1 of 2
This slide shows the customer sales comparison graph along with the units of product purchased by the clients. Showcasing this set of slides titled Sales Performance Comparison Graph Of Top Customer Icons PDF. The topics addressed in these templates are Highest Units, Customer, Product. All the content presented in this PPT design is completely editable. Download it and make adjustments in color, background, font etc. as per your unique business setting.
Slide 1 of 2
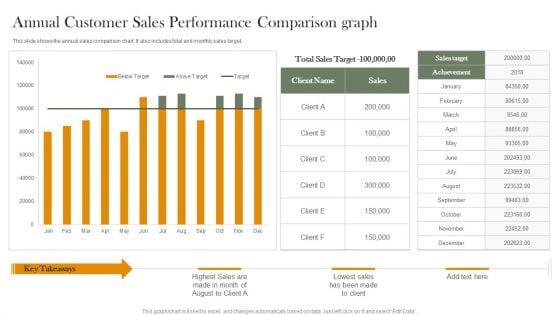
This slide shows the annual sales comparison chart. It also includes total and monthly sales target. Pitch your topic with ease and precision using this Annual Customer Sales Performance Comparison Graph Portrait PDF. This layout presents information on Total Sales Target, Sales Target, Achievement. It is also available for immediate download and adjustment. So, changes can be made in the color, design, graphics or any other component to create a unique layout.

Slide 1 of 2
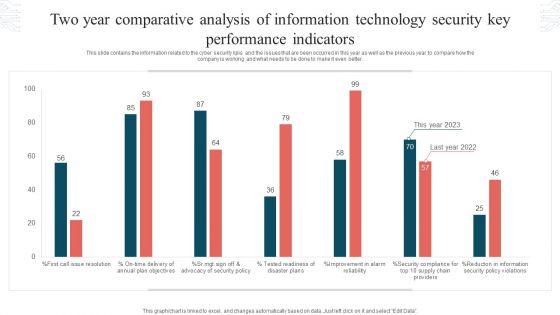
This slide contains the information related to the cyber security kpis and the issues that are been occurred in this year as well as the previous year to compare how the company is working and what needs to be done to make it even better. Showcasing this set of slides titled Two Year Comparative Analysis Of Information Technology Security Key Performance Indicators Graphics PDF. The topics addressed in these templates are Tested Readiness, Disaster Plans, Security Policy Violations. All the content presented in this PPT design is completely editable. Download it and make adjustments in color, background, font etc. as per your unique business setting.

Slide 1 of 2
This slide provides information regarding product launch team performance with key result area scores for idea generation, engineering and design and key result areas performance. From laying roadmaps to briefing everything in detail, our templates are perfect for you. You can set the stage with your presentation slides. All you have to do is download these easy to edit and customizable templates. Merchandise Launch Kickoff Playbook Product Launch Team Performance Dashboard Graphics PDF will help you deliver an outstanding performance that everyone would remember and praise you for. Do download this presentation today.
Slide 1 of 2
This slide covers the KPI dashboard for analyzing the company website. It includes metrics such as conversions, conversion rate, sessions, stickiness, bounce rate, engagement, etc. Showcasing this set of slides titled Consumer Journey Mapping Techniques Dashboard For Tracking Website Performance Graphics PDF. The topics addressed in these templates are Bounce Rate, Organic, Conversions Rate. All the content presented in this PPT design is completely editable. Download it and make adjustments in color, background, font etc. as per your unique business setting.


Slide 1 of 2
This slide highlights the hedge fund performance which includes the HFRI equity hedge, event driven hedge, relative value hedge, HFRI macro and US crop fixed income with return rate. Deliver an awe inspiring pitch with this creative Hedge Fund Performance Over Time Hedge Fund Performance Graphics PDF bundle. Topics like Different Funds Performance, Hedge Fund can be discussed with this completely editable template. It is available for immediate download depending on the needs and requirements of the user.


Slide 1 of 2
This slide shows the current performance of inventory operations providing information regarding customer and predicted demand, excess and deficit values, desired and actual safety stocks in days along with the forecast accuracy.Deliver and pitch your topic in the best possible manner with this Retail Store Inventory Safety Stock Assessment Retail Outlet Operations Performance Evaluation Graphics PDF. Use them to share invaluable insights on Predicted Demand, Customer Demand, Beginning and impress your audience. This template can be altered and modified as per your expectations. So, grab it now.
Slide 1 of 2
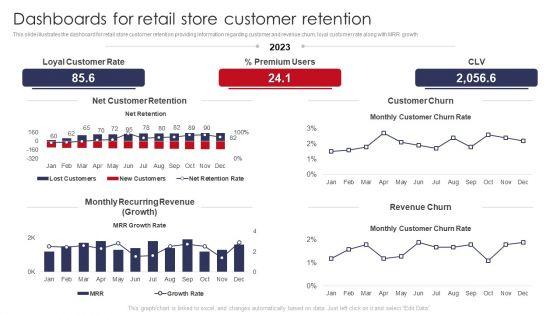
This slide illustrates the dashboard for retail store customer retention providing information regarding customer and revenue churn, loyal customer rate along with MRR growth.Deliver and pitch your topic in the best possible manner with this Dashboards For Retail Store Customer Retention Retail Outlet Operations Performance Evaluation Graphics PDF. Use them to share invaluable insights on Customer Retention, Loyal Customer, Recurring Revenue and impress your audience. This template can be altered and modified as per your expectations. So, grab it now.


Slide 1 of 2
This slide shows performance graph of HR department. Information covered in this slide is related to total hirings and turnover in the last four years. Pitch your topic with ease and precision using this Workforce Department Performance Graph Ppt Model Graphics Pictures PDF. This layout presents information on New Hiring, Continuous Increase, Employee Turnover, 2019 To 2022. It is also available for immediate download and adjustment. So, changes can be made in the color, design, graphics or any other component to create a unique layout.


Slide 1 of 2
This slide shows the impact of automation on sales performance such as increase in lead qualification rate, pipeline thickness, sales forecast accuracy and response rate after sales process automation.Deliver an awe inspiring pitch with this creative Sales Process Automation For Revenue Growth Impact Of Automation On Sales Performance Graphics PDF bundle. Topics like Lead Qualification, Order Management, Marketing Automation can be discussed with this completely editable template. It is available for immediate download depending on the needs and requirements of the user.


Slide 1 of 2
This slide covers the procurement performance benchmarks for the organizations such as spend under management, cost avoidance, vender performance etc. Deliver and pitch your topic in the best possible manner with this Procurement KPI Performance Benchmark Graphics PDF. Use them to share invaluable insights on Cost Savings, Vendor Performance, Total Cost and impress your audience. This template can be altered and modified as per your expectations. So, grab it now.
Slide 1 of 2
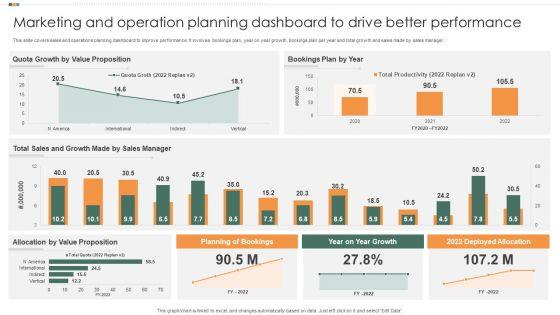
This slide covers sales and operations planning dashboard to improve performance. It involves bookings plan, year on year growth, bookings plan per year and total growth and sales made by sales manager. Showcasing this set of slides titled Marketing And Operation Planning Dashboard To Drive Better Performance Graphics PDF. The topics addressed in these templates are Sales Manager, Growth Made, Bookings Plan By Year. All the content presented in this PPT design is completely editable. Download it and make adjustments in color, background, font etc. as per your unique business setting.
Slide 1 of 2
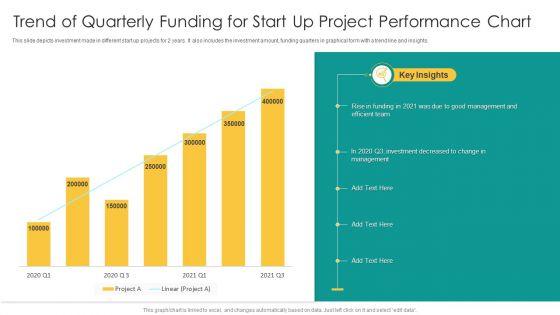
This slide depicts investment made in different start up projects for 2 years. It also includes the investment amount, funding quarters in graphical form with a trend line and insights. Pitch your topic with ease and precision using this Trend Of Quarterly Funding For Start Up Project Performance Chart Graphics PDF. This layout presents information on Good Management, Efficient Team, Investment Decreased. It is also available for immediate download and adjustment. So, changes can be made in the color, design, graphics or any other component to create a unique layout.
Slide 1 of 2
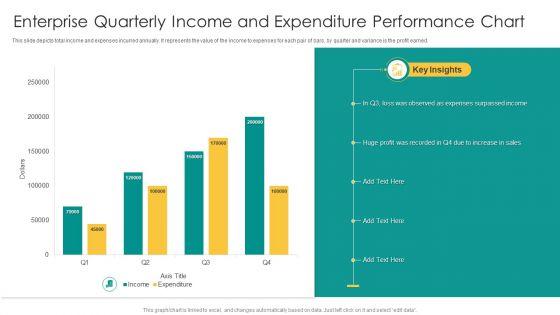
This slide depicts total income and expenses incurred annually. It represents the value of the income to expenses for each pair of bars, by quarter and variance is the profit earned. Pitch your topic with ease and precision using this Enterprise Quarterly Income And Expenditure Performance Chart Graphics PDF. This layout presents information on Expenses Surpassed Income, Sales, Huge Profit. It is also available for immediate download and adjustment. So, changes can be made in the color, design, graphics or any other component to create a unique layout.

Slide 1 of 2
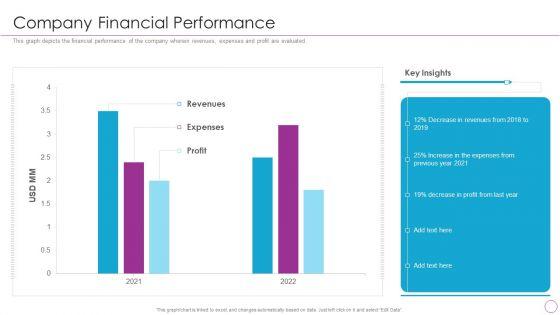
This graph depicts the financial performance of the company wherein revenues, expenses and profit are evaluated.Deliver and pitch your topic in the best possible manner with this Integration Of Digital Technology In Organization Company Financial Performance Graphics PDF Use them to share invaluable insights on Decrease In Revenues, Increase Expenses, Decrease In Profit and impress your audience. This template can be altered and modified as per your expectations. So, grab it now.
Slide 1 of 2
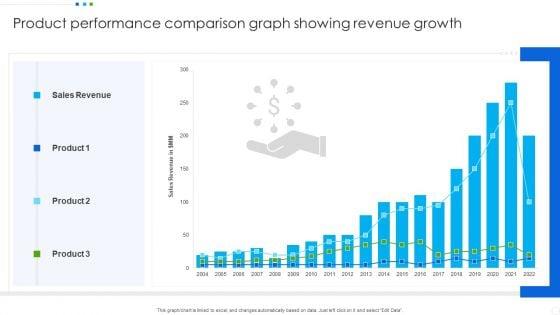
Showcasing this set of slides titled Product Performance Comparison Graph Showing Revenue Growth Portrait PDF. The topics addressed in these templates are Sales Revenue, Product. All the content presented in this PPT design is completely editable. Download it and make adjustments in color, background, font etc. as per your unique business setting.


Slide 1 of 2
The slide shows the engagement scorecard of the employee with desired trend and present trend. The slide also shows the baseline of 2021, quarterly 2022 and average 2022 performance with integrity, accountability, commitment and respect. Showcasing this set of slides titled Employee Engagement Scorecard For Performance Evaluation Graphics PDF. The topics addressed in these templates are Community Service, Accountability, Survey Respondents. All the content presented in this PPT design is completely editable. Download it and make adjustments in color, background, font etc. as per your unique business setting.
Slide 1 of 2
Persuade your audience using this Capacity Allotment Management Icon To Optimize Business Performance Graphics PDF. This PPT design covers three stages, thus making it a great tool to use. It also caters to a variety of topics including Capacity Allotment Management, Optimize Business Performance. Download this PPT design now to present a convincing pitch that not only emphasizes the topic but also showcases your presentation skills.

Slide 1 of 2
Deliver an awe inspiring pitch with this creative Private Capital Scorecard With Nav Performance Graphics PDF bundle. Topics like Asset Allocation, Capital Commitments, Credit Facility can be discussed with this completely editable template. It is available for immediate download depending on the needs and requirements of the user.

Slide 1 of 2
Deliver an awe inspiring pitch with this creative Sales Team Weekly Activity Performance Scorecard Graphics PDF bundle. Topics like Actual Activity, Initial Contacts, Prospect Discussions can be discussed with this completely editable template. It is available for immediate download depending on the needs and requirements of the user.
Slide 1 of 2
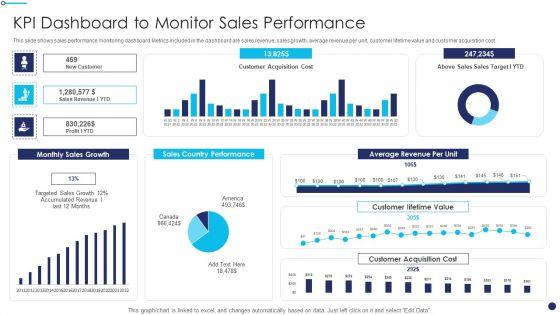
This slide shows sales performance monitoring dashboard. Metrics included in the dashboard are sales revenue, sales growth, average revenue per unit, customer lifetime value and customer acquisition cost.Deliver an awe inspiring pitch with this creative Effective Sales Technique For New Product Launch KPI Dashboard To Monitor Sales Performance Graphics PDF bundle. Topics like Country Performance, Average Revenue, Customer Acquisition can be discussed with this completely editable template. It is available for immediate download depending on the needs and requirements of the user.

Slide 1 of 2
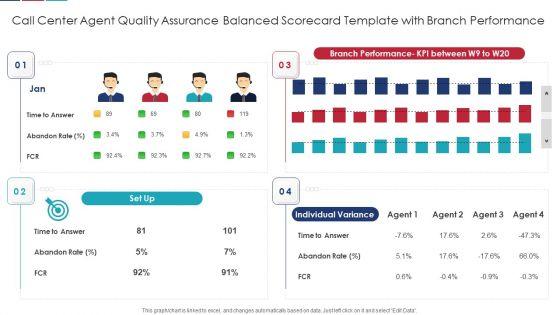
Call Center Agent Quality Assurance Balanced Scorecard Template With Branch Performance Graphics PDF
Deliver and pitch your topic in the best possible manner with this Call Center Agent Quality Assurance Balanced Scorecard Template With Branch Performance Graphics PDF Use them to share invaluable insights on Agent Quality, Assurance Balanced, Scorecard Template and impress your audience. This template can be altered and modified as per your expectations. So, grab it now.

Slide 1 of 2
This slide provides information regarding improved overall performance in terms of increased revenue generation, improved lead generation and enhanced sales and marketing alignment. Deliver an awe inspiring pitch with this creative Defined Sales Assistance For Business Clients Overall Performance Improvement Graphics PDF bundle. Topics like Revenue Generation, Client Engagement Rate, Sales And Marketing Alignment can be discussed with this completely editable template. It is available for immediate download depending on the needs and requirements of the user.


Slide 1 of 2
This slide depicts support team performance dashboard indicating customer solutions delivery status. It provides information about requests, service level, revenue, support costs, customer satisfaction, average time to provide solution, etc. Showcasing this set of slides titled Client Solution Dashboard Indicating Support Team Performance Graphics PDF. The topics addressed in these templates are Costs, Revenue, Customer. All the content presented in this PPT design is completely editable. Download it and make adjustments in color, background, font etc. as per your unique business setting.


Slide 1 of 2
The following slide highlights the ecommerce project development planned performance management illustrating key headings which includes project conception, project planning, project implementation, project management and project closing Presenting E Commerce Website Project Development Plan And Performance Management Graphics PDF to dispense important information. This template comprises five stages. It also presents valuable insights into the topics including Project Planning, Project Implementation, Project Management. This is a completely customizable PowerPoint theme that can be put to use immediately. So, download it and address the topic impactfully.
Slide 1 of 2
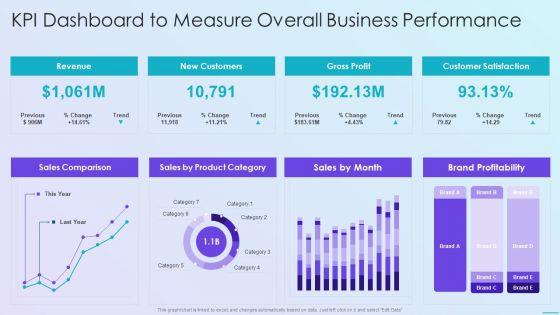
Deliver and pitch your topic in the best possible manner with this playbook for application developers kpi dashboard to measure overall business performance graphics pdf Use them to share invaluable insights on kpi dashboard to measure overall business performance and impress your audience. This template can be altered and modified as per your expectations. So, grab it now.


Slide 1 of 2
The following slide highlights data requirement for employee performance analysis which includes elements such as absenteeism rate, revenue per employee, overtime per employee and efficiency are along with key insights. Pitch your topic with ease and precision using this data requirements for employee performance analytics graphics pdf. This layout presents information on revenue, employee, rate. It is also available for immediate download and adjustment. So, changes can be made in the color, design, graphics or any other component to create a unique layout.


Slide 1 of 2
This slide illustrates Customer Issues dashboard with user experience performance benefiting companies in taking decisions according to customer trends. It also includes information about website net promoter score, customer relationship drivers, customer satisfaction CSAT, customer support and orders. Showcasing this set of slides titled customer issues dashboard with user experience performance graphics pdf. The topics addressed in these templates are customer issues dashboard with user experience performance. All the content presented in this PPT design is completely editable. Download it and make adjustments in color, background, font etc. as per your unique business setting.
Slide 1 of 2
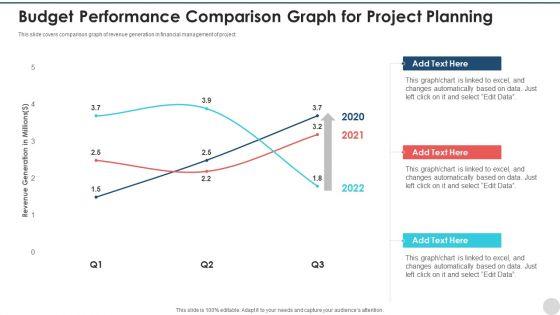
This slide covers comparison graph of revenue generation in financial management of project. Showcasing this set of slides titled budget performance comparison graph for project planning pictures pdf. The topics addressed in these templates are budget performance comparison graph for project planning. All the content presented in this PPT design is completely editable. Download it and make adjustments in color, background, font etc. as per your unique business setting.

Slide 1 of 2
This is a agenda for quality assurance transformation strategies to improve business performance efficiency graphics pdf template with various stages. Focus and dispense information on five stages using this creative set, that comes with editable features. It contains large content boxes to add your information on topics like qa transformation testing tools, cross platform compatibility, customer experience testing. You can also showcase facts, figures, and other relevant content using this PPT layout. Grab it now.

Slide 1 of 2
Showcasing this set of slides titled proportion circle slide for increase sales performance graphics pdf. The topics addressed in these templates are proportion circle slide for increase sales performance. All the content presented in this PPT design is completely editable. Download it and make adjustments in color, background, font etc. as per your unique business setting.
Slide 1 of 2
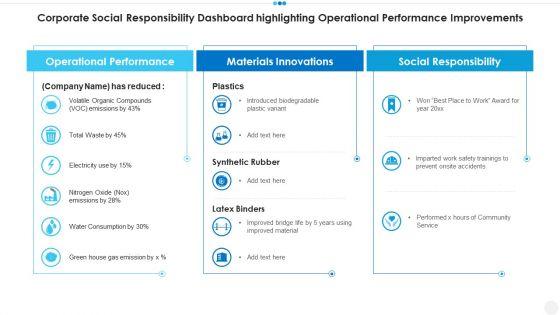
Persuade your audience using this corporate social responsibility dashboard highlighting operational performance improvements graphics pdf. This PPT design covers three stages, thus making it a great tool to use. It also caters to a variety of topics including operational performance, materials innovations, social responsibility. Download this PPT design now to present a convincing pitch that not only emphasizes the topic but also showcases your presentation skills.

Slide 1 of 2
This slide helps in analyzing the performance of different executives representatives. It will help in tracking metrics such as cost per contact, percentage of tickets opened, etc. The staff performance will be assessed on various parameters such as cost, quality, productivity and service level. Deliver and pitch your topic in the best possible manner with this executing advance data analytics at workspace assessing staff performance graphics pdf. Use them to share invaluable insights on assessing staff performance on various parameters and impress your audience. This template can be altered and modified as per your expectations. So, grab it now.


Slide 1 of 2
This slide illustrates sales representative performance measurement dashboard with key metrics such as average first contact resolution rate, occupancy rate, NPS and top agents by solved tickets. Deliver and pitch your topic in the best possible manner with this enhancing stp strategies for a successful market promotion sales rep performance graphics pdf. Use them to share invaluable insights on sales rep performance measuring dashboard and impress your audience. This template can be altered and modified as per your expectations. So, grab it now.
Slide 1 of 2
This slide provides information regarding essential KPIs for ecommerce performance dashboard tracking average bounce rate, new vs. old customers, channel revenue vs. channel acquisitions costs, channel revenue vs. sales, average conversion rate, etc. Deliver an awe inspiring pitch with this creative online business strategy playbook dashboard tracking essential kpis for ecommerce performance graphics pdf bundle. Topics like Dashboard Tracking Essential KPIs for Ecommerce Performance can be discussed with this completely editable template. It is available for immediate download depending on the needs and requirements of the user.
Slide 1 of 2
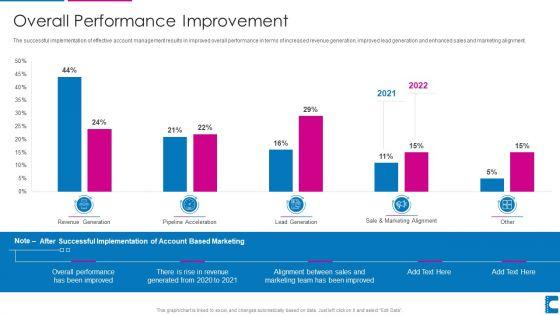
The successful implementation of effective account management results in improved overall performance in terms of increased revenue generation, improved lead generation and enhanced sales and marketing alignment. Deliver an awe inspiring pitch with this creative how to administer accounts to increase sales revenue overall performance improvement graphics pdf bundle. Topics like performance, revenue, sale, marketing team can be discussed with this completely editable template. It is available for immediate download depending on the needs and requirements of the user.


Slide 1 of 2
This slide shows the various objectives of performance coaching such as building new skills in employee, improve employee engagement and retention rate Promoting personal growth and advancement etc. Presenting upskill training for employee performance improvement key objectives of performance coaching graphics pdf to provide visual cues and insights. Share and navigate important information on seven stages that need your due attention. This template can be used to pitch topics like performance, monitoring, growth, effective. In addtion, this PPT design contains high resolution images, graphics, etc, that are easily editable and available for immediate download.
Slide 1 of 2
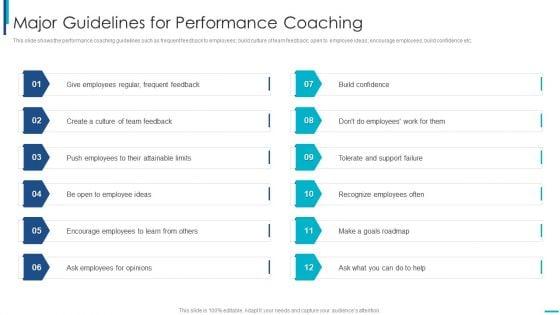
This slide shows the performance coaching guidelines such as frequent feedback to employees build culture of team feedback open to employee ideas encourage employees build confidence etc. This is a skill development training to strengthen employee performance major guidelines for performance coaching graphics pdf template with various stages. Focus and dispense information on twelve stages using this creative set, that comes with editable features. It contains large content boxes to add your information on topics like major guidelines for performance coaching. You can also showcase facts, figures, and other relevant content using this PPT layout. Grab it now.
Slide 1 of 2
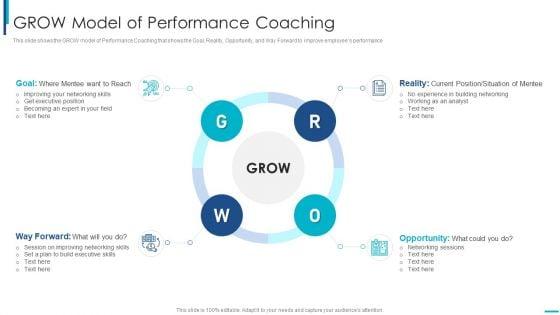
This slide shows the GROW model of Performance Coaching that shows the Goal, Reality, Opportunity, and Way Forward to improve employees performance. Presenting skill development training to strengthen employee performance grow model of performance coaching graphics pdf to provide visual cues and insights. Share and navigate important information on four stages that need your due attention. This template can be used to pitch topics like goal, reality, opportunity, way forward. In addtion, this PPT design contains high resolution images, graphics, etc, that are easily editable and available for immediate download.
Slide 1 of 2
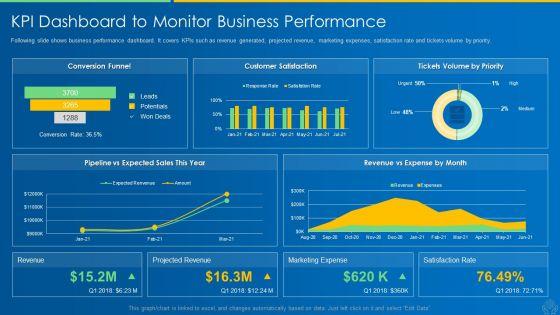
Following slide shows business performance dashboard. It covers KPIs such as revenue generated, projected revenue, marketing expenses, satisfaction rate and tickets volume by priority. Deliver and pitch your topic in the best possible manner with this ai and ml driving monetary value for organization kpi dashboard to monitor business performance graphics pdf. Use them to share invaluable insights on business offerings, current impact, product innovations, customer service and impress your audience. This template can be altered and modified as per your expectations. So, grab it now.

Slide 1 of 2
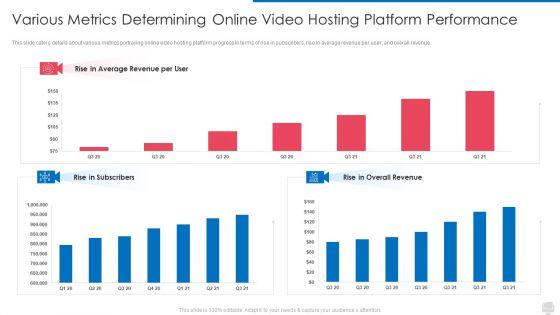
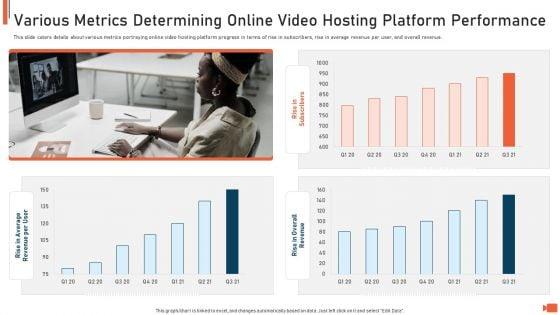
Deliver and pitch your topic in the best possible manner with this various metrics determining online video hosting platform performance graphics pdf. Use them to share invaluable insights on various metrics determining online video hosting platform performance and impress your audience. This template can be altered and modified as per your expectations. So, grab it now.
Slide 1 of 2
This slide caters details about various metrics portraying online video hosting platform progress in terms of rise in subscribers, rise in average revenue per user, and overall revenue. Deliver an awe inspiring pitch with this creative online video streaming site capital raising elevator various metrics determining online video hosting platform performance graphics pdf bundle. Topics like rise in overall revenue, rise in subscribers, rise in average revenue per user can be discussed with this completely editable template. It is available for immediate download depending on the needs and requirements of the user.
Slide 1 of 2
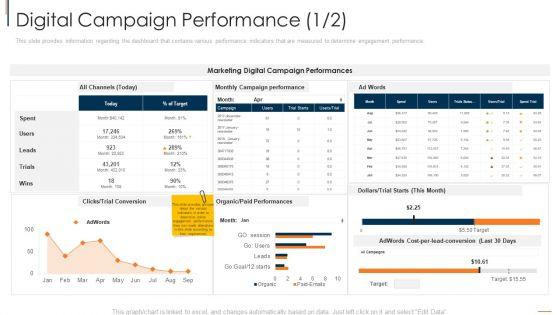
This slide provides information regarding the dashboard that contains various performance indicators that are measured to determine engagement performance. Deliver an awe inspiring pitch with this creative online consumer engagement digital campaign performance target graphics pdf bundle. Topics like performances, marketing digital, target can be discussed with this completely editable template. It is available for immediate download depending on the needs and requirements of the user.
SHOW
- 60
- 120
- 180
DISPLAYING: 60 of 130 Item(s)
Page
