 AI PPT Maker
 Templates
 PPT Bundles
 Design Services
 Business PPTs
 Business Plan
 Management
 Strategy
 Introduction PPT
 Roadmap
 Self Introduction
 Timelines
 Process
 Marketing
 Agenda
 Technology
 Medical
 Startup Business Plan
 Cyber Security
 Dashboards
 SWOT
SWOT Proposals
 Education
 Pitch Deck
 Digital Marketing
 KPIs
KPIs Project Management
 Product Management
 Artificial Intelligence
 Target Market
 Communication
 Supply Chain
 Google Slides
 Research Services
 One Pagers
 All Categories
Performance-and-monitoring PowerPoint Presentation Templates and Google Slides
28 Item(s)
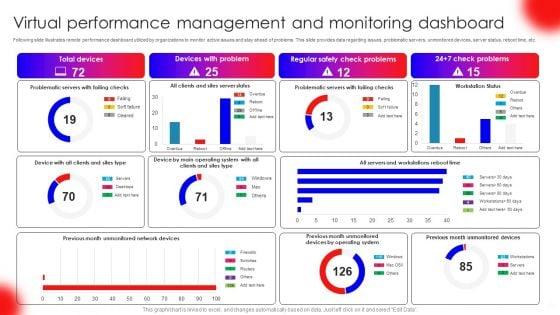
Following slide illustrates remote performance dashboard utilized by organizations to monitor active issues and stay ahead of problems. This slide provides data regarding issues, problematic servers, unmonitored devices, server status, reboot time, etc. Pitch your topic with ease and precision using this Virtual Performance Management And Monitoring Dashboard Pictures PDF. This layout presents information on Total Devices, Devices With Problem, Regular Safety Check Problems. It is also available for immediate download and adjustment. So, changes can be made in the color, design, graphics or any other component to create a unique layout.
The following slide showcases a dashboard to track and measure website performance. It includes key elements such as visits, average session duration, bounce rate, page views, goal conversion, visits by week, traffic sources, top channels by conversions, etc. From laying roadmaps to briefing everything in detail, our templates are perfect for you. You can set the stage with your presentation slides. All you have to do is download these easy to edit and customizable templates. Process Enhancement Plan To Boost Sales Performance Website Performance Tracking And Monitoring Dashboard Diagrams PDF will help you deliver an outstanding performance that everyone would remember and praise you for. Do download this presentation today.
The following slide showcases a dashboard to track and measure social media platforms performance. It includes key elements such as website traffic, social media referral rate, site revenue, social media site revenue, etc. Get a simple yet stunning designed Process Enhancement Plan To Boost Sales Performance Social Media Performance Tracking And Monitoring Dashboard Elements PDF. It is the best one to establish the tone in your meetings. It is an excellent way to make your presentations highly effective. So, download this PPT today from Slidegeeks and see the positive impacts. Our easy to edit Process Enhancement Plan To Boost Sales Performance Social Media Performance Tracking And Monitoring Dashboard Elements PDF can be your go-to option for all upcoming conferences and meetings. So, what are you waiting for Grab this template today.
This slide showcases a dashboard presenting various metrics to measure and analyze sales performance for revenue growth. It includes key components such as number of sales, revenue, profit, cost, sales revenue, sales increment, cost analysis and cross sell. Create an editable Process Enhancement Plan To Boost Sales Performance Monthly Sales Performance Tracking And Monitoring Dashboard Professional PDF that communicates your idea and engages your audience. Whether youre presenting a business or an educational presentation, pre designed presentation templates help save time. Process Enhancement Plan To Boost Sales Performance Monthly Sales Performance Tracking And Monitoring Dashboard Professional PDF is highly customizable and very easy to edit, covering many different styles from creative to business presentations. Slidegeeks has creative team members who have crafted amazing templates. So, go and get them without any delay.


This slide highlights the IoT-based manufacturing asset performance management applications or software which includes the benefits and advantages with key facts. This Iot Applications For Manufacturing Industry Iot In Asset Performance Management And Monitoring Diagrams PDF from Slidegeeks makes it easy to present information on your topic with precision. It provides customization options, so you can make changes to the colors, design, graphics, or any other component to create a unique layout. It is also available for immediate download, so you can begin using it right away. Slidegeeks has done good research to ensure that you have everything you need to make your presentation stand out. Make a name out there for a brilliant performance.
Presenting Performance Management And Monitoring Icon Template PDF to dispense important information. This template comprises three stages. It also presents valuable insights into the topics including Performance Management, Monitoring Icon. This is a completely customizable PowerPoint theme that can be put to use immediately. So, download it and address the topic impactfully.


This slide showcases the performance tracking dashboard for tokenization. The purpose of this slide is to highlight the performance of tokenization by including components such as key management, crypto, tokenize, etc. Find a pre-designed and impeccable Tokenization Performance Recording And Monitoring Dashboard PPT Example. The templates can ace your presentation without additional effort. You can download these easy-to-edit presentation templates to make your presentation stand out from others. So, what are you waiting for Download the template from Slidegeeks today and give a unique touch to your presentation. This slide showcases the performance tracking dashboard for tokenization. The purpose of this slide is to highlight the performance of tokenization by including components such as key management, crypto, tokenize, etc.


This slide showcases the performance tracking dashboard for nanorobotics. The purpose of this slide is to highlight the performance of nanorobots by including components such as top three applications, users and so on. Boost your pitch with our creative Nanorobotics Performance Measuring And Monitoring PPT Slides. Deliver an awe-inspiring pitch that will mesmerize everyone. Using these presentation templates you will surely catch everyones attention. You can browse the ppts collection on our website. We have researchers who are experts at creating the right content for the templates. So you do not have to invest time in any additional work. Just grab the template now and use them. This slide showcases the performance tracking dashboard for nanorobotics. The purpose of this slide is to highlight the performance of nanorobots by including components such as top three applications, users and so on.
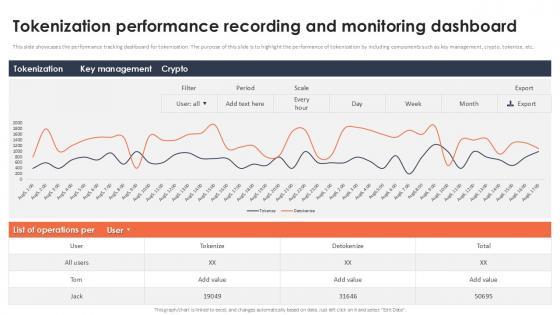
This slide showcases the performance tracking dashboard for tokenization. The purpose of this slide is to highlight the performance of tokenization by including components such as key management, crypto, tokenize, etc. Do you have an important presentation coming up Are you looking for something that will make your presentation stand out from the rest Look no further than Tokenization Performance Recording And Monitoring Dashboard Securing Your Data Ppt Slide With our professional designs, you can trust that your presentation will pop and make delivering it a smooth process. And with Slidegeeks, you can trust that your presentation will be unique and memorable. So why wait Grab Tokenization Performance Recording And Monitoring Dashboard Securing Your Data Ppt Slide today and make your presentation stand out from the rest This slide showcases the performance tracking dashboard for tokenization. The purpose of this slide is to highlight the performance of tokenization by including components such as key management, crypto, tokenize, etc.
The following slide showcases a dashboard to track and measure website performance. It includes key elements such as visits, average session duration, bounce rate, page views, goal conversion, visits by week, traffic sources, top channels by conversions, etc. Find a pre-designed and impeccable Performance Enhancement Plan Website Performance Tracking And Monitoring Professional Pdf. The templates can ace your presentation without additional effort. You can download these easy-to-edit presentation templates to make your presentation stand out from others. So, what are you waiting for Download the template from Slidegeeks today and give a unique touch to your presentation. The following slide showcases a dashboard to track and measure website performance. It includes key elements such as visits, average session duration, bounce rate, page views, goal conversion, visits by week, traffic sources, top channels by conversions, etc.
This slide showcases a dashboard presenting various metrics to measure and analyze sales performance for revenue growth. It includes key components such as number of sales, revenue, profit, cost, sales revenue, sales increment, cost analysis and cross sell. Coming up with a presentation necessitates that the majority of the effort goes into the content and the message you intend to convey. The visuals of a PowerPoint presentation can only be effective if it supplements and supports the story that is being told. Keeping this in mind our experts created Performance Enhancement Plan Monthly Sales Performance Tracking And Monitoring Portrait Pdf to reduce the time that goes into designing the presentation. This way, you can concentrate on the message while our designers take care of providing you with the right template for the situation. This slide showcases a dashboard presenting various metrics to measure and analyze sales performance for revenue growth. It includes key components such as number of sales, revenue, profit, cost, sales revenue, sales increment, cost analysis and cross sell.
The following slide showcases a dashboard to track and measure website performance. It includes key elements such as visits, average session duration, bounce rate, page views, goal conversion, visits by week, traffic sources,top channels by conversions, etc.If your project calls for a presentation, then Slidegeeks is your go-to partner because we have professionally designed, easy-to-edit templates that are perfect for any presentation. After downloading, you can easily edit Website Performance Tracking And Monitoring Implementing Strategies To Improve Structure Pdf and make the changes accordingly. You can rearrange slides or fill them with different images. Check out all the handy templates The following slide showcases a dashboard to track and measure website performance. It includes key elements such as visits, average session duration, bounce rate, page views, goal conversion, visits by week, traffic sources,top channels by conversions, etc.
The following slide showcases a dashboard to track and measure social media platforms performance. It includes key elements such as website traffic, social media referral rate, site revenue, social media site revenue, etc. This Social Media Performance Tracking And Monitoring Implementing Strategies To Improve Template Pdf from Slidegeeks makes it easy to present information on your topic with precision. It provides customization options, so you can make changes to the colors, design, graphics, or any other component to create a unique layout. It is also available for immediate download, so you can begin using it right away. Slidegeeks has done good research to ensure that you have everything you need to make your presentation stand out. Make a name out there for a brilliant performance. The following slide showcases a dashboard to track and measure social media platforms performance. It includes key elements such as website traffic, social media referral rate, site revenue, social media site revenue, etc.
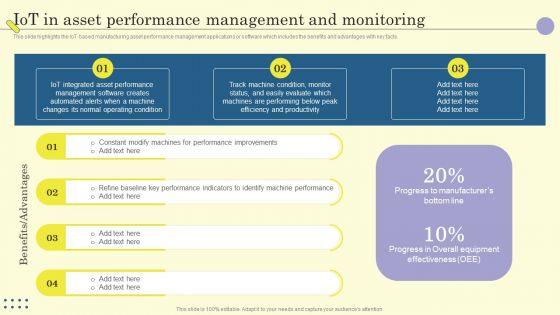
This slide highlights the IoT-based manufacturing asset performance management applications or software which includes the benefits and advantages with key facts. The best PPT templates are a great way to save time, energy, and resources. Slidegeeks have 100 percent editable powerpoint slides making them incredibly versatile. With these quality presentation templates, you can create a captivating and memorable presentation by combining visually appealing slides and effectively communicating your message. Download Internet Of Things In Manufacturing Sector Iot In Asset Performance Management And Monitoring Formats PDF from Slidegeeks and deliver a wonderful presentation.

This slide highlights the IoT-based manufacturing asset performance management applications or software which includes the benefits and advantages with key facts. Coming up with a presentation necessitates that the majority of the effort goes into the content and the message you intend to convey. The visuals of a PowerPoint presentation can only be effective if it supplements and supports the story that is being told. Keeping this in mind our experts created IOT Use Cases For Manufacturing IOT In Asset Performance Management And Monitoring Template PDF to reduce the time that goes into designing the presentation. This way, you can concentrate on the message while our designers take care of providing you with the right template for the situation.
This slide showcases a dashboard presenting various metrics to measure and analyze sales performance for revenue growth. It includes key components such as number of sales, revenue, profit, cost, sales revenue, sales increment, cost analysis and cross sell. Coming up with a presentation necessitates that the majority of the effort goes into the content and the message you intend to convey. The visuals of a PowerPoint presentation can only be effective if it supplements and supports the story that is being told. Keeping this in mind our experts created Monthly Sales Performance Tracking And Monitoring Dashboard Inspiration PDF to reduce the time that goes into designing the presentation. This way, you can concentrate on the message while our designers take care of providing you with the right template for the situation.
The following slide showcases a dashboard to track and measure website performance. It includes key elements such as visits, average session duration, bounce rate, page views, goal conversion, visits by week, traffic sources, top channels by conversions, etc. Whether you have daily or monthly meetings, a brilliant presentation is necessary. Website Performance Tracking And Monitoring Dashboard Ppt Slides Files PDF can be your best option for delivering a presentation. Represent everything in detail using Website Performance Tracking And Monitoring Dashboard Ppt Slides Files PDF and make yourself stand out in meetings. The template is versatile and follows a structure that will cater to your requirements. All the templates prepared by Slidegeeks are easy to download and edit. Our research experts have taken care of the corporate themes as well. So, give it a try and see the results.
The following slide showcases a dashboard to track and measure social media platforms performance. It includes key elements such as website traffic, social media referral rate, site revenue, social media site revenue, etc. The Social Media Performance Tracking And Monitoring Dashboard Graphics PDF is a compilation of the most recent design trends as a series of slides. It is suitable for any subject or industry presentation, containing attractive visuals and photo spots for businesses to clearly express their messages. This template contains a variety of slides for the user to input data, such as structures to contrast two elements, bullet points, and slides for written information. Slidegeeks is prepared to create an impression.
The following slide showcases a dashboard to track and measure website performance. It includes key elements such as visits, average session duration, bounce rate, page views, goal conversion, visits by week, traffic sources, top channels by conversions, etc. Explore a selection of the finest Website Performance Tracking And Monitoring Dashboard Designs PDF here. With a plethora of professionally designed and pre made slide templates, you can quickly and easily find the right one for your upcoming presentation. You can use our Website Performance Tracking And Monitoring Dashboard Designs PDF to effectively convey your message to a wider audience. Slidegeeks has done a lot of research before preparing these presentation templates. The content can be personalized and the slides are highly editable. Grab templates today from Slidegeeks.
The following slide showcases a dashboard to track and measure social media platforms performance. It includes key elements such as website traffic, social media referral rate, site revenue, social media site revenue, etc. This Social Media Performance Tracking And Monitoring Dashboard Information PDF is perfect for any presentation, be it in front of clients or colleagues. It is a versatile and stylish solution for organizing your meetings. The product features a modern design for your presentation meetings. The adjustable and customizable slides provide unlimited possibilities for acing up your presentation. Slidegeeks has done all the homework before launching the product for you. So, do not wait, grab the presentation templates today
This slide showcases a dashboard presenting various metrics to measure and analyze sales performance for revenue growth. It includes key components such as number of sales, revenue, profit, cost, sales revenue, sales increment, cost analysis and cross sell. Make sure to capture your audiences attention in your business displays with our gratis customizable Monthly Sales Performance Tracking And Monitoring Dashboard Designs PDF. These are great for business strategies, office conferences, capital raising or task suggestions. If you desire to acquire more customers for your tech business and ensure they stay satisfied, create your own sales presentation with these plain slides.
The following slide showcases a dashboard to track and measure website performance. It includes key elements such as visits, average session duration, bounce rate, page views, goal conversion, visits by week, traffic sources, top channels by conversions, etc. Do you have to make sure that everyone on your team knows about any specific topic I yes, then you should give Website Performance Tracking And Monitoring Dashboard Ppt Summary Rules PDF a try. Our experts have put a lot of knowledge and effort into creating this impeccable Website Performance Tracking And Monitoring Dashboard Ppt Summary Rules PDF. You can use this template for your upcoming presentations, as the slides are perfect to represent even the tiniest detail. You can download these templates from the Slidegeeks website and these are easy to edit. So grab these today.
The following slide showcases a dashboard to track and measure social media platforms performance. It includes key elements such as website traffic, social media referral rate, site revenue, social media site revenue, etc. There are so many reasons you need a Social Media Performance Tracking And Monitoring Dashboard Ppt Portfolio Gallery PDF. The first reason is you can not spend time making everything from scratch, Thus, Slidegeeks has made presentation templates for you too. You can easily download these templates from our website easily.
This slide showcases a dashboard presenting various metrics to measure and analyze sales performance for revenue growth. It includes key components such as number of sales, revenue, profit, cost, sales revenue, sales increment, cost analysis and cross sell. Do you have to make sure that everyone on your team knows about any specific topic I yes, then you should give Monthly Sales Performance Tracking And Monitoring Dashboard Sample PDF a try. Our experts have put a lot of knowledge and effort into creating this impeccable Monthly Sales Performance Tracking And Monitoring Dashboard Sample PDF. You can use this template for your upcoming presentations, as the slides are perfect to represent even the tiniest detail. You can download these templates from the Slidegeeks website and these are easy to edit. So grab these today.
The following slide showcases a dashboard to track and measure website performance. It includes key elements such as visits, average session duration, bounce rate, page views, goal conversion, visits by week, traffic sources, top channels by conversions, etc. Welcome to our selection of the Website Performance Tracking And Monitoring Dashboard Inspiration PDF. These are designed to help you showcase your creativity and bring your sphere to life. Planning and Innovation are essential for any business that is just starting out. This collection contains the designs that you need for your everyday presentations. All of our PowerPoints are 100 percent editable, so you can customize them to suit your needs. This multi purpose template can be used in various situations. Grab these presentation templates today.
The following slide showcases a dashboard to track and measure social media platforms performance. It includes key elements such as website traffic, social media referral rate, site revenue, social media site revenue, etc. This Social Media Performance Tracking And Monitoring Dashboard Mockup PDF is perfect for any presentation, be it in front of clients or colleagues. It is a versatile and stylish solution for organizing your meetings. The product features a modern design for your presentation meetings. The adjustable and customizable slides provide unlimited possibilities for acing up your presentation. Slidegeeks has done all the homework before launching the product for you. So, do not wait, grab the presentation templates today
This slide showcases a dashboard presenting various metrics to measure and analyze sales performance for revenue growth. It includes key components such as number of sales, revenue, profit, cost, sales revenue, sales increment, cost analysis and cross sell. Make sure to capture your audiences attention in your business displays with our gratis customizable Monthly Sales Performance Tracking And Monitoring Dashboard Diagrams PDF. These are great for business strategies, office conferences, capital raising or task suggestions. If you desire to acquire more customers for your tech business and ensure they stay satisfied, create your own sales presentation with these plain slides.
28 Item(s)