- Sign up
- Sign In
 AI PPT Maker
 Templates
 PPT Bundles
 Design Services
 Business PPTs
 Business Plan
 Management
 Strategy
 Introduction PPT
 Roadmap
 Self Introduction
 Timelines
 Process
 Marketing
 Agenda
 Technology
 Medical
 Startup Business Plan
 Cyber Security
 Dashboards
 SWOT
SWOT Proposals
 Education
 Pitch Deck
 Digital Marketing
 KPIs
KPIs Project Management
 Product Management
 Artificial Intelligence
 Target Market
 Communication
 Supply Chain
 Google Slides
 Research Services
 One Pagers
 All Categories
Quality estimation PowerPoint Presentation Templates and Google Slides
14 Item(s)
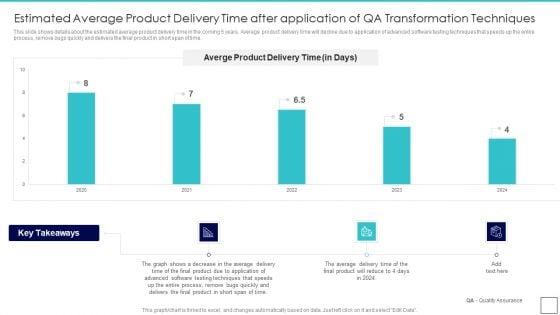

This slide shows details about the estimated average product delivery time in the coming 5 years. Average product delivery time will decline due to application of advanced software testing techniques that speeds up the entire process, remove bugs quickly and delivers the final product in short span of time.Deliver and pitch your topic in the best possible manner with this Deploying Quality Assurance QA Transformation Estimated Average Product Delivery Time After Inspiration PDF Use them to share invaluable insights on Estimated Average Product Delivery Time After Application Of QA Transformation Techniques and impress your audience. This template can be altered and modified as per your expectations. So, grab it now.
This slide shows details about the estimated active defect rate in the coming 5 years. Active defect rate will decline due to application of test oriented software testing approach.Deliver an awe inspiring pitch with this creative Deploying Quality Assurance QA Transformation Estimated Active Defect Rate After Application Icons PDF bundle. Topics like Estimated Active Defect Rate After Application Of QA Transformation Techniques can be discussed with this completely editable template. It is available for immediate download depending on the needs and requirements of the user.


This slide shows the estimated QA quality assurance key performance indicators after strategy implementation. These stats are related to active defect rate, automated testing rate, product quality, overall team effectiveness, average product delivery time etc. From the years 2020 to 2022 along with key takeaways.Deliver and pitch your topic in the best possible manner with this Deploying Quality Assurance QA Transformation Estimated QA Key Performance Indicators Ideas PDF Use them to share invaluable insights on Performance Indicators, Automated Testing, Overall Team Effectiveness and impress your audience. This template can be altered and modified as per your expectations. So, grab it now.


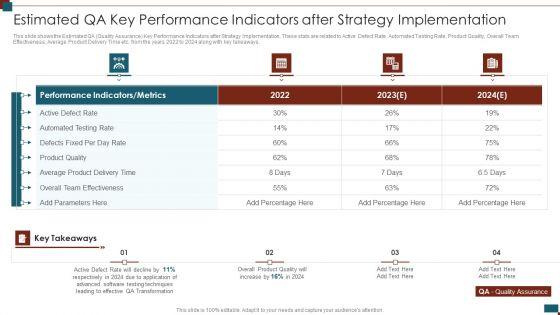
This slide shows the Estimated QA Quality Assurance Key Performance Indicators after Strategy Implementation. These stats are related to Active Defect Rate, Automated Testing Rate, Product Quality, Overall Team Effectiveness, Average Product Delivery Time etc. from the years 2022 to 2024 along with key takeaways. Deliver and pitch your topic in the best possible manner with this quality assurance transformation strategies to improve business performance efficiency estimated qa key performance topics pdf. Use them to share invaluable insights on automated testing rate, average product delivery time, active defect rate and impress your audience. This template can be altered and modified as per your expectations. So, grab it now.


This slide shows details about the Estimated Average Product Delivery Time in the coming 5 years. Average Product Delivery Time will decline due to application of advanced software testing techniques that speeds up the entire process, remove bugs quickly and delivers the final product in short span of time. Deliver an awe inspiring pitch with this creative quality assurance transformation strategies to improve business performance efficiency estimated average product delivery brochure pdf bundle. Topics like product delivery time can be discussed with this completely editable template. It is available for immediate download depending on the needs and requirements of the user.
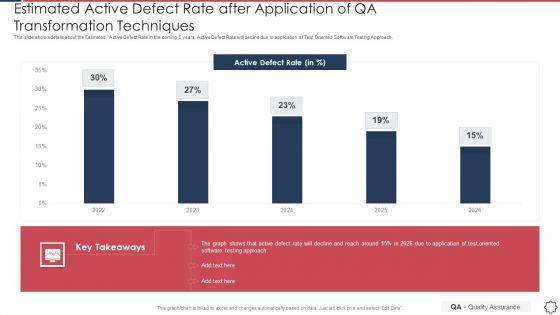

This slide shows details about the Estimated Active Defect Rate in the coming 5 years. Active Defect Rate will decline due to application of Test Oriented Software Testing Approach. Deliver and pitch your topic in the best possible manner with this quality assurance transformation strategies to improve business performance efficiency estimated active defect rate pictures pdf. Use them to share invaluable insights on estimated active defect rate after application of qa transformation techniques and impress your audience. This template can be altered and modified as per your expectations. So, grab it now.

This slide shows the Estimated QA Quality Assurance Key Performance Indicators after Strategy Implementation. These stats are related to Active Defect Rate, Automated Testing Rate, Product Quality, Overall Team Effectiveness, Average Product Delivery Time etc. from the years 2022 to 2024 along with key takeaways. Deliver an awe inspiring pitch with this creative successful quality assurance transition techniques to enhance product quality estimated qa key performance indicators slides pdf bundle. Topics like estimated qa key performance indicators after strategy implementation can be discussed with this completely editable template. It is available for immediate download depending on the needs and requirements of the user.

This slide shows details about the Estimated Average Product Delivery Time in the coming 5 years. Average Product Delivery Time will decline due to application of advanced software testing techniques that speeds up the entire process, remove bugs quickly and delivers the final product in short span of time. Deliver and pitch your topic in the best possible manner with this successful quality assurance transition techniques to enhance product quality estimated average product delivery professional pdf. Use them to share invaluable insights on estimated average product delivery time after application of qa transformation techniques and impress your audience. This template can be altered and modified as per your expectations. So, grab it now.
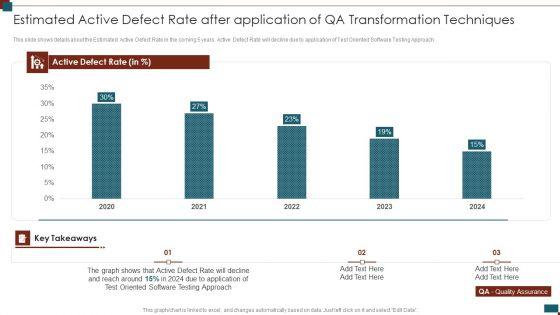

This slide shows details about the Estimated Active Defect Rate in the coming 5 years. Active Defect Rate will decline due to application of Test Oriented Software Testing Approach. Deliver an awe inspiring pitch with this creative successful quality assurance transition techniques to enhance product quality estimated active defect rate after application information pdf bundle. Topics like estimated active defect rate after application of qa transformation techniques can be discussed with this completely editable template. It is available for immediate download depending on the needs and requirements of the user.
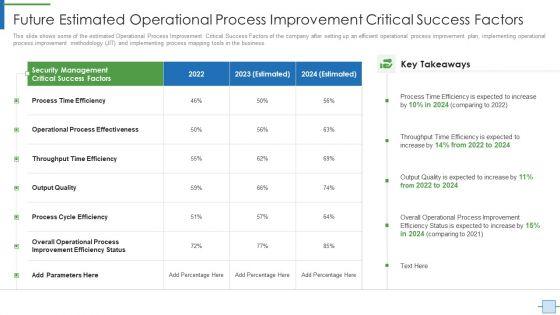
This slide shows some of the estimated Operational Process Improvement Critical Success Factors of the company after setting up an efficient operational process improvement plan, implementing operational process improvement methodology JIT and implementing process mapping tools in the business. Deliver an awe inspiring pitch with this creative operational efficiency execution strategy improve quality future estimated operational rules pdf bundle. Topics like process, operational process effectiveness, output quality can be discussed with this completely editable template. It is available for immediate download depending on the needs and requirements of the user.


This slide shows details about the Estimated Average Product Delivery Time in the coming 5 years. Average Product Delivery Time will decline due to application of advanced software testing techniques that speeds up the entire process, remove bugs quickly and delivers the final product in short span of time. Deliver and pitch your topic in the best possible manner with this qa modification for product quality development and consumer satisfaction estimated average product delivery graphics pdf. Use them to share invaluable insights on process, techniques and impress your audience. This template can be altered and modified as per your expectations. So, grab it now.


This slide shows details about the Estimated Active Defect Rate in the coming 5 years. Active Defect Rate will decline due to application of Test Oriented Software Testing Approach. Deliver an awe inspiring pitch with this creative qa modification for product quality development and consumer satisfaction estimated active defect rate slides pdf bundle. Topics like estimated active defect rate after application of qa transformation techniques can be discussed with this completely editable template. It is available for immediate download depending on the needs and requirements of the user.


This slide shows the Estimated QA Quality Assurance Key Performance Indicators after Strategy Implementation. These stats are related to Active Defect Rate, Automated Testing Rate, Product Quality, Overall Team Effectiveness, Average Product Delivery Time etc. from the years 2021 to 2023 along with key takeaways. Deliver and pitch your topic in the best possible manner with this qa modification for product quality development and consumer satisfaction estimated qa key performance summary pdf. Use them to share invaluable insights on parameters, team effectiveness, product quality, performance and impress your audience. This template can be altered and modified as per your expectations. So, grab it now.
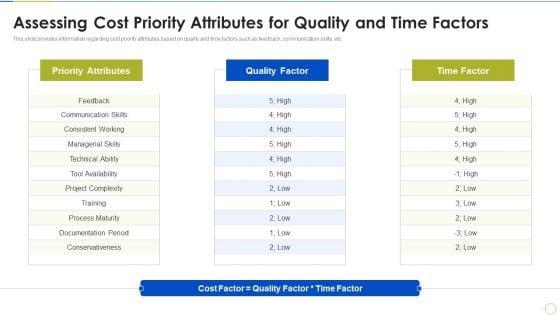

This slide provides information regarding cost priority attributes based on quality and time factors such as feedback, communication skills, etc. This is a agile project budget estimation it assessing cost priority attributes for quality and time factors inspiration pdf template with various stages. Focus and dispense information on three stages using this creative set, that comes with editable features. It contains large content boxes to add your information on topics like priority attributes, quality factor, time factor. You can also showcase facts, figures, and other relevant content using this PPT layout. Grab it now.
14 Item(s)