AI PPT Maker
Templates
PPT Bundles
Design Services
Business PPTs
Business Plan
Management
Strategy
Introduction PPT
Roadmap
Self Introduction
Timelines
Process
Marketing
Agenda
Technology
Medical
Startup Business Plan
Cyber Security
Dashboards
SWOT
Proposals
Education
Pitch Deck
Digital Marketing
KPIs
Project Management
Product Management
Artificial Intelligence
Target Market
Communication
Supply Chain
Google Slides
Research Services
 One Pagers
All Categories
Revenues Profits PowerPoint Presentation Templates and Google Slides
SHOW
- 60
- 120
- 180
DISPLAYING: 60 of 117 Item(s)
Page
Slide 1 of 6
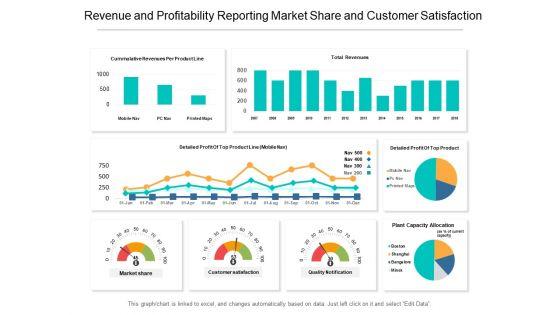
This is a revenue and profitability reporting market share and customer satisfaction ppt powerpoint presentation styles format ideas. This is a four stage process. The stages in this process are business analytics, ba, organizations data.


Slide 1 of 6
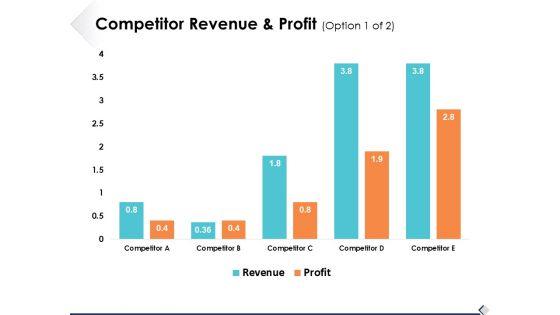
This is a competitor revenue and profit option 1 of 2 ppt powerpoint presentation ideas gallery. This is a two stage process. The stages in this process are finance, business, management, strategy, analysis.


Slide 1 of 5
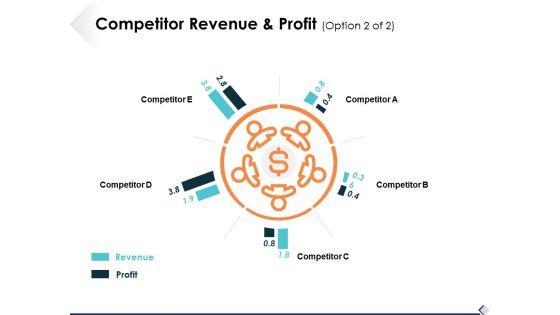
This is a competitor revenue and profit option 2 of 2 ppt powerpoint presentation show design templates. This is a five stage process. The stages in this process are business, management, strategy, analysis, marketing.


Slide 1 of 5
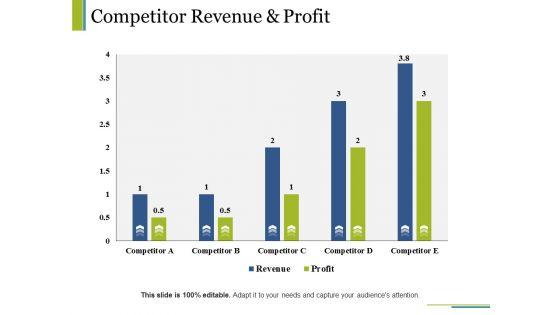
This is a competitor revenue and profit ppt powerpoint presentation pictures good. This is a five stage process. The stages in this process are competitor, revenue, profit.


Slide 1 of 5
This is a competitor revenue and profit ppt powerpoint presentation slides objects. This is a five stage process. The stages in this process are business, marketing, graph, finance, revenue.


Slide 1 of 5
This is a competitor revenue and profit ppt powerpoint presentation professional graphics pictures. This is a five stage process. The stages in this process are business, marketing, strategy, graph, finance.



Slide 1 of 5
This is a competitor revenue and profit ppt powerpoint presentation slides influencers. This is a five stage process. The stages in this process are business, marketing, strategy, planning, growth.


Slide 1 of 5
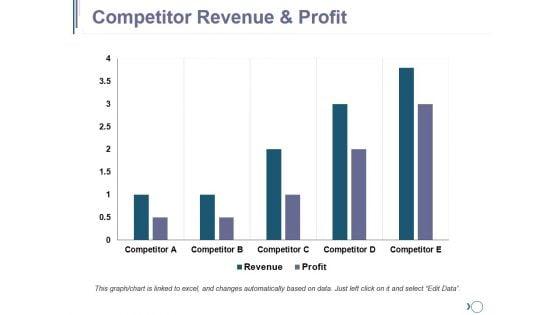
This is a competitor revenue and profit ppt powerpoint presentation pictures background images. This is a five stage process. The stages in this process are business, marketing, strategy, planning, finance.
Slide 1 of 5
This is a competitor revenue and profit ppt powerpoint presentation icon slide download. This is a five stage process. The stages in this process are revenue, profit, finance, marketing, strategy, analysis, business.


Slide 1 of 5
This is a competitor revenue and profit template 2 ppt powerpoint presentation infographics styles. This is a three stage process. The stages in this process are high, market attractiveness, low, weak, global market share, strong.



Slide 1 of 5
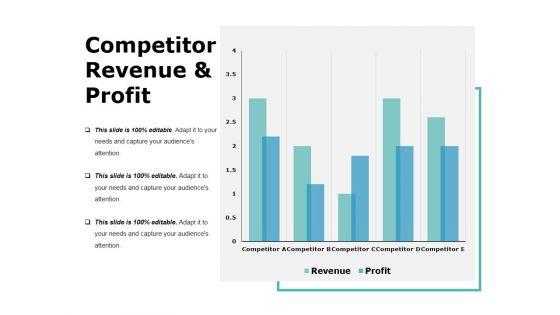
This is a competitor revenue and profit template 1 ppt powerpoint presentation layouts display. This is a five stage process. The stages in this process are business, bar graph, finance, marketing, analysis.


Slide 1 of 5
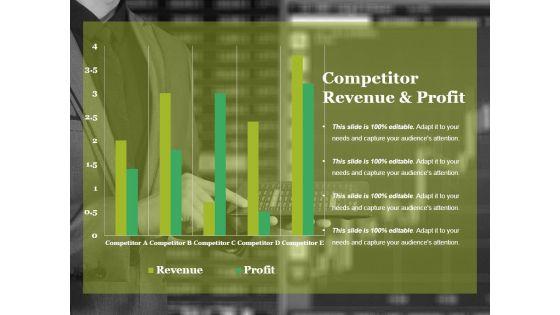
This is a competitor revenue and profit ppt powerpoint presentation model templates. This is a five stage process. The stages in this process are revenue, profit, competitor, bar graph, business.



Slide 1 of 5
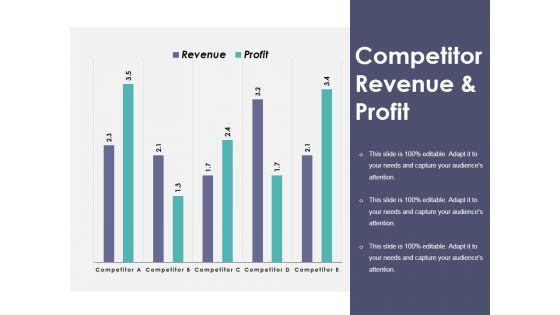
This is a competitor revenue and profit ppt powerpoint presentation layouts vector. This is a five stage process. The stages in this process are competitor, profit, revenue, bar graph, success.

Slide 1 of 5
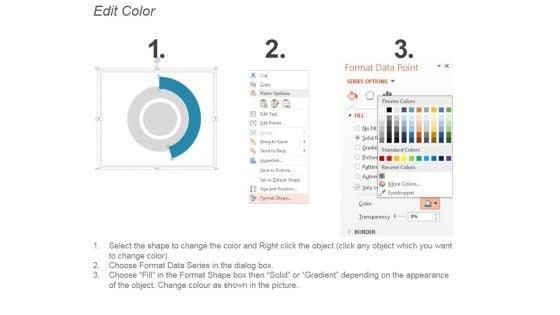
This is a competitor revenue and profit ppt powerpoint presentation outline elements. This is a five stage process. The stages in this process are bar graph, marketing, strategy, finance, planning.


Slide 1 of 5
This is a competitor revenue and profit ppt powerpoint presentation inspiration slide portrait. This is a five stage process. The stages in this process are business, finance, analysis, growth, investment.



Slide 1 of 5
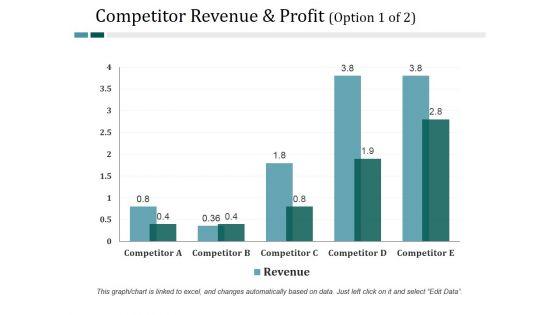
This is a competitor revenue and profit template 2 ppt powerpoint presentation styles examples. This is a five stage process. The stages in this process are business, process, management, strategy, competitor.


Slide 1 of 5
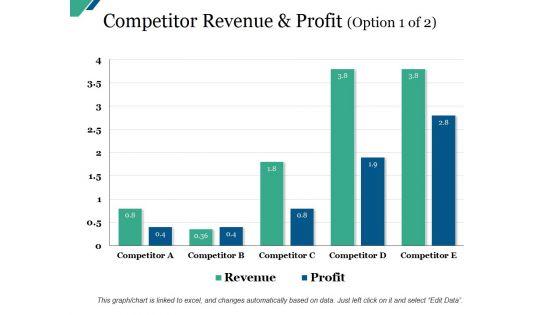
This is a competitor revenue and profit template 1 ppt powerpoint presentation professional example file. This is a five stage process. The stages in this process are business, finance, marketing, strategy, analysis, growth.


Slide 1 of 5
This is a competitor revenue and profit template ppt powerpoint presentation model design inspiration. This is a five stage process. The stages in this process are business, marketing, graph, success, growth.

Slide 1 of 5
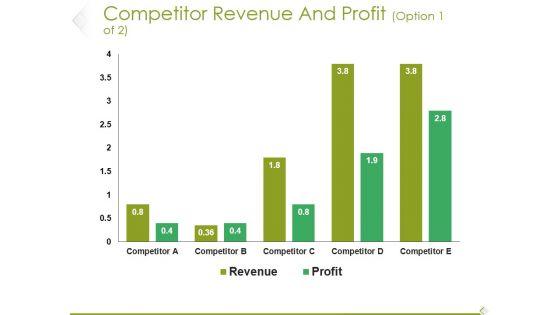
This is a competitor revenue and profit template 1 ppt powerpoint presentation professional slides. This is a five stage process. The stages in this process are business, marketing, circle, process, finance.



Slide 1 of 5
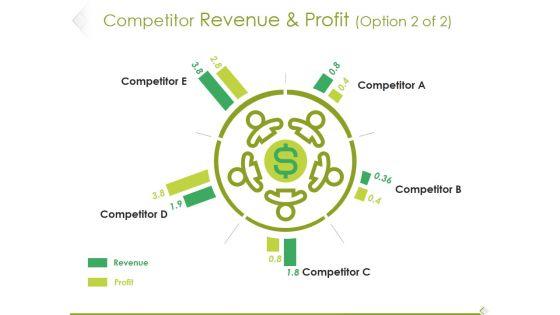
This is a competitor revenue and profit template 2 ppt powerpoint presentation infographic template format ideas. This is a five stage process. The stages in this process are competitor, revenue, profit, graph, growth.


Slide 1 of 5
This is a competitor revenue and profit template 1 ppt powerpoint presentation file infographic template. This is a five stage process. The stages in this process are competitor, revenue, profit, dollar, symbol.


Slide 1 of 5
This is a competitor revenue and profit template 2 ppt powerpoint presentation visual aids model. This is a five stage process. The stages in this process are revenue, profit, competitor, circle, business.


Slide 1 of 5
This is a competitor revenue and profit template 1 ppt powerpoint presentation infographic template designs download. This is a five stage process. The stages in this process are revenue, profit, competitor, bar graph, growth.


Slide 1 of 5
This is a competitor analysis competitor revenue and profit graph ppt powerpoint presentation gallery vector. This is a five stage process. The stages in this process are bar graph, marketing, management, business, presentation.



Slide 1 of 5
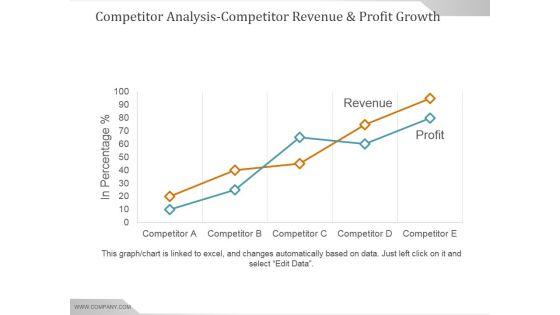
This is a competitor analysis competitor revenue and profit growth ppt powerpoint presentation example 2015. This is a five stage process. The stages in this process are business, strategy, marketing, analysis, growth strategy.


Slide 1 of 5
This is a competitor analysis competitor revenue and profit graph ppt powerpoint presentation inspiration. This is a five stage process. The stages in this process are business, marketing, management, profit, revenue.


Slide 1 of 5
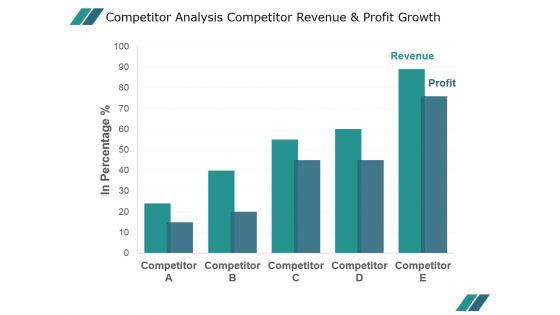
This is a competitor analysis competitor revenue and profit growth ppt powerpoint presentation slide download. This is a five stage process. The stages in this process are business, marketing, management, finance, growth.
Slide 1 of 2
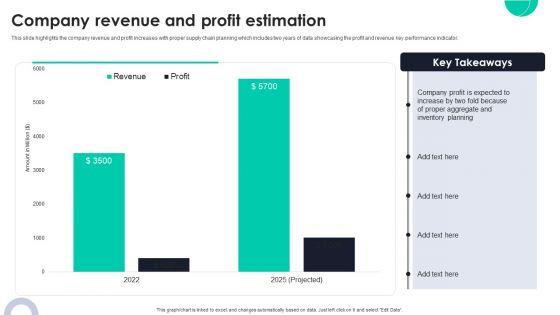
This slide highlights the company revenue and profit increases with proper supply chain planning which includes two years of data showcasing the profit and revenue key performance indicator. Do you have to make sure that everyone on your team knows about any specific topic I yes, then you should give Company Revenue And Profit Estimation Ppt PowerPoint Presentation File Ideas PDF a try. Our experts have put a lot of knowledge and effort into creating this impeccable Company Revenue And Profit Estimation Ppt PowerPoint Presentation File Ideas PDF. You can use this template for your upcoming presentations, as the slides are perfect to represent even the tiniest detail. You can download these templates from the Slidegeeks website and these are easy to edit. So grab these today.
Slide 1 of 2
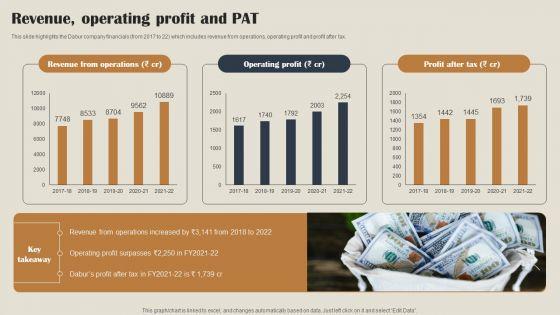
The best PPT templates are a great way to save time, energy, and resources. Slidegeeks have 100 percent editable powerpoint slides making them incredibly versatile. With these quality presentation templates, you can create a captivating and memorable presentation by combining visually appealing slides and effectively communicating your message. Download Self Care Products Company Outline Revenue Operating Profit And PAT Background PDF from Slidegeeks and deliver a wonderful presentation.
Slide 1 of 2
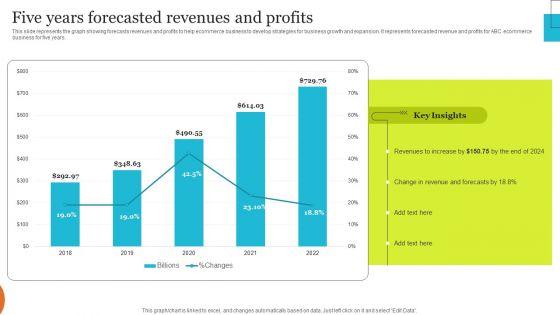
This slide represents the graph showing forecasts revenues and profits to help ecommerce business to develop strategies for business growth and expansion. It represents forecasted revenue and profits for ABC ecommerce business for five years. Slidegeeks is one of the best resources for PowerPoint templates. You can download easily and regulate Implementing Effective Ecommerce Managemnet Platform Five Years Forecasted Revenues And Profits Brochure PDF for your personal presentations from our wonderful collection. A few clicks is all it takes to discover and get the most relevant and appropriate templates. Use our Templates to add a unique zing and appeal to your presentation and meetings. All the slides are easy to edit and you can use them even for advertisement purposes.
Slide 1 of 2
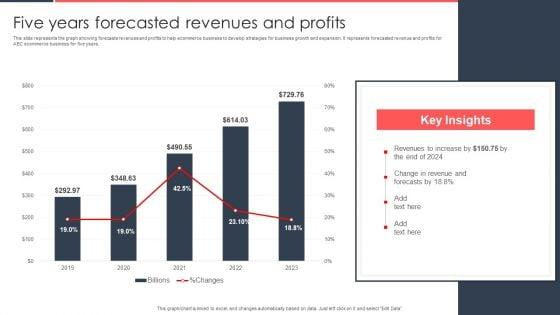
This slide represents the graph showing forecasts revenues and profits to help ecommerce business to develop strategies for business growth and expansion. It represents forecasted revenue and profits for ABC ecommerce business for five years. Take your projects to the next level with our ultimate collection of Implementing Management System To Enhance Ecommerce Processes Five Years Forecasted Revenues And Profits Brochure PDF. Slidegeeks has designed a range of layouts that are perfect for representing task or activity duration, keeping track of all your deadlines at a glance. Tailor these designs to your exact needs and give them a truly corporate look with your own brand colors they will make your projects stand out from the rest.
Slide 1 of 2
Supply Network Planning And Administration Tactics Company Revenue And Profit Estimation Summary PDF
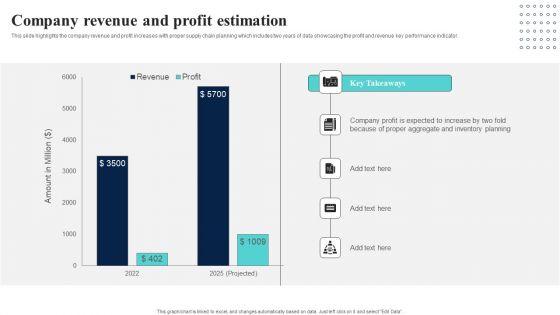
This slide highlights the company revenue and profit increases with proper supply chain planning which includes two years of data showcasing the profit and revenue key performance indicator. Take your projects to the next level with our ultimate collection of Supply Network Planning And Administration Tactics Company Revenue And Profit Estimation Summary PDF. Slidegeeks has designed a range of layouts that are perfect for representing task or activity duration, keeping track of all your deadlines at a glance. Tailor these designs to your exact needs and give them a truly corporate look with your own brand colors they will make your projects stand out from the rest.
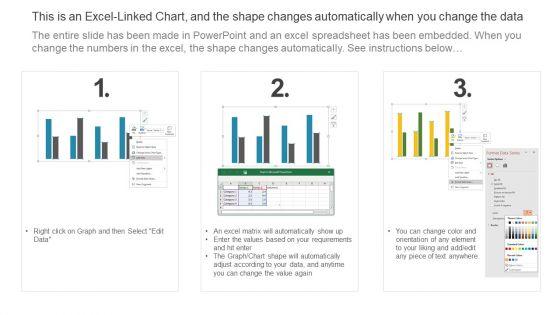
Slide 1 of 2
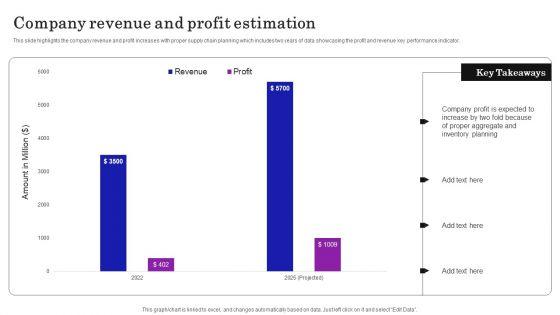
This slide highlights the company revenue and profit increases with proper supply chain planning which includes two years of data showcasing the profit and revenue key performance indicator. Do you know about Slidesgeeks Supply Chain Planning To Enhance Logistics Process Company Revenue And Profit Estimation Introduction PDF These are perfect for delivering any kind od presentation. Using it, create PowerPoint presentations that communicate your ideas and engage audiences. Save time and effort by using our pre designed presentation templates that are perfect for a wide range of topic. Our vast selection of designs covers a range of styles, from creative to business, and are all highly customizable and easy to edit. Download as a PowerPoint template or use them as Google Slides themes.

Slide 1 of 2
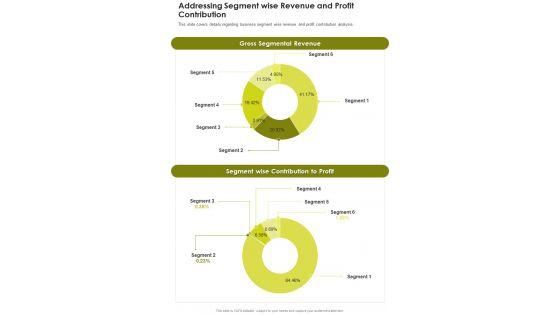
This slide covers details regarding business segment wise revenue and profit contribution analysis. Presenting you a fantastic Addressing Segment Wise Revenue And Profit Contribution One Pager Documents. This piece is crafted on hours of research and professional design efforts to ensure you have the best resource. It is completely editable and its design allow you to rehash its elements to suit your needs. Get this Addressing Segment Wise Revenue And Profit Contribution One Pager Documents A4 One-pager now.


Slide 1 of 2
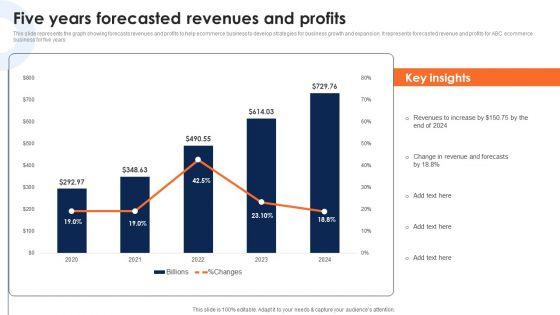
This slide represents the graph showing forecasts revenues and profits to help ecommerce business to develop strategies for business growth and expansion. It represents forecasted revenue and profits for ABC ecommerce business for five years. Make sure to capture your audiences attention in your business displays with our gratis customizable Implementing An Effective Ecommerce Management Framework Five Years Forecasted Revenues And Profits Ideas PDF. These are great for business strategies, office conferences, capital raising or task suggestions. If you desire to acquire more customers for your tech business and ensure they stay satisfied, create your own sales presentation with these plain slides.

Slide 1 of 2
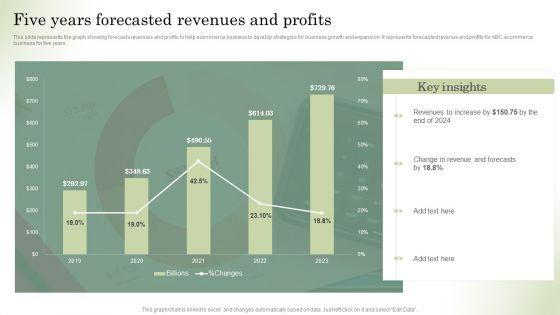
This slide represents the graph showing forecasts revenues and profits to help ecommerce business to develop strategies for business growth and expansion. It represents forecasted revenue and profits for ABC ecommerce business for five years.Crafting an eye-catching presentation has never been more straightforward. Let your presentation shine with this tasteful yet straightforward Five Years Forecasted Revenues And Profits Deploying Ecommerce Order Management Software Diagrams PDF template. It offers a minimalistic and classy look that is great for making a statement. The colors have been employed intelligently to add a bit of playfulness while still remaining professional. Construct the ideal Five Years Forecasted Revenues And Profits Deploying Ecommerce Order Management Software Diagrams PDF that effortlessly grabs the attention of your audience. Begin now and be certain to wow your customers.

Slide 1 of 2
This slide represents the graph showing forecasts revenues and profits to help ecommerce business to develop strategies for business growth and expansion. It represents forecasted revenue and profits for ABC ecommerce business for five years. Make sure to capture your audiences attention in your business displays with our gratis customizable Optimizing Online Stores Five Years Forecasted Revenues And Profits Ideas PDF. These are great for business strategies, office conferences, capital raising or task suggestions. If you desire to acquire more customers for your tech business and ensure they stay satisfied, create your own sales presentation with these plain slides.
Slide 1 of 2
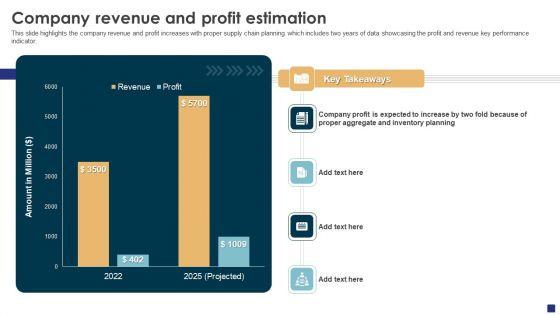
This slide highlights the company revenue and profit increases with proper supply chain planning which includes two years of data showcasing the profit and revenue key performance indicator. Get a simple yet stunning designed Comprehensive Guide To Ecommerce Company Revenue And Profit Estimation Topics PDF. It is the best one to establish the tone in your meetings. It is an excellent way to make your presentations highly effective. So, download this PPT today from Slidegeeks and see the positive impacts. Our easy-to-edit Comprehensive Guide To Ecommerce Company Revenue And Profit Estimation Topics PDF can be your go-to option for all upcoming conferences and meetings. So, what are you waiting for Grab this template today.


Slide 1 of 2
This slide represents the graph showing forecasts revenues and profits to help ecommerce business to develop strategies for business growth and expansion. It represents forecasted revenue and profits for ABC ecommerce business for five years. Take your projects to the next level with our ultimate collection of Analyzing And Deploying Effective CMS Five Years Forecasted Revenues And Profits Demonstration PDF. Slidegeeks has designed a range of layouts that are perfect for representing task or activity duration, keeping track of all your deadlines at a glance. Tailor these designs to your exact needs and give them a truly corporate look with your own brand colors they will make your projects stand out from the rest.
Slide 1 of 2
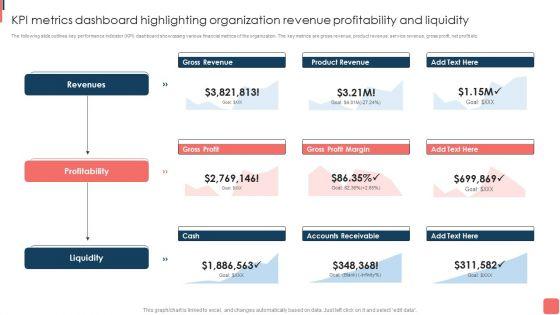
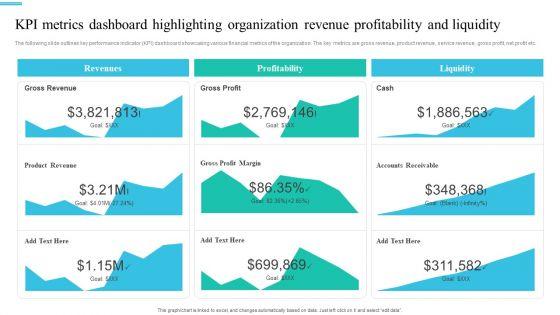
The following slide outlines key performance indicator KPI dashboard showcasing various financial metrics of the organization. The key metrics are gross revenue, product revenue, service revenue, gross profit, net profit etc. This KPI Metrics Dashboard Highlighting Organization Revenue Profitability And Liquidity Template PDF from Slidegeeks makes it easy to present information on your topic with precision. It provides customization options, so you can make changes to the colors, design, graphics, or any other component to create a unique layout. It is also available for immediate download, so you can begin using it right away. Slidegeeks has done good research to ensure that you have everything you need to make your presentation stand out. Make a name out there for a brilliant performance.
Slide 1 of 2
The following slide outlines key performance indicator KPI dashboard showcasing various financial metrics of the organization. The key metrics are gross revenue, product revenue, service revenue, gross profit, net profit etc. Coming up with a presentation necessitates that the majority of the effort goes into the content and the message you intend to convey. The visuals of a PowerPoint presentation can only be effective if it supplements and supports the story that is being told. Keeping this in mind our experts created Monetary Planning And Evaluation Guide KPI Metrics Dashboard Highlighting Organization Revenue Profitability And Liquidity Ppt Diagram Images PDF to reduce the time that goes into designing the presentation. This way, you can concentrate on the message while our designers take care of providing you with the right template for the situation.
Slide 1 of 2
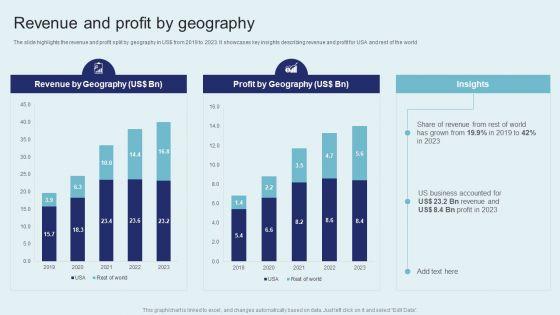
The slide highlights the revenue and profit split by geography in US dollar from 2019 to 2023. It showcases key insights describing revenue and profit for USA and rest of the world. Present like a pro with IT Firm Financial Statement Revenue And Profit By Geography Graphics PDF Create beautiful presentations together with your team, using our easy to use presentation slides. Share your ideas in real time and make changes on the fly by downloading our templates. So whether you are in the office, on the go, or in a remote location, you can stay in sync with your team and present your ideas with confidence. With Slidegeeks presentation got a whole lot easier. Grab these presentations today.
Slide 1 of 2
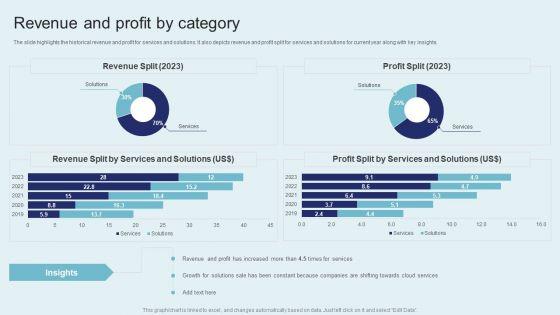
The slide highlights the historical revenue and profit for services and solutions. It also depicts revenue and profit split for services and solutions for current year along with key insights. From laying roadmaps to briefing everything in detail, our templates are perfect for you. You can set the stage with your presentation slides. All you have to do is download these easy to edit and customizable templates. IT Firm Financial Statement Revenue And Profit By Category Portrait PDF will help you deliver an outstanding performance that everyone would remember and praise you for. Do download this presentation today.
Slide 1 of 2
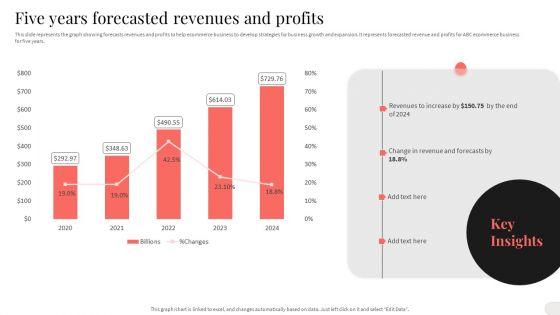
This slide represents the graph showing forecasts revenues and profits to help ecommerce business to develop strategies for business growth and expansion. It represents forecasted revenue and profits for ABC ecommerce business for five years. Take your projects to the next level with our ultimate collection of Analyzing And Implementing Effective CMS Five Years Forecasted Revenues And Profits Mockup PDF. Slidegeeks has designed a range of layouts that are perfect for representing task or activity duration, keeping track of all your deadlines at a glance. Tailor these designs to your exact needs and give them a truly corporate look with your own brand colors they will make your projects stand out from the rest.

Slide 1 of 2
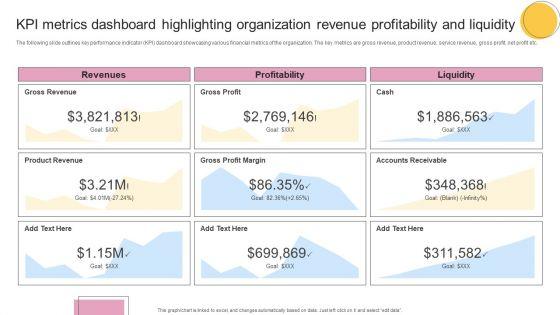
The following slide outlines key performance indicator KPI dashboard showcasing various financial metrics of the organization. The key metrics are gross revenue, product revenue, service revenue, gross profit, net profit etc. From laying roadmaps to briefing everything in detail, our templates are perfect for you. You can set the stage with your presentation slides. All you have to do is download these easy to edit and customizable templates. KPI Metrics Dashboard Highlighting Organization Revenue Profitability And Liquidity Formats PDF will help you deliver an outstanding performance that everyone would remember and praise you for. Do download this presentation today.
Slide 1 of 2
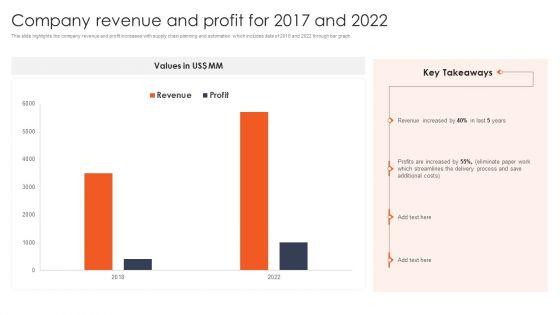
This slide highlights the company revenue and profit increases with supply chain planning and automation which includes data of 2018 and 2022 through bar graph. This modern and well-arranged International Design And Architecture Firm Company Revenue And Profit For 2017 And 2022 Structure PDF provides lots of creative possibilities. It is very simple to customize and edit with the Powerpoint Software. Just drag and drop your pictures into the shapes. All facets of this template can be edited with Powerpoint, no extra software is necessary. Add your own material, put your images in the places assigned for them, adjust the colors, and then you can show your slides to the world, with an animated slide included.
Slide 1 of 2
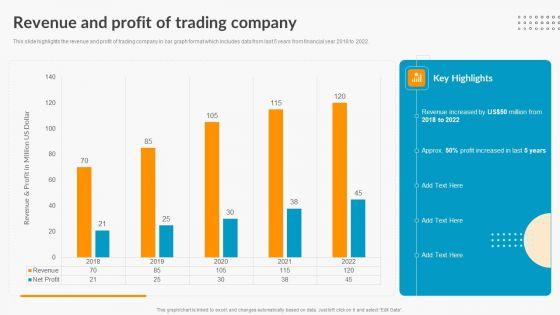
This slide highlights the revenue and profit of trading company in bar graph format which includes data from last 5 years from financial year 2018 to 2022.Are you searching for a Revenue And Profit Of Trading Company Export Trade Business Profile Ideas PDF that is uncluttered, straightforward, and original Its easy to edit, and you can change the colors to suit your personal or business branding. For a presentation that expresses how much effort you ve put in, this template is ideal With all of its features, including tables, diagrams, statistics, and lists, its perfect for a business plan presentation. Make your ideas more appealing with these professional slides. Download Revenue And Profit Of Trading Company Export Trade Business Profile Ideas PDF from Slidegeeks today.

Slide 1 of 2
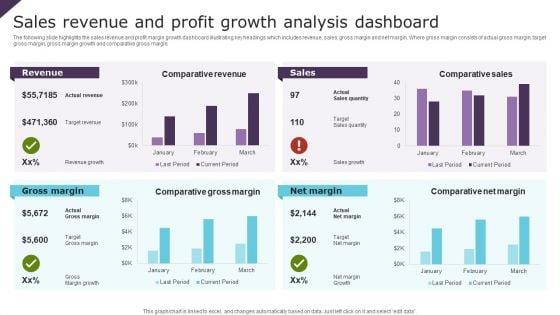
The following slide highlights the sales revenue and profit margin growth dashboard illustrating key headings which includes revenue, sales, gross margin and net margin. Where gross margin consists of actual gross margin, target gross margin, gross margin growth and comparative gross margin. Showcasing this set of slides titled Sales Revenue And Profit Growth Analysis Dashboard Ppt Portfolio Slide PDF. The topics addressed in these templates are Revenue, Sales, Gross Margin, Net Margin. All the content presented in this PPT design is completely editable. Download it and make adjustments in color, background, font etc. as per your unique business setting.


Slide 1 of 2
This slide highlights the company revenue and profit increases with supply chain planning and automation which includes data of 2018 and 2022 through bar graph. Boost your pitch with our creative Company Revenue And Profit For 2017 And 2022 Structure PDF. Deliver an awe-inspiring pitch that will mesmerize everyone. Using these presentation templates you will surely catch everyones attention. You can browse the ppts collection on our website. We have researchers who are experts at creating the right content for the templates. So you do not have to invest time in any additional work. Just grab the template now and use them.

Slide 1 of 2
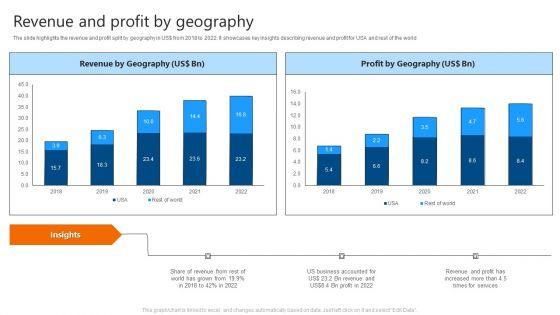
The slide highlights the revenue and profit split by geography in US doller from 2018 to 2022. It showcases key insights describing revenue and profit for USA and rest of the world. Deliver and pitch your topic in the best possible manner with this Revenue And Profit By Geography IT Software Development Company Profile Formats PDF. Use them to share invaluable insights on Revenue By Geography, Profit By Geography and impress your audience. This template can be altered and modified as per your expectations. So, grab it now.

Slide 1 of 2
The slide highlights the historical revenue and profit for services and solutions. It also depicts revenue and profit split for services and solutions for current year along with key insights. Deliver an awe inspiring pitch with this creative Revenue And Profit By Category IT Software Development Company Profile Graphics PDF bundle. Topics like Revenue Split By Services, Profit Split By Services can be discussed with this completely editable template. It is available for immediate download depending on the needs and requirements of the user.

Slide 1 of 2
This slide highlights the company revenue and profit increases with supply chain planning and automation which includes data of 2017 and 2022 through bar graph. Deliver and pitch your topic in the best possible manner with this Supply Chain Solutions Business Outline Company Revenue And Profit For 2017 And 2022 Slides PDF. Use them to share invaluable insights on Revenue, Additional Costs, Delivery Process and impress your audience. This template can be altered and modified as per your expectations. So, grab it now.


Slide 1 of 2
The slide highlights the revenue and profit split by geography in US dollar from 2018 to 2022. It showcases key insights describing revenue and profit for USA and rest of the world. Deliver an awe inspiring pitch with this creative IT Application Services Company Outline Revenue And Profit By Geography Rules PDF bundle. Topics like Revenue By Geography, Profit By Geography can be discussed with this completely editable template. It is available for immediate download depending on the needs and requirements of the user.
Slide 1 of 2
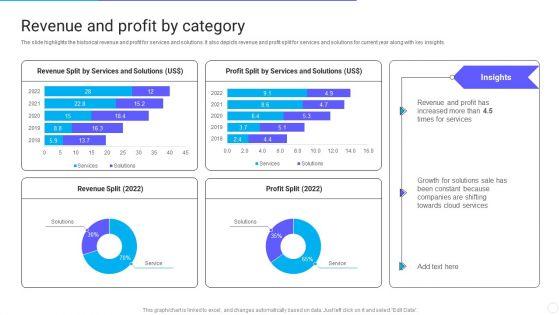
The slide highlights the historical revenue and profit for services and solutions. It also depicts revenue and profit split for services and solutions for current year along with key insights. Deliver and pitch your topic in the best possible manner with this IT Application Services Company Outline Revenue And Profit By Category Diagrams PDF. Use them to share invaluable insights on Revenue Split, Profit Split, Services and impress your audience. This template can be altered and modified as per your expectations. So, grab it now.

Slide 1 of 2
This slide highlights the company revenue and profit increases with supply chain planning and automation which includes data of 2017 and 2022 through bar graph. Deliver an awe inspiring pitch with this creative Cargo Logistics Company Profile Company Revenue And Profit For 2017 And 2022 Diagrams PDF bundle. Topics like Revenue, Profits, Additional Costs can be discussed with this completely editable template. It is available for immediate download depending on the needs and requirements of the user.

Slide 1 of 2
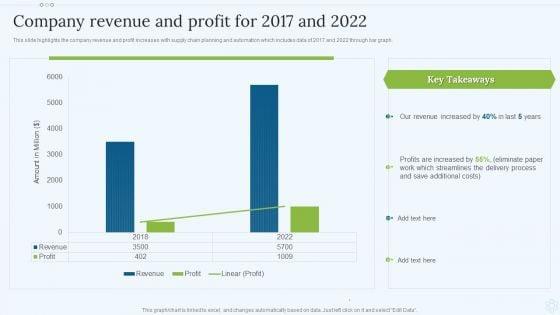
This slide highlights the company revenue and profit increases with supply chain planning and automation which includes data of 2017 and 2022 through bar graph. Deliver and pitch your topic in the best possible manner with this Shipping Services Company Profile Company Revenue And Profit For 2017 And 2022 Background PDF. Use them to share invaluable insights on Revenue, Additional Costs, Profits and impress your audience. This template can be altered and modified as per your expectations. So, grab it now.


Slide 1 of 2
This slide highlights the company revenue and profit increases with supply chain planning and automation which includes data of 2018 and 2022 through bar graph. Deliver and pitch your topic in the best possible manner with this Commercial Construction And Architecture Firm Company Revenue And Profit For 2017 And 2022 Background PDF. Use them to share invaluable insights on Revenue, Profits, Costs and impress your audience. This template can be altered and modified as per your expectations. So, grab it now.

Slide 1 of 2
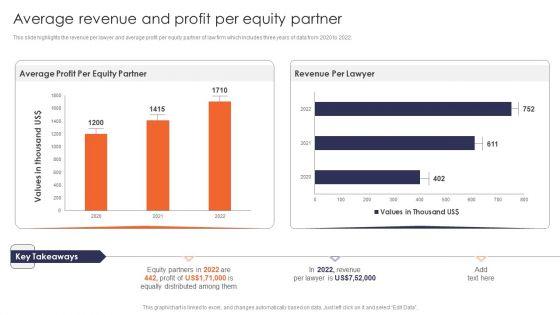
This slide highlights the revenue per lawyer and average profit per equity partner of law firm which includes three years of data from 2020 to 2022. Deliver an awe inspiring pitch with this creative International Legal And Business Services Company Profile Average Revenue And Profit Per Equity Partner Diagrams PDF bundle. Topics like Revenue Per Lawyer, Average Profit, Equity Partner can be discussed with this completely editable template. It is available for immediate download depending on the needs and requirements of the user.

Slide 1 of 2
This slide highlights the revenue per lawyer and average profit per equity partner of law firm which includes three years of data from 2020 to 2022. Deliver and pitch your topic in the best possible manner with this Average Revenue And Profit Per Equity Partner Multinational Legal Firm Company Profile Inspiration PDF. Use them to share invaluable insights on Average Profit, Equity Partner, Revenue Per Lawyer and impress your audience. This template can be altered and modified as per your expectations. So, grab it now.
Slide 1 of 2
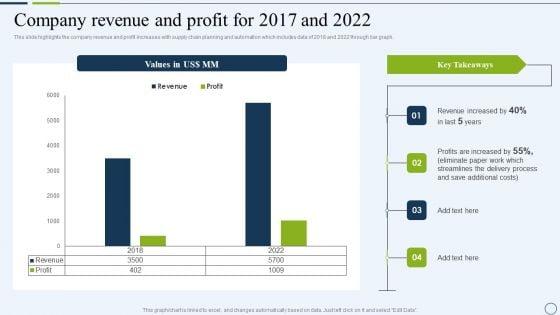
This slide highlights the company revenue and profit increases with supply chain planning and automation which includes data of 2018 and 2022 through bar graph. Deliver and pitch your topic in the best possible manner with this Commercial And Urban Architect Business Profile Company Revenue And Profit For 2017 And 2022 Introduction PDF. Use them to share invaluable insights on Additional Costs, Revenue Increased, Profits and impress your audience. This template can be altered and modified as per your expectations. So, grab it now.
SHOW
- 60
- 120
- 180
DISPLAYING: 60 of 117 Item(s)
Page
