 AI PPT Maker
 Templates
 PPT Bundles
 Design Services
 Business PPTs
 Business Plan
 Management
 Strategy
 Introduction PPT
 Roadmap
 Self Introduction
 Timelines
 Process
 Marketing
 Agenda
 Technology
 Medical
 Startup Business Plan
 Cyber Security
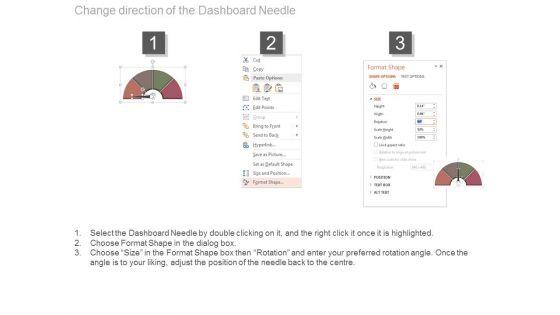
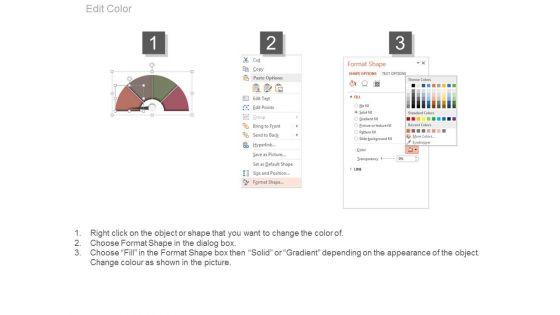
 Dashboards
 SWOT
SWOT Proposals
 Education
 Pitch Deck
 Digital Marketing
 KPIs
KPIs Project Management
 Product Management
 Artificial Intelligence
 Target Market
 Communication
 Supply Chain
 Google Slides
 Research Services
 One Pagers
 All Categories
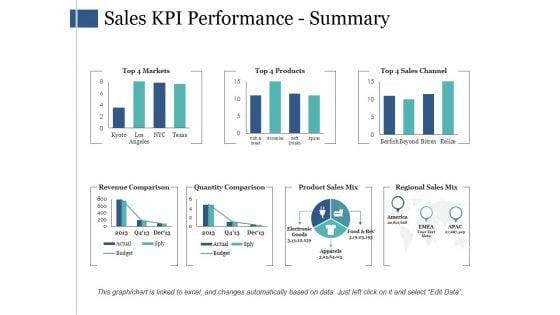
Sale Kpis PowerPoint Presentation Templates and Google Slides
SHOW
- 60
- 120
- 180
DISPLAYING: 60 of 91 Item(s)
Page


Boost your confidence and team morale with this well-structured Sales Kpis Ppt PowerPoint Presentation Complete Deck With Slides. This prefabricated set gives a voice to your presentation because of its well-researched content and graphics. Our experts have added all the components very carefully, thus helping you deliver great presentations with a single click. Not only that, it contains a set of twelve slides that are designed using the right visuals, graphics, etc. Various topics can be discussed, and effective brainstorming sessions can be conducted using the wide variety of slides added in this complete deck. Apart from this, our PPT design contains clear instructions to help you restructure your presentations and create multiple variations. The color, format, design anything can be modified as deemed fit by the user. Not only this, it is available for immediate download. So, grab it now.


Following slide demonstrates key performance indicator dashboard for tracking monthly sales to monitor business performance. It includes components such as monthly execution cost, sales, state wise events, Brand market, and programs. Showcasing this set of slides titled Monthly Sales KPI Dashboard For Tracking Brand Recommendation Progress Background PDF. The topics addressed in these templates are Products Sold, Engagements, Events, Active Markets, Sampled, Attendance. All the content presented in this PPT design is completely editable. Download it and make adjustments in color, background, font etc. as per your unique business setting.


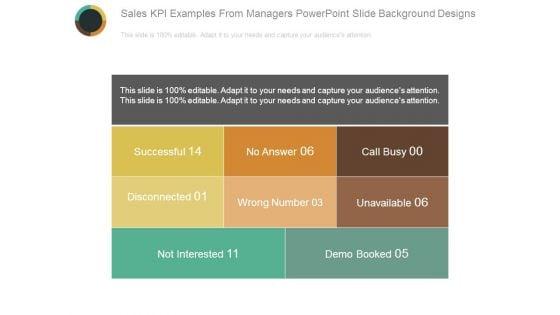
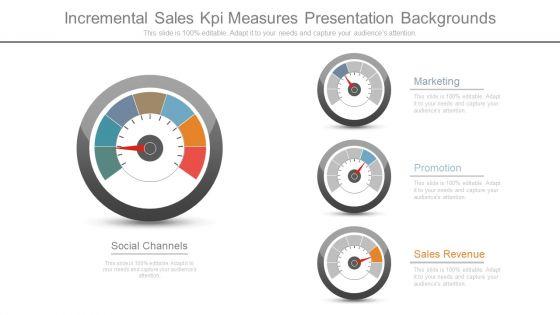
This slide covers status and earnings from sales in an organization. It includes details such as sales count, revenue generated, profit earned and cost incurred to raise sales and profitable sales channel.Showcasing this set of slides titled Company Sales KPI And Revenue Generation Progress Scorecard Formats PDF. The topics addressed in these templates are Accumulated Revenue, Annual Sales Revenue, Incremental Sales. All the content presented in this PPT design is completely editable. Download it and make adjustments in color, background, font etc. as per your unique business setting.
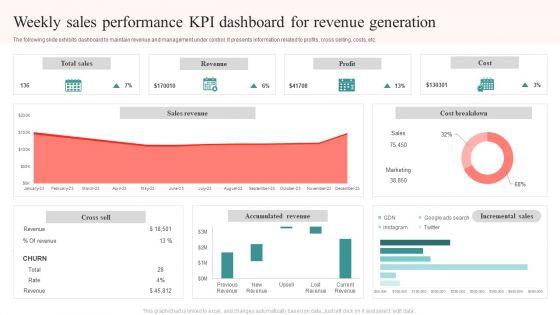
The following slide exhibits dashboard to maintain revenue and management under control. It presents information related to profits, cross selling, costs, etc. Pitch your topic with ease and precision using this Weekly Sales Performance KPI Dashboard For Revenue Generation Brochure PDF. This layout presents information on Total Sales, Revenue, Profit, Cost. It is also available for immediate download and adjustment. So, changes can be made in the color, design, graphics or any other component to create a unique layout.
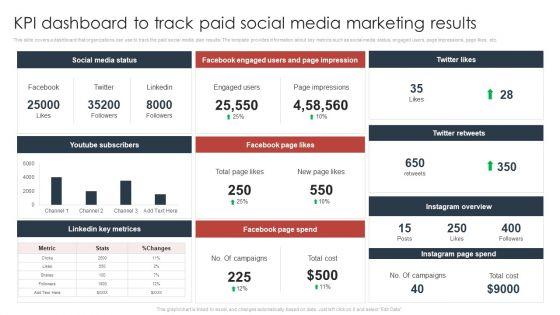

This slide covers a dashboard that organizations can use to track the paid social media plan results. The template provides information about key metrics such as social media status, engaged users, page impressions, page likes, etc. Here you can discover an assortment of the finest PowerPoint and Google Slides templates. With these templates, you can create presentations for a variety of purposes while simultaneously providing your audience with an eye catching visual experience. Download Paid Advertising Techniques To Enhance Business Sales KPI Dashboard To Track Paid Social Media Microsoft PDF to deliver an impeccable presentation. These templates will make your job of preparing presentations much quicker, yet still, maintain a high level of quality. Slidegeeks has experienced researchers who prepare these templates and write high quality content for you. Later on, you can personalize the content by editing the Paid Advertising Techniques To Enhance Business Sales KPI Dashboard To Track Paid Social Media Microsoft PDF.


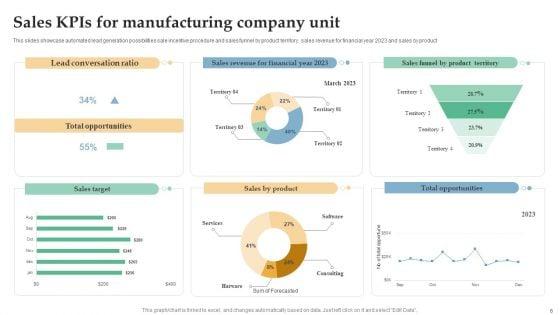
This slides showcase automated lead generation possibilities sale incentive procedure and sales funnel by product territory, sales revenue for financial year 2023 and sales by product. Showcasing this set of slides titled Sales Kpis For Manufacturing Company Unit Ppt Pictures Images PDF. The topics addressed in these templates are Lead Conversation Ratio, Total Opportunities, Total Opportunities. All the content presented in this PPT design is completely editable. Download it and make adjustments in color, background, font etc. as per your unique business setting.


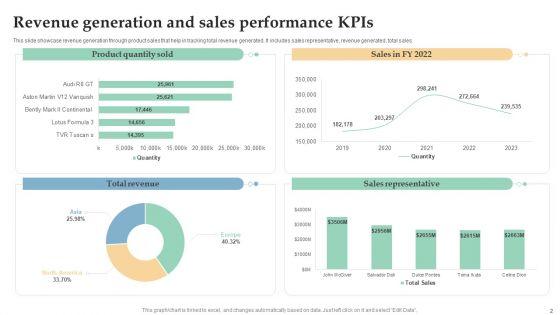
This slide showcase revenue generation through product sales that help in tracking total revenue generated. It includes sales representative, revenue generated, total sales. Pitch your topic with ease and precision using this Revenue Generation And Sales Performance Kpis Ppt Inspiration Background Image PDF. This layout presents information on Total Revenue, Sales Representative, Product Quantity Sold. It is also available for immediate download and adjustment. So, changes can be made in the color, design, graphics or any other component to create a unique layout.
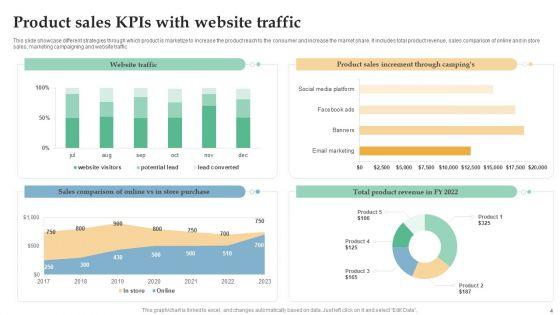
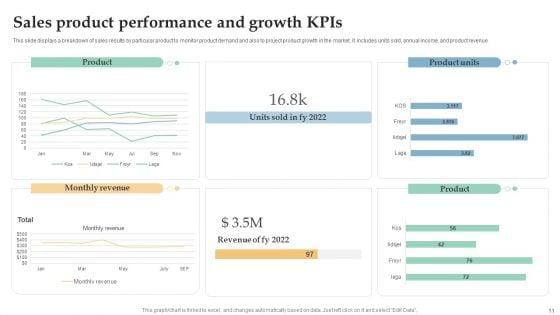
This slide showcase different strategies through which product is marketize to increase the product reach to the consumer and increase the market share. It includes total product revenue, sales comparison of online and in store sales, marketing campaigning and website traffic. Showcasing this set of slides titled Product Sales Kpis With Website Traffic Ppt Icon Smartart. The topics addressed in these templates are Website Traffic, Product Sales Increment, Total Product Revenue. All the content presented in this PPT design is completely editable. Download it and make adjustments in color, background, font etc. as per your unique business setting.
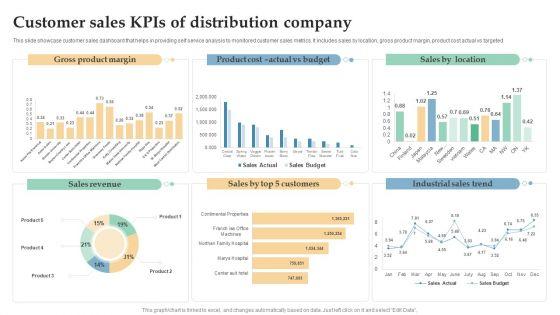

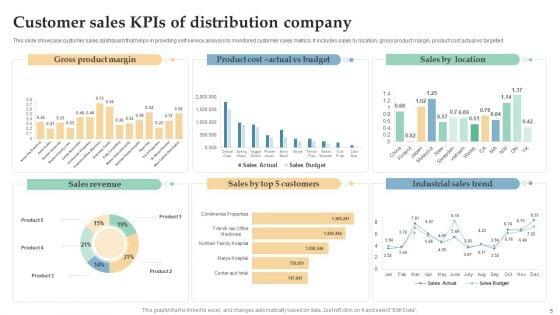
This slide showcase customer sales dashboard that helps in providing self service analysis to monitored customer sales metrics. It includes sales by location, gross product margin, product cost actual vs targeted. Showcasing this set of slides titled Customer Sales Kpis Of Distribution Company Ppt Infographic Template Templates PDF. The topics addressed in these templates are Gross Product Margin, Sales Revenue, Industrial Sales Trend. All the content presented in this PPT design is completely editable. Download it and make adjustments in color, background, font etc. as per your unique business setting.


This slide shows the dashboard that represents metrics to measure audience reach across social media channels which includes views, clicks, likes, impressions, actions, tweets, followers, interactions, etc. Deliver an awe inspiring pitch with this creative Online Marketing Tactics To Enhance Sales Kpis To Measure Audience Reach Across Social Media Professional PDF bundle. Topics like LinkedIn Channel, Facebook Account, Twitter, Facebook Ads can be discussed with this completely editable template. It is available for immediate download depending on the needs and requirements of the user.
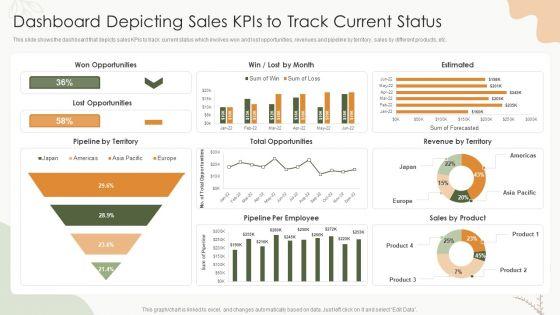

This slide shows the dashboard that depicts sales KPIs to track current status which involves won and lost opportunities, revenues and pipeline by territory, sales by different products, etc.Deliver an awe inspiring pitch with this creative Sales Procedure Automation To Enhance Sales Dashboard Depicting Sales Kpis To Track Current Status Introduction PDF bundle. Topics like Won Opportunities, Total Opportunities, Pipeline Employee can be discussed with this completely editable template. It is available for immediate download depending on the needs and requirements of the user.
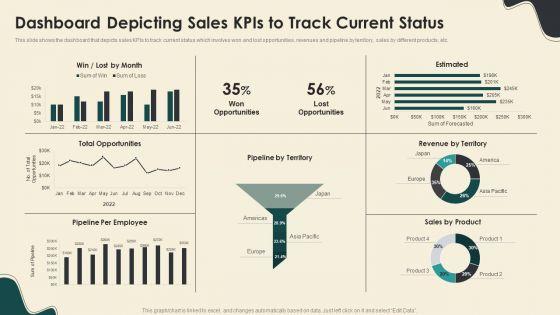
This slide shows the dashboard that depicts sales KPIs to track current status which involves won and lost opportunities, revenues and pipeline by territory, sales by different products, etc. Deliver and pitch your topic in the best possible manner with this Dashboard Depicting Sales Kpis To Track Current Status Structure PDF. Use them to share invaluable insights on Total Opportunities, Revenue By Territory, Sales By Product and impress your audience. This template can be altered and modified as per your expectations. So, grab it now.


This slide shows the dashboard that depicts product sales metrics which focuses on revenue generated from top products, incremental sales by campaign, cost of goods sold, etc. Deliver an awe inspiring pitch with this creative Competitive Sales Strategy Development Plan For Revenue Growth Dashboard Depicting Product Sales Kpis Elements PDF bundle. Topics like Incremental Sales, Cost, Store Purchases can be discussed with this completely editable template. It is available for immediate download depending on the needs and requirements of the user.
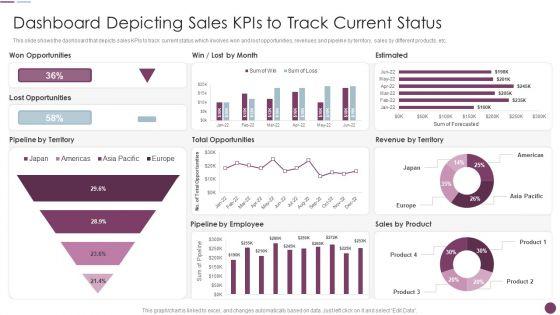

This slide shows the dashboard that depicts sales KPIs to track current status which involves won and lost opportunities, revenues and pipeline by territory, sales by different products, etc. Deliver an awe inspiring pitch with this creative Sales Automation Procedure Dashboard Depicting Sales Kpis To Track Current Status Sample PDF bundle. Topics like Estimated, Pipeline Employee, Pipeline Territory can be discussed with this completely editable template. It is available for immediate download depending on the needs and requirements of the user.
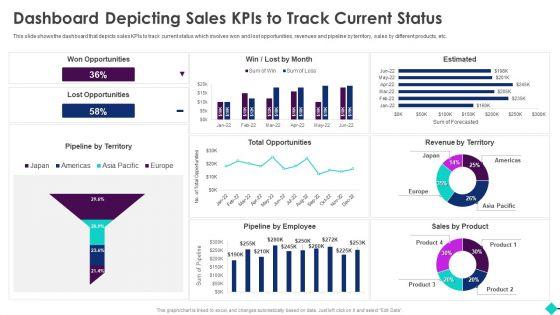
This slide shows the dashboard that depicts sales KPIs to track current status which involves won and lost opportunities, revenues and pipeline by territory, sales by different products, etc.Deliver and pitch your topic in the best possible manner with this Sales Process Automation For Revenue Growth Dashboard Depicting Sales Kpis To Track Current Status Introduction PDF. Use them to share invaluable insights on Marketing Effectiveness, Forecast Accuracy, Pipeline Thickness and impress your audience. This template can be altered and modified as per your expectations. So, grab it now.
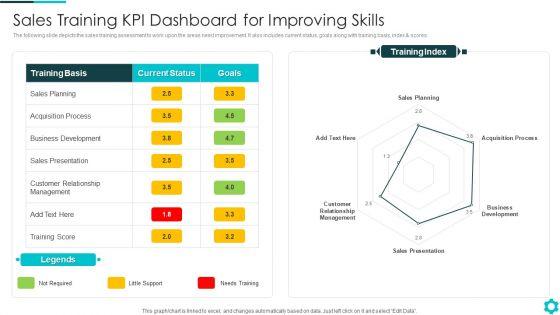
The following slide depicts the sales training assessment to work upon the areas need improvement. It also includes current status, goals along with training basis, index and scores.Showcasing this set of slides titled Sales Training KPI Dashboard For Improving Skills Portrait PDF The topics addressed in these templates are Acquisition Process, Sales Presentation, Customer Relationship Management All the content presented in this PPT design is completely editable. Download it and make adjustments in color, background, font etc. as per your unique business setting.
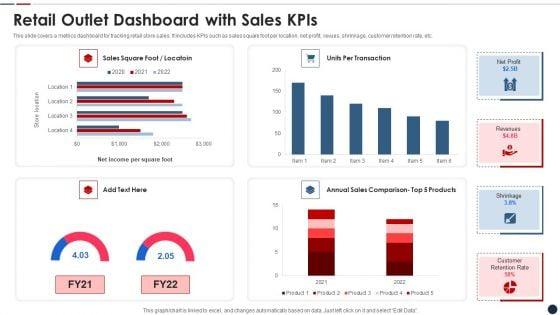

This slide covers a metrics dashboard for tracking retail store sales. It includes KPIs such as sales square foot per location, net profit, revues, shrinkage, customer retention rate, etc. Pitch your topic with ease and precision using this retail outlet dashboard with sales kpis clipart pdf This layout presents information on Retail outlet dashboard with sales kpis It is also available for immediate download and adjustment. So, changes can be made in the color, design, graphics or any other component to create a unique layout.


The mentioned slide depicts the sales key performance indicators framework. This includes monthly sales growth, monthly calls and emails, leads to sales percentage and average conversion time. Presenting sales kpi framework ppt powerpoint presentation gallery show pdf to dispense important information. This template comprises four stages. It also presents valuable insights into the topics including growth, sales, emails This is a completely customizable PowerPoint theme that can be put to use immediately. So, download it and address the topic impactfully.


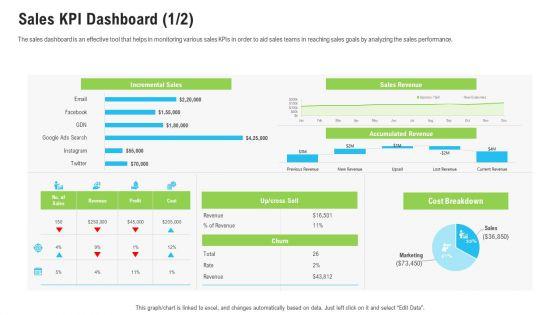
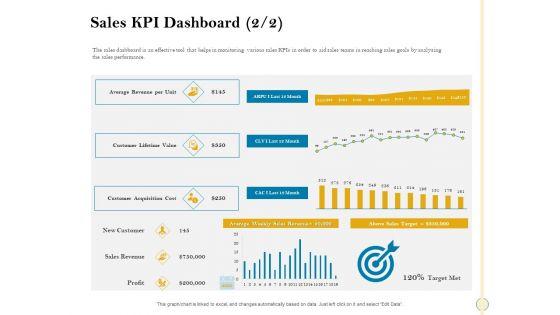
The sales dashboard is an effective tool that helps in monitoring various sales KPIs in order to aid sales teams in reaching sales goals by analyzing the sales performance. Deliver and pitch your topic in the best possible manner with this sales assistance boost overall efficiency sales kpi dashboard new topics pdf. Use them to share invaluable insights on customer acquisition cost, customer lifetime value, average revenue and impress your audience. This template can be altered and modified as per your expectations. So, grab it now.

The sales dashboard is an effective tool that helps in monitoring various sales KPIs in order to aid sales teams in reaching sales goals by analyzing the sales performance. Deliver an awe-inspiring pitch with this creative sales assistance boost overall efficiency sales kpi dashboard ppt pictures file formats pdf bundle. Topics like sales revenue, cost breakdown, incremental sales can be discussed with this completely editable template. It is available for immediate download depending on the needs and requirements of the user.
The sales dashboard is an effective tool that helps in monitoring various sales KPIs in order to aid sales teams in reaching sales goals by analyzing the sales performance. Deliver and pitch your topic in the best possible manner with this sales department strategies increase revenues sales kpi dashboard ppt icon visual aids pdf. Use them to share invaluable insights on average revenue, customer lifetime value, customer acquisition cost and impress your audience. This template can be altered and modified as per your expectations. So, grab it now.
The sales dashboard is an effective tool that helps in monitoring various sales KPIs in order to aid sales teams in reaching sales goals by analyzing the sales performance. Deliver an awe-inspiring pitch with this creative sales department strategies increase revenues sales kpi dashboard email ppt outline microsoft pdf bundle. Topics like sales revenue, cost breakdown, marketing can be discussed with this completely editable template. It is available for immediate download depending on the needs and requirements of the user.
The sales dashboard is an effective tool that helps in monitoring various sales KPIs in order to aid sales teams in reaching sales goals by analyzing the sales performance. Deliver an awe inspiring pitch with this creative sales optimization best practices to close more deals sales kpi dashboard revenue diagrams pdf bundle. Topics like sales kpi dashboard can be discussed with this completely editable template. It is available for immediate download depending on the needs and requirements of the user.
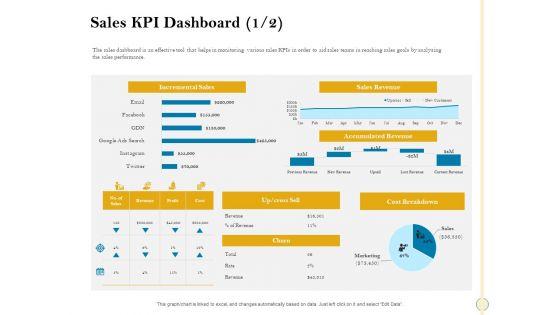
The sales dashboard is an effective tool that helps in monitoring various sales KPIs in order to aid sales teams in reaching sales goals by analyzing the sales performance. Deliver and pitch your topic in the best possible manner with this sales optimization best practices to close more deals sales kpi dashboard accumulated topics pdf. Use them to share invaluable insights on incremental sales, sales revenue, cost breakdown, accumulated revenue and impress your audience. This template can be altered and modified as per your expectations. So, grab it now.


Presenting this set of slides with name sales kpis with target count by industry ppt powerpoint presentation gallery infographic template pdf. The topics discussed in these slides are pipeline revenue by deal stage and deal lead, contribution from closed deals, target count by industry, vertical And deal rationale, target count by region, reason for target rejection. This is a completely editable PowerPoint presentation and is available for immediate download. Download now and impress your audience.
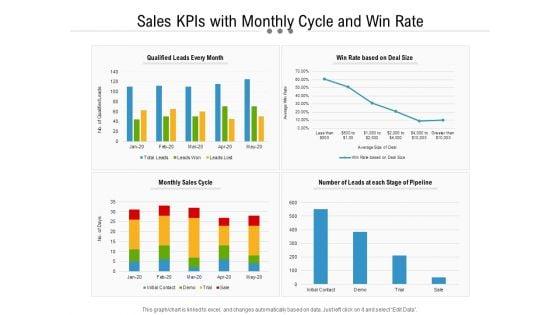

Presenting this set of slides with name sales kpis with monthly cycle and win rate ppt powerpoint presentation ideas graphic tips pdf. The topics discussed in these slides are qualified leads every month, win rate based on deal size, monthly sales cycle, number of leads at each stage of pipeline. This is a completely editable PowerPoint presentation and is available for immediate download. Download now and impress your audience.
Presenting this set of slides with name sales kpis with lead status by owner ppt powerpoint presentation icon shapes pdf. The topics discussed in these slides are top campaigns, expected revenue by marketing channel, new leads this month, reasons for unqualified leads, lead status by owner. This is a completely editable PowerPoint presentation and is available for immediate download. Download now and impress your audience.
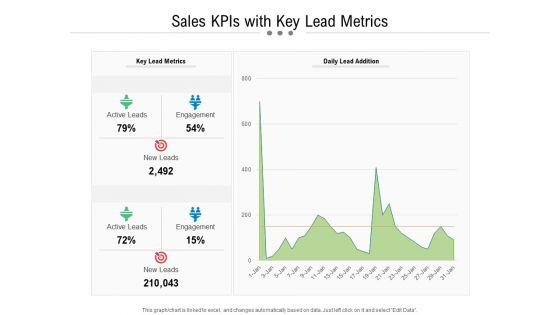
Presenting this set of slides with name sales kpis with key lead metrics ppt powerpoint presentation layouts background pdf. The topics discussed in these slides are key lead metrics, daily lead addition, active leads, engagement, new leads, active leads, engagement. This is a completely editable PowerPoint presentation and is available for immediate download. Download now and impress your audience.
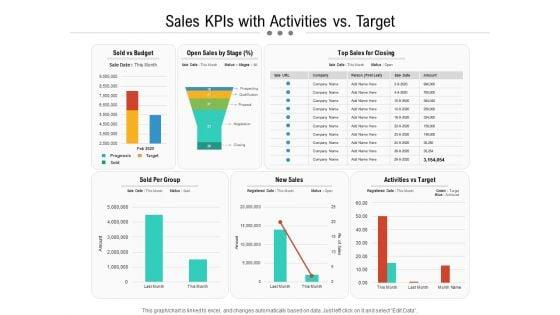
Presenting this set of slides with name sales kpis with activities vs target ppt powerpoint presentation infographic template inspiration pdf. The topics discussed in these slides are sold vs budget, open sales by stage, top sales for closing, sold per group, new sales, activities vs target. This is a completely editable PowerPoint presentation and is available for immediate download. Download now and impress your audience.
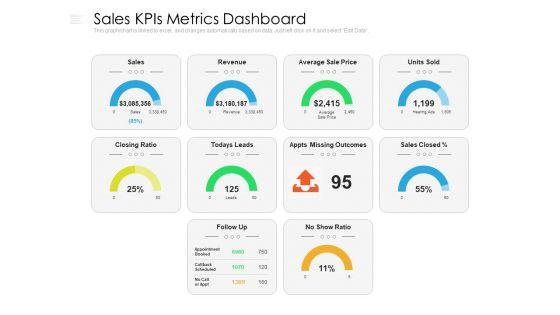
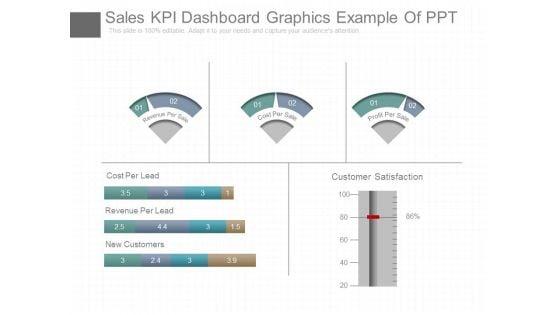
Presenting this set of slides with name sales kpis metrics dashboard ppt powerpoint presentation gallery demonstration pdf. The topics discussed in these slides are sales, revenue, price. This is a completely editable PowerPoint presentation and is available for immediate download. Download now and impress your audience.


Presenting this set of slides with name business sales kpis and metrics ppt powerpoint presentation file skills pdf. The topics discussed in these slides are sales, campaign, revenue. This is a completely editable PowerPoint presentation and is available for immediate download. Download now and impress your audience.
Presenting this set of slides with name sales kpis with revenue in last 12 weeks ppt powerpoint presentation infographic template icons pdf. The topics discussed in these slides are sales growth, current period, previous period, sales revenue, sales representative, last 12 weeks. This is a completely editable PowerPoint presentation and is available for immediate download. Download now and impress your audience.
Presenting this set of slides with name sales kpis with methods and value ppt powerpoint presentation file icons pdf. This is a four stage process. The stages in this process are email, value, email, self serve, sales. This is a completely editable PowerPoint presentation and is available for immediate download. Download now and impress your audience.
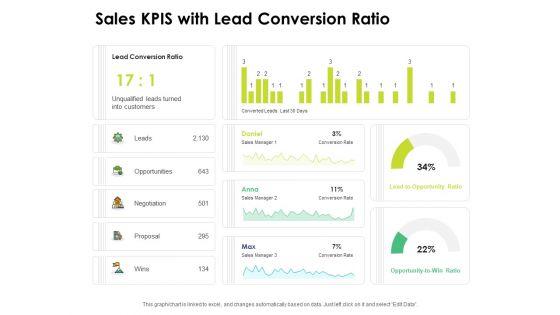
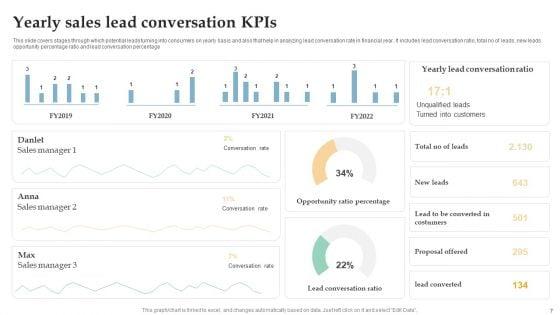
Presenting this set of slides with name sales kpis with lead conversion ratio ppt powerpoint presentation infographic template examples pdf. The topics discussed in these slides are lead conversion ratio, opportunities, proposal, wins, opportunities. This is a completely editable PowerPoint presentation and is available for immediate download. Download now and impress your audience.
SHOW
- 60
- 120
- 180
DISPLAYING: 60 of 91 Item(s)
Page