AI PPT Maker
Templates
PPT Bundles
Design Services
Business PPTs
Business Plan
Management
Strategy
Introduction PPT
Roadmap
Self Introduction
Timelines
Process
Marketing
Agenda
Technology
Medical
Startup Business Plan
Cyber Security
Dashboards
SWOT
Proposals
Education
Pitch Deck
Digital Marketing
KPIs
Project Management
Product Management
Artificial Intelligence
Target Market
Communication
Supply Chain
Google Slides
Research Services
One Pagers
All Categories
Sales Dashboard PowerPoint Presentation Templates and Google Slides
SHOW
- 60
- 120
- 180
DISPLAYING: 60 of 309 Item(s)
Page


Slide 1 of 12
Boost your confidence and team morale with this well-structured Sales Kpis Ppt PowerPoint Presentation Complete Deck With Slides. This prefabricated set gives a voice to your presentation because of its well-researched content and graphics. Our experts have added all the components very carefully, thus helping you deliver great presentations with a single click. Not only that, it contains a set of twelve slides that are designed using the right visuals, graphics, etc. Various topics can be discussed, and effective brainstorming sessions can be conducted using the wide variety of slides added in this complete deck. Apart from this, our PPT design contains clear instructions to help you restructure your presentations and create multiple variations. The color, format, design anything can be modified as deemed fit by the user. Not only this, it is available for immediate download. So, grab it now.


Slide 1 of 12
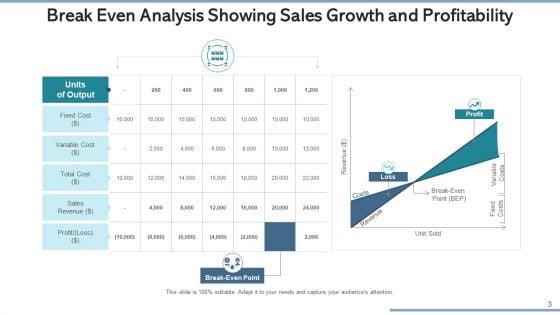
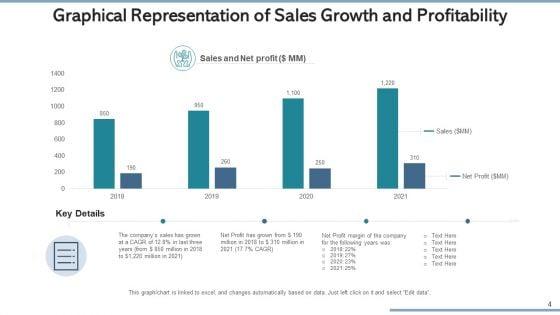
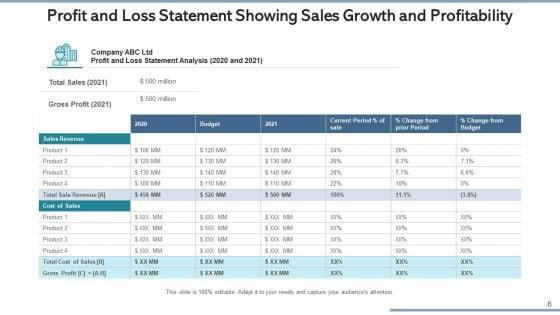
Sales Growth And Profitability Sales Dashboard Ppt PowerPoint Presentation Complete Deck With Slides
If designing a presentation takes a lot of your time and resources and you are looking for a better alternative, then this sales growth and profitability sales dashboard ppt powerpoint presentation complete deck with slides is the right fit for you. This is a prefabricated set that can help you deliver a great presentation on the topic. All the twelve slides included in this sample template can be used to present a birds-eye view of the topic. These slides are also fully editable, giving you enough freedom to add specific details to make this layout more suited to your business setting. Apart from the content, all other elements like color, design, theme are also replaceable and editable. This helps in designing a variety of presentations with a single layout. Not only this, you can use this PPT design in formats like PDF, PNG, and JPG once downloaded. Therefore, without any further ado, download and utilize this sample presentation as per your liking.


Slide 1 of 7
This is a sales management dashboard ppt slide template. This is a four stage process. The stages in this process are weight, goal, overall territory performance, score.


Slide 1 of 7
This is a sales kpis funnel chart powerpoint slide background image. This is a one stage process. The stages in this process are campaigns to drive traffic, visitors, trials, closed deals, sales.


Slide 1 of 7
This is a sales kpi target powerpoint slide background picture. This is a four stage process. The stages in this process are business, management, marketing, finance, strategy.


Slide 1 of 7
This is a sales kpi examples from managers powerpoint slide background designs. This is a three stage process. The stages in this process are successful, no answer, call busy, disconnected, wrong number, unavailable, not interested, demo booked.


Slide 1 of 7
This is a high performance sales kpis diagram ppt templates. This is a ten stage process. The stages in this process are strategy map, kpis, action plan, benchmarks, objective, evaluation, measurement, success, strategy, dashboard.


Slide 1 of 6
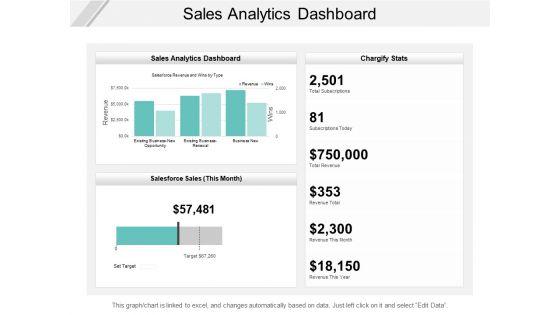
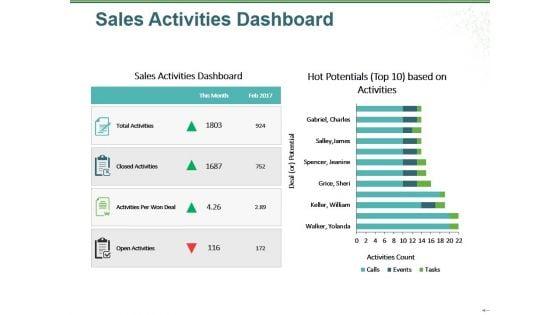
Presenting this set of slides with name sales analytics dashboard ppt powerpoint presentation outline diagrams. The topics discussed in these slides are buzz marketing, process, strategy. This is a completely editable PowerPoint presentation and is available for immediate download. Download now and impress your audience.


Slide 1 of 6
This is a sales performance dashboard business ppt powerpoint presentation pictures visuals . This is a three stage process. The stages in this process are finance, marketing, management, investment, analysis.


Slide 1 of 6
This is a sales performance dashboard marketing ppt powerpoint presentation slides graphics design. This is a four stage process. The stages in this process are compare, marketing, business, management, planning.


Slide 1 of 6
This is a sales performance dashboard ppt powerpoint presentation gallery outline. This is a three stage process. The stages in this process are finance, marketing, management, investment, analysis.


Slide 1 of 6
This is a sales kpi tracker marketing ppt powerpoint presentation icon themes. This is a three stage process. The stages in this process are finance, marketing, management, investment, analysis.


Slide 1 of 6
This is a sales kpi tracker ppt powerpoint presentation outline tips. This is a six stage process. The stages in this process are finance, analysis, business, investment, marketing.


Slide 1 of 6
This is a sales profitability dashboard income per item ppt powerpoint presentation professional graphic images. This is a five stage process. The stages in this process are business analytics, ba, organizations data.


Slide 1 of 6
This is a product sales report dashboard for profit margin analysis ppt powerpoint presentation ideas slide portrait. This is a four stage process. The stages in this process are business analytics, ba, organizations data.


Slide 1 of 6
This is a business sales dashboard revenue summary report ppt powerpoint presentation pictures structure. This is a two stage process. The stages in this process are business analytics, ba, organizations data.


Slide 1 of 6
This is a sales performance dashboard template 2 of 2 ppt powerpoint presentation infographics design inspiration. This is a three stage process. The stages in this process are finance, management, strategy, analysis, marketing.


Slide 1 of 5
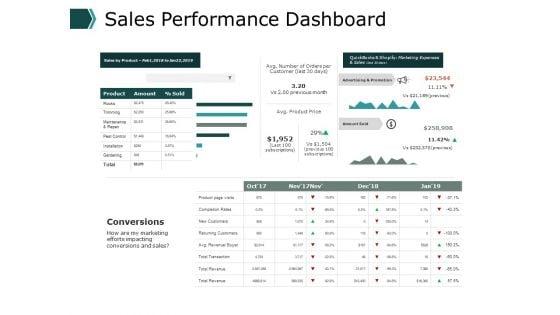
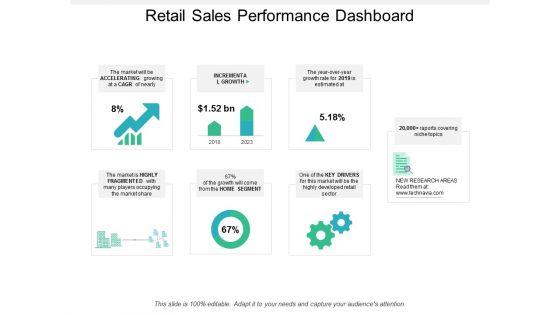
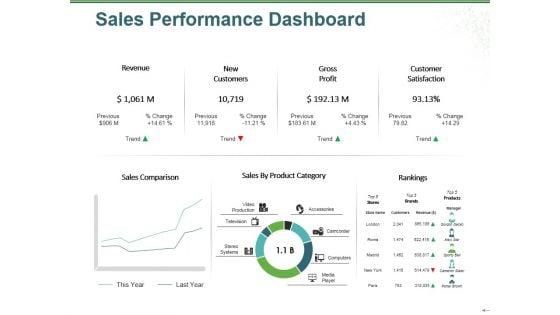
Presenting this set of slides with name retail sales performance dashboard ppt powerpoint presentation summary portfolio. The topics discussed in these slides are retail, business strategies, sales strategy. This is a completely editable PowerPoint presentation and is available for immediate download. Download now and impress your audience.


Slide 1 of 5
This is a sales performance dashboard ppt powerpoint presentation pictures icons. This is a six stage process. The stages in this process are top selling plans, top opportunities, new customer, sales funnel, top sales reps.


Slide 1 of 5
This is a sales performance dashboard top opportunities ppt powerpoint presentation layouts template. This is a eight stage process. The stages in this process are revenue, new customer, gross profit, customer satisfaction, brand profitability.


Slide 1 of 5
This is a sales performance dashboard template ppt powerpoint presentation professional elements. This is a eight stage process. The stages in this process are sales comparison, sales by product category, sales by month, brand profitability, revenue.


Slide 1 of 5
This is a sales performance dashboard template ppt powerpoint presentation slides example file. This is a six stage process. The stages in this process are business, marketing, strategy, finance, planning.


Slide 1 of 5
This is a sales performance dashboard template ppt powerpoint presentation slides example file. This is a eight stage process. The stages in this process are business, marketing, strategy, finance, planning.


Slide 1 of 5
This is a sales performance dashboard ppt powerpoint presentation show graphics design. This is a two stage process. The stages in this process are sales comparison, sales by product category, rankings, customer satisfaction, revenue.


Slide 1 of 5
This is a sales kpi tracker ppt powerpoint presentation pictures layout ideas. This is a four stage process. The stages in this process are opportunities won, top products in revenue, leads created, win ratio vs last yr, open deals vs.


Slide 1 of 5
This is a sales kpi performance summary ppt powerpoint presentation show themes. This is a three stage process. The stages in this process are revenue comparison, quantity comparison, product sales mix, markets, sales channel.


Slide 1 of 5
This is a sales activities dashboard ppt powerpoint presentation show skills. This is a four stage process. The stages in this process are total activities, closed activities, activities per won deal, open activities, this month.


Slide 1 of 5
This is a sales performance dashboard template 2 ppt powerpoint presentation infographic template clipart. This is a six stage process. The stages in this process are top sales reps, new customer, sales funnel, top selling plans, top opportunities.


Slide 1 of 5
This is a sales performance dashboard template 1 ppt powerpoint presentation infographic template maker. This is a eight stage process. The stages in this process are dollar, business, finance, marketing.


Slide 1 of 5
This is a sales performance dashboard ppt powerpoint presentation outline file formats. This is a three stage process. The stages in this process are revenue, new customers, gross profit, customer satisfaction, rankings.


Slide 1 of 5
This is a sales kpi tracker ppt powerpoint presentation gallery shapes. This is a six stage process. The stages in this process are target growth, leads created, sales ratio, last year, stretched growth.


Slide 1 of 5
This is a sales kpi performance summary ppt powerpoint presentation show inspiration. This is a two stage process. The stages in this process are revenue comparison, quantity comparison, product sales mix, regional sales mix, budget.


Slide 1 of 5
This is a sales activities dashboard ppt powerpoint presentation inspiration clipart images. This is a two stage process. The stages in this process are sales activities dashboard, total activities, closed activities, activities per won deal.


Slide 1 of 5
This is a sales performance dashboard ppt powerpoint presentation ideas format ideas. This is a three stage process. The stages in this process are rankings, revenue, new customers, gross profit, customer satisfaction.


Slide 1 of 5
This is a sales kpi tracker ppt powerpoint presentation pictures designs. This is a two stage process. The stages in this process are leads created, sales ratio, opportunities won, top products in revenue, win ratio vs last yr.


Slide 1 of 5
This is a sales kpi performance summary ppt powerpoint presentation ideas graphics template. This is a seven stage process. The stages in this process are revenue comparison, quantity comparison, product sales mix, regional sales mix.


Slide 1 of 5
This is a sales activities dashboard ppt powerpoint presentation icon graphics. This is a two stage process. The stages in this process are business, finance, management, analysis, budget, actual.


Slide 1 of 5
This is a sales performance dashboard ppt powerpoint presentation ideas portfolio. This is a three stage process. The stages in this process are revenue, new customers, gross profit, customer satisfaction, sales comparison.


Slide 1 of 5
This is a sales kpi tracker ppt powerpoint presentation visual aids files. This is a six stage process. The stages in this process are leads created, sales ratio, opportunities won, top products in revenue, open deals vs last yr.


Slide 1 of 5
This is a sales kpi performance summary ppt powerpoint presentation infographic template infographics. This is a seven stage process. The stages in this process are revenue comparison, quantity comparison, product sales mix, regional sales mix.


Slide 1 of 5
This is a sales activities dashboard ppt powerpoint presentation ideas themes. This is a two stage process. The stages in this process are total activities, closed activities, activities per won deal, open activities.


Slide 1 of 5
This is a sales performance dashboard ppt powerpoint presentation gallery backgroun. This is a six stage process. The stages in this process are sales comparison, sales by product category, rankings, revenue, new customers.


Slide 1 of 5
This is a sales kpi tracker ppt powerpoint presentation icon themes. This is a six stage process. The stages in this process are business, marketing, opportunities won, top products in revenue, leads created.


Slide 1 of 5
This is a sales kpi performance summary ppt powerpoint presentation infographics model. This is a seven stage process. The stages in this process are sales channel, revenue comparison, quantity comparison, business, marketing.


Slide 1 of 5
This is a sales activities dashboard ppt powerpoint presentation pictures model. This is a two stage process. The stages in this process are open activities, activities per won deal, closed activities, total activities, business.


Slide 1 of 5
This is a sales performance dashboard ppt powerpoint presentation infographics mockup. This is a three stage process. The stages in this process are sales comparison, sales by product category, rankings, revenue, gross profit.


Slide 1 of 5
This is a sales kpi tracker ppt powerpoint presentation layout. This is a six stage process. The stages in this process are leads created, sales ratio, opportunities won, top products in revenue, actual.


Slide 1 of 5
This is a sales kpi performance summary ppt powerpoint presentation infographic template elements. This is a seven stage process. The stages in this process are revenue comparison, quantity comparison, product sales mix, regional sales mix, budget.


Slide 1 of 5
This is a sales activities dashboard ppt powerpoint presentation slides designs download. This is a four stage process. The stages in this process are total activities, closed activities, activities per won deal, open activities, activities count.


Slide 1 of 5
This is a sales rep kpi tracker ppt powerpoint presentation portfolio file formats. This is a three stage process. The stages in this process are successful, no answer, call busy, disconnected, wrong number.


Slide 1 of 5
This is a sales performance dashboard ppt powerpoint presentation styles images. This is a five stage process. The stages in this process are total sale amount, record count, sales count, total sales amount, total sales by month.


Slide 1 of 5
This is a sales rep kpi tracker ppt powerpoint presentation inspiration outfit. This is a five stage process. The stages in this process are total calls attempted, successful, call busy, no answer, demo booked.


Slide 1 of 5
This is a crm dashboard sales dashboard template ppt powerpoint presentation professional layout. This is a four stage process. The stages in this process are lead owner breakdown, sales by product march 2017, total lead ownership, month over month closing trend.


Slide 1 of 5
This is a sales performance dashboard ppt powerpoint presentation file graphics pictures. This is a five stage process. The stages in this process are total sales by month, sales count, opportunities total sales by probability, total sale amount.


Slide 1 of 5
This is a crm sales rep dashboard ppt powerpoint presentation portfolio graphics download. This is a three stage process. The stages in this process are actual vs goal, opportunities est close next 25 days, opp duration by pipeline.


Slide 1 of 5
This is a crm dashboard sales dashboard template ppt powerpoint presentation portfolio master slide. This is a four stage process. The stages in this process are sales by product march, total lead ownership, month over month closing trend, lead owner breakdown.


Slide 1 of 5
This is a crm sales rep dashboard ppt powerpoint presentation clipart. This is a three stage process. The stages in this process are identity, qualification, develop, proposal, negotiation.


Slide 1 of 5
This is a crm dashboard sales dashboard template ppt powerpoint presentation microsoft. This is a four stage process. The stages in this process are lead owner breakdown, month over month closing trend, total lead ownership, sales by product march 2017.


Slide 1 of 5
This is a crm sales rep dashboard ppt powerpoint presentation influencers. This is a three stage process. The stages in this process are opp duration by pipeline, actual vs goal, opportunities est close next 25 days.


Slide 1 of 5
This is a crm dashboard sales dashboard ppt powerpoint presentation themes. This is a four stage process. The stages in this process are month over month closing trend, lead owner breakdown, total lead ownership, sales by product march 2017.
SHOW
- 60
- 120
- 180
DISPLAYING: 60 of 309 Item(s)
Page