AI PPT Maker
Templates
PPT Bundles
Design Services
Business PPTs
Business Plan
Management
Strategy
Introduction PPT
Roadmap
Self Introduction
Timelines
Process
Marketing
Agenda
Technology
Medical
Startup Business Plan
Cyber Security
Dashboards
SWOT
Proposals
Education
Pitch Deck
Digital Marketing
KPIs
Project Management
Product Management
Artificial Intelligence
Target Market
Communication
Supply Chain
Google Slides
Research Services
 One Pagers
All Categories
Sales Graph PowerPoint Presentation Templates and Google Slides
SHOW
- 60
- 120
- 180
DISPLAYING: 60 of 142 Item(s)
Page


Slide 1 of 7
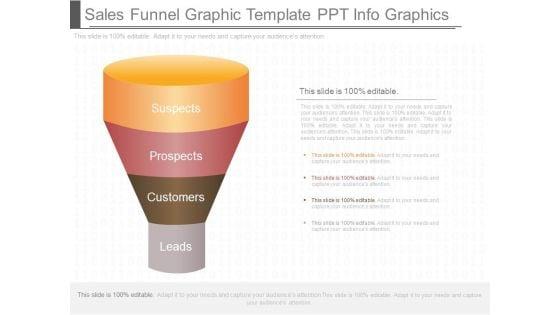
This is a sales funnel graphic template ppt info graphics. This is a four stage process. The stages in this process are suspects, prospects, customers, leads.




Slide 1 of 7
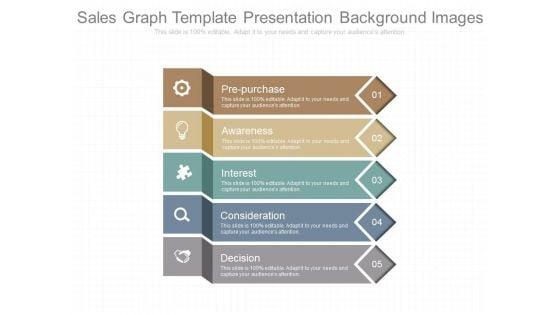
This is a sales graph template presentation background images. This is a five stage process. The stages in this process are pre purchase, awareness, interest, consideration, decision.


Slide 1 of 6
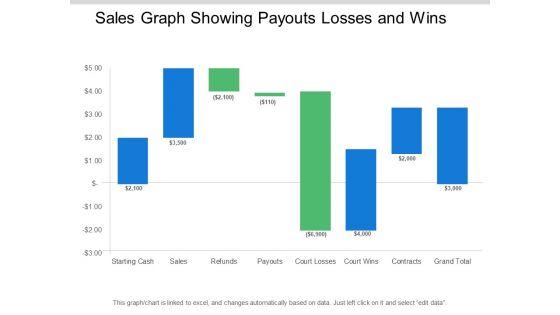
This is a sales graph showing payouts losses and wins ppt powerpoint presentation pictures designs download. This is a eight stage process. The stages in this process are sales waterfall, waterfall chart, business.
Slide 1 of 5
Presenting this set of slides with name sales growth graph vector icon ppt powerpoint presentation ideas information. This is a three stage process. The stages in this process are revenue generation, business, strategies. This is a completely editable PowerPoint presentation and is available for immediate download. Download now and impress your audience.
Slide 1 of 5
Presenting this set of slides with name sales growth graph vector icon ppt powerpoint presentation icon ideas. This is a one stage process. The stages in this process are industry trends, financial services, term business planning. This is a completely editable PowerPoint presentation and is available for immediate download. Download now and impress your audience.


Slide 1 of 5
This is a channel sales performance graph ppt slide examples. This is a four stage process. The stages in this process are jan, feb, mar, apr, may, jun, jul, aug, sep.


Slide 1 of 3
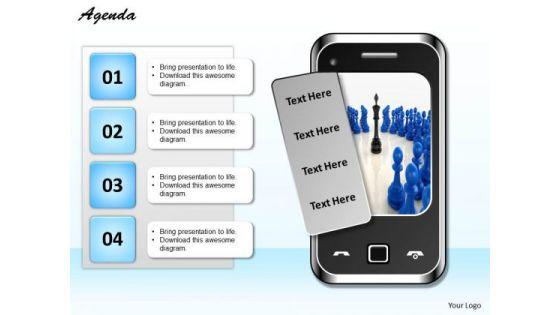
Establish Your Dominion With Our sales diagram Graphic Of Mobile With Four Business Finance Strategy Development Powerpoint Templates. Rule The Stage With Your Thoughts.
Slide 1 of 3
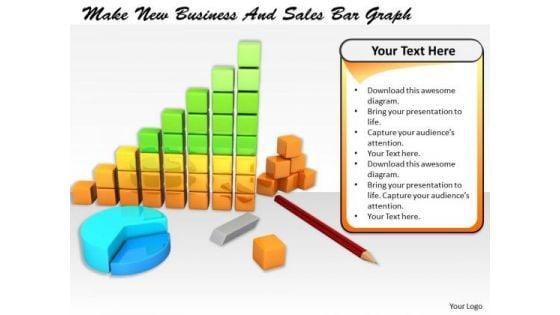
Document The Process On Our Stock Photo Business Concepts Make New And Sales Bar Graph Images Graphics Powerpoint Templates. Make A Record Of Every Detail. Satiate Desires With Our sales Powerpoint Templates. Give Them All They Want And More.


Slide 1 of 3
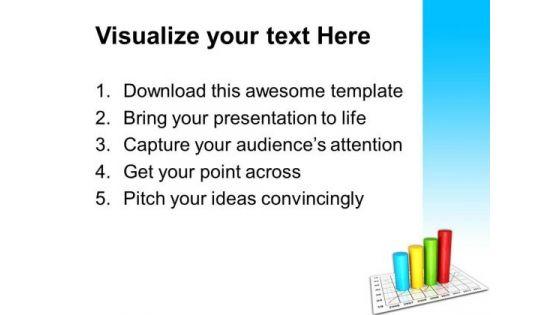
Products Sale Graph Business PowerPoint Templates And PowerPoint Themes 0912-Microsoft Powerpoint Templates and Background with business graph-Business graph, competition, business, finance, sales, Money Your audience deserves the absolute best. Give them better than that with our Products Sale Graph Business PowerPoint Templates And PowerPoint Themes 0912.


Slide 1 of 3
Products Sale Graph Business PowerPoint Templates And PowerPoint Themes 0812-Microsoft Powerpoint Templates and Background with sales growth business chart Face up to any adversity with our Products Sale Graph Business PowerPoint Templates And PowerPoint Themes 0812. They will help your ideas dominate.
Slide 1 of 3
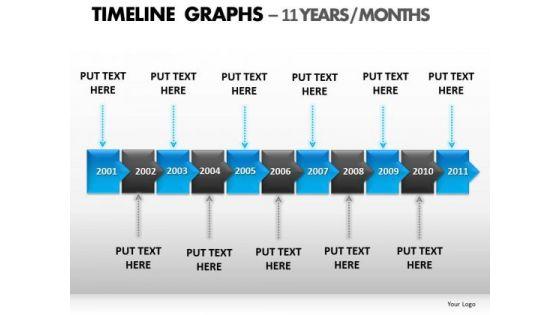
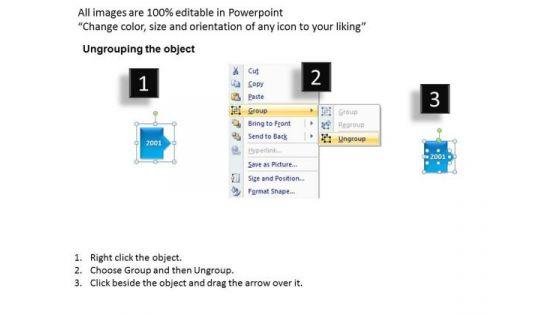
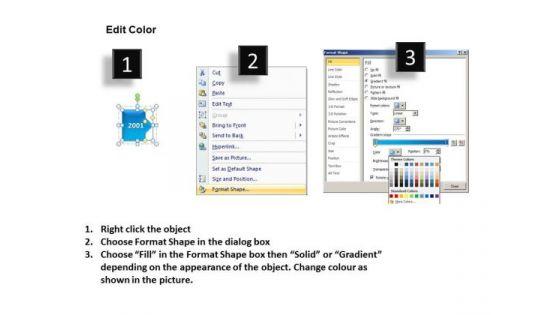
PowerPoint Themes Sales TimeLine Graphs PPT Presentation-These high quality powerpoint pre-designed slides and powerpoint templates have been carefully created by our professional team to help you impress your audience. All slides have been created and are 100% editable in powerpoint. Each and every property of any graphic - color, size, orientation, shading, outline etc. can be modified to help you build an effective powerpoint presentation. Any text can be entered at any point in the powerpoint template or slide. Simply DOWNLOAD, TYPE and PRESENT! Lead your army with our PowerPoint Themes Sales Timeline Graphs Ppt Presentation. You will come out on top.


Slide 1 of 3
Microsoft PowerPoint Theme and Slide with gift business on christmas and new year Heal the misdirected with our Sales Graph Christmas PowerPoint Themes And PowerPoint Slides 0611. Try us out and see what a difference our templates make.
Slide 1 of 3
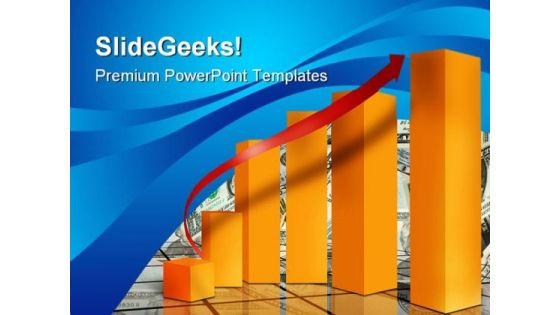
Microsoft PowerPoint Template and Background with sales or progress graph Our Market Sales Graph Success PowerPoint Templates And PowerPoint Backgrounds 0711 help the audience catch on fast. They assist them in quick assimilation.

Slide 1 of 3
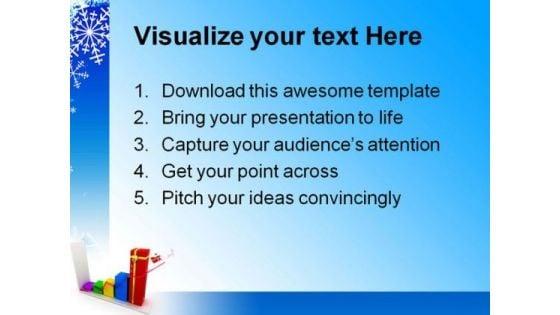
Microsoft PowerPoint Template and Background with gift business on christmas and new year Tilt the balance with our Sales Graph Christmas PowerPoint Templates And PowerPoint Backgrounds 0611. Add to the weightage of your ideas.
Slide 1 of 3
Microsoft PowerPoint Template and Background with business 3D graph with arrow showing profits and gains Dont re-invent the wheel. Save time with our Colorful Sales Graph Business PowerPoint Templates And PowerPoint Backgrounds 0511. Make sure your presentation gets the attention it deserves.
Slide 1 of 3
Microsoft PowerPoint Template and Background with barcode with and increasing bar size depicting increasing sales Our Barcode Sales Graph Business PowerPoint Backgrounds And Templates 1210 designers have great aesthetic sense. They treat each slide as a work of art.


Slide 1 of 2
The following slide highlights the major issues faced by organizations sales department in grabbing more deals. It mainly includes elements such as pipeline management, forecasting, adopting latest technology, budget constraints, training salesforce etc. Crafting an eye catching presentation has never been more straightforward. Let your presentation shine with this tasteful yet straightforward Mitigating Sales Risks With Strategic Action Planning Assessing Sales Risks Level And Its Impact Demonstration PDF template. It offers a minimalistic and classy look that is great for making a statement. The colors have been employed intelligently to add a bit of playfulness while still remaining professional. Construct the ideal Mitigating Sales Risks With Strategic Action Planning Assessing Sales Risks Level And Its Impact Demonstration PDF that effortlessly grabs the attention of your audience. Begin now and be certain to wow your customers.
Slide 1 of 2
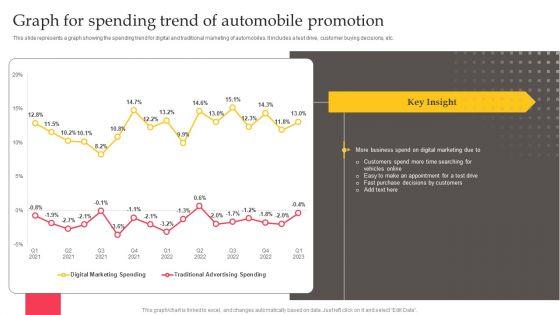
This slide represents a graph showing the spending trend for digital and traditional marketing of automobiles. It includes a test drive, customer buying decisions, etc. There are so many reasons you need a Executing Automotive Marketing Tactics For Sales Boost Graph For Spending Trend Information PDF. The first reason is you can not spend time making everything from scratch, Thus, Slidegeeks has made presentation templates for you too. You can easily download these templates from our website easily.

Slide 1 of 2
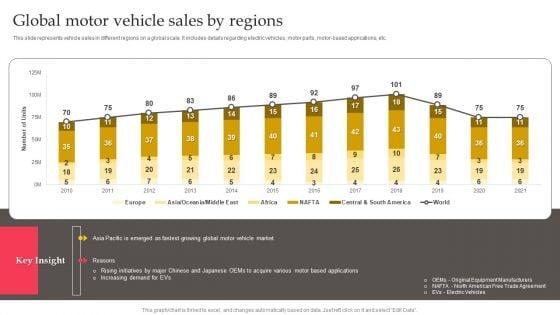
This slide represents vehicle sales in different regions on a global scale. It includes details regarding electric vehicles, motor parts, motor-based applications, etc. Take your projects to the next level with our ultimate collection of Executing Automotive Marketing Tactics For Sales Boost Global Motor Vehicle Sales Graphics PDF. Slidegeeks has designed a range of layouts that are perfect for representing task or activity duration, keeping track of all your deadlines at a glance. Tailor these designs to your exact needs and give them a truly corporate look with your own brand colors they will make your projects stand out from the rest.

Slide 1 of 2
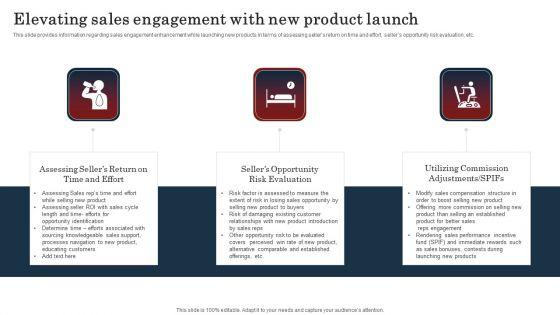
This slide provides information regarding sales engagement enhancement while launching new products in terms of assessing sellers return on time and effort, sellers opportunity risk evaluation, etc. Slidegeeks is one of the best resources for PowerPoint templates. You can download easily and regulate Commodity Launch Kickoff Administration Playbook Elevating Sales Engagement Graphics PDF for your personal presentations from our wonderful collection. A few clicks is all it takes to discover and get the most relevant and appropriate templates. Use our Templates to add a unique zing and appeal to your presentation and meetings. All the slides are easy to edit and you can use them even for advertisement purposes.
Slide 1 of 2
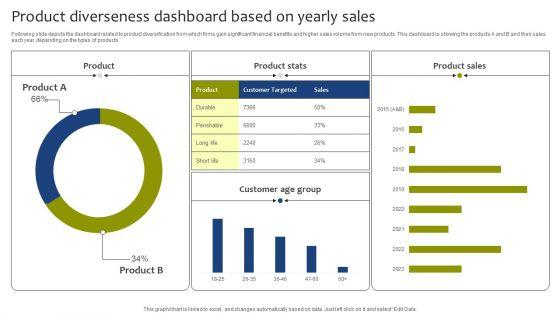
Following slide depicts the dashboard related to product diversification from which firms gain significant financial benefits and higher sales volume from new products. This dashboard is showing the products A and B and their sales each year depending on the types of products. Showcasing this set of slides titled Product Diverseness Dashboard Based On Yearly Sales Graphics PDF. The topics addressed in these templates areProduct Stats, Product Sales, Customer Age Group . All the content presented in this PPT design is completely editable. Download it and make adjustments in color, background, font etc. as per your unique business setting.
Slide 1 of 2
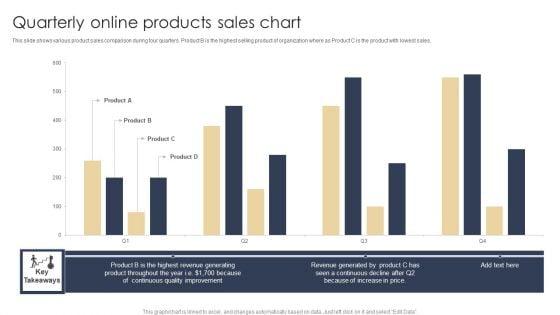
This slide shows various product sales comparison during four quarters. Product B is the highest selling product of organization where as Product C is the product with lowest sales. Showcasing this set of slides titled Quarterly Online Products Sales Chart Graphics PDF. The topics addressed in these templates are Revenue Generated, Increase In Price, Quality. All the content presented in this PPT design is completely editable. Download it and make adjustments in color, background, font etc. as per your unique business setting.

Slide 1 of 2
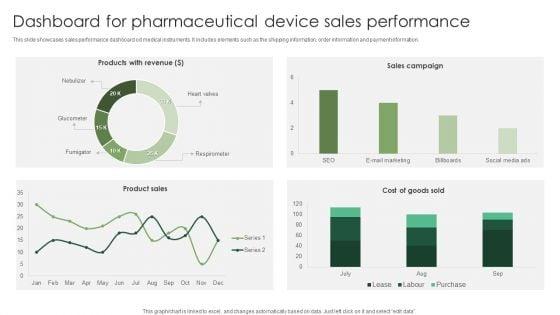
This slide showcases sales performance dashboard od medical instruments. It includes elements such as the shipping information, order information and payment information. Showcasing this set of slides titled Dashboard For Pharmaceutical Device Sales Performance Graphics PDF. The topics addressed in these templates are Pharmaceutical Device, Sales Performance. All the content presented in this PPT design is completely editable. Download it and make adjustments in color, background, font etc. as per your unique business setting.


Slide 1 of 2
This slide shows usage chart of electric cars world over to access present sales and future of EV. It includes years and number of electric cars sales. Showcasing this set of slides titled Global Electric Cars Sales Bar Graph Graphics PDF. The topics addressed in these templates are Electric Vehicle Sales, Electric Cars Purchased, Underdeveloped Technology. All the content presented in this PPT design is completely editable. Download it and make adjustments in color, background, font etc. as per your unique business setting.


Slide 1 of 2
This slide displays informational statistics about the firms expected sales revenue based on its brand extension strategy. It also implies that sales revenue will rise month after month.Explore a selection of the finest Brand Extension Positioning Example Projected Sales Revenue Graphics PDF here. With a plethora of professionally designed and pre-made slide templates, you can quickly and easily find the right one for your upcoming presentation. You can use our Brand Extension Positioning Example Projected Sales Revenue Graphics PDF to effectively convey your message to a wider audience. Slidegeeks has done a lot of research before preparing these presentation templates. The content can be personalized and the slides are highly editable. Grab templates today from Slidegeeks.
Slide 1 of 2
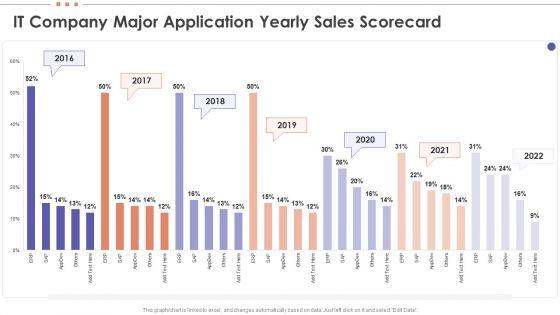
Deliver and pitch your topic in the best possible manner with this IT Company Major Application Yearly Sales Scorecard Graphics PDF. Use them to share invaluable insights on IT Company, Major Application, Yearly Sales Scorecard and impress your audience. This template can be altered and modified as per your expectations. So, grab it now.
Slide 1 of 2
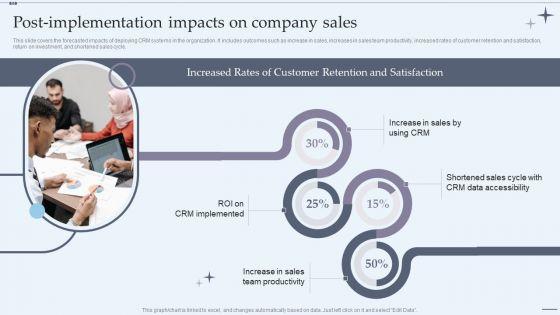
This slide covers the forecasted impacts of deploying CRM systems in the organization. It includes outcomes such as increase in sales, increases in sales team productivity, increased rates of customer retention and satisfaction, return on investment, and shortened sales cycle. Deliver an awe inspiring pitch with this creative CRM System Implementation Stages Postimplementation Impacts On Company Sales Graphics PDF bundle. Topics like Data Accessibility, Team Productivity, Increase In Sales can be discussed with this completely editable template. It is available for immediate download depending on the needs and requirements of the user.

Slide 1 of 2
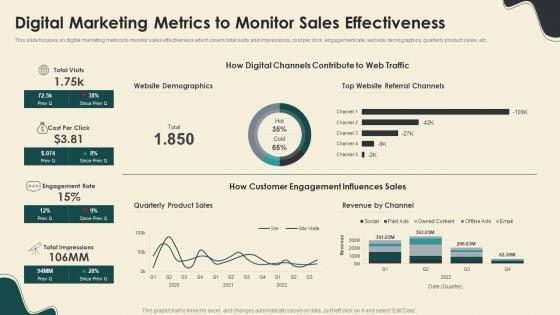
This slide focuses on digital marketing metrics to monitor sales effectiveness which covers total visits and impressions, cost per click, engagement rate, website demographics, quarterly product sales, etc. Deliver an awe inspiring pitch with this creative Digital Marketing Metrics To Monitor Sales Effectiveness Graphics PDF bundle. Topics like Website Demographics, Quarterly Product Sales, Revenue By Channel can be discussed with this completely editable template. It is available for immediate download depending on the needs and requirements of the user.


Slide 1 of 2
This slide shows the impact of automation on sales performance such as increase in lead qualification rate, pipeline thickness, sales forecast accuracy and response rate after sales process automation.Deliver an awe inspiring pitch with this creative Sales Process Automation For Revenue Growth Impact Of Automation On Sales Performance Graphics PDF bundle. Topics like Lead Qualification, Order Management, Marketing Automation can be discussed with this completely editable template. It is available for immediate download depending on the needs and requirements of the user.

Slide 1 of 2
This slide focuses on digital marketing metrics to monitor sales effectiveness which covers total visits and impressions, cost per click, engagement rate, website demographics, quarterly product sales, etc.Deliver and pitch your topic in the best possible manner with this Sales Process Automation For Revenue Growth Digital Marketing Metrics To Monitor Sales Effectiveness Graphics PDF. Use them to share invaluable insights on Automation Potential, Role Of Automation, Included Activities and impress your audience. This template can be altered and modified as per your expectations. So, grab it now.
Slide 1 of 2
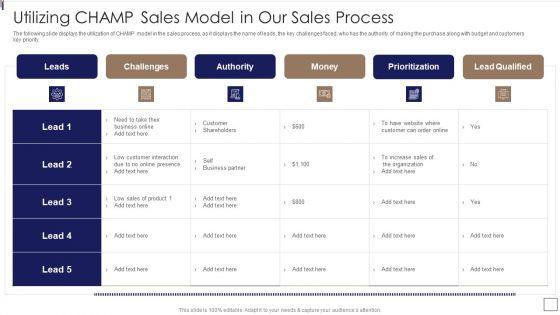
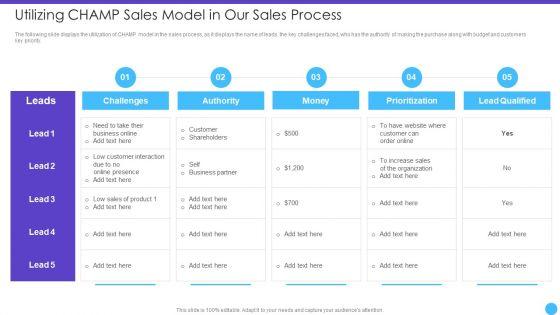
The following slide displays the utilization of CHAMP model in the sales process, as it displays the name of leads, the key challenges faced, who has the authority of making the purchase along with budget and customers key priority.Deliver and pitch your topic in the best possible manner with this Sales Lead Qualification Procedure And Parameter Utilizing CHAMP Sales Model In Our Sales Process Graphics PDF Use them to share invaluable insights on Prioritization, Lead Qualified, Challenges and impress your audience. This template can be altered and modified as per your expectations. So, grab it now.
Slide 1 of 2
The following slide displays the utilization of CHAMP model in the sales process, as it displays the name of leads, the key challenges faced, who has the authority of making the purchase along with budget and customers key priority.Deliver an awe inspiring pitch with this creative Sales Lead Qualification Rating Framework Utilizing CHAMP Sales Model In Our Sales Process Graphics PDF bundle. Topics like Customer Interaction, Prioritization, Lead Qualified can be discussed with this completely editable template. It is available for immediate download depending on the needs and requirements of the user.
Slide 1 of 2
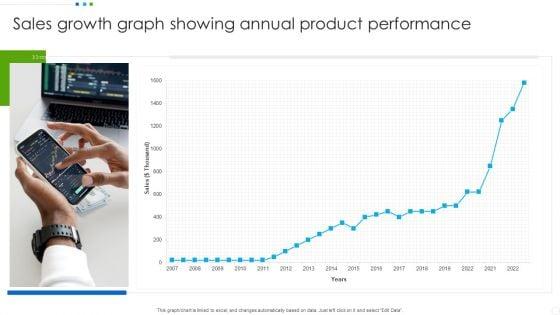
Pitch your topic with ease and precision using this Sales Growth Graph Showing Annual Product Performance Slides PDF. This layout presents information on Sales Growth, Product Performance. It is also available for immediate download and adjustment. So, changes can be made in the color, design, graphics or any other component to create a unique layout.
Slide 1 of 2
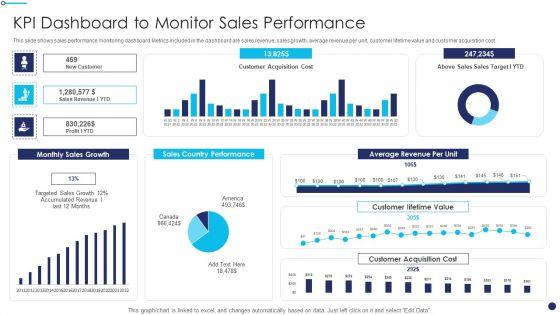
This slide shows sales performance monitoring dashboard. Metrics included in the dashboard are sales revenue, sales growth, average revenue per unit, customer lifetime value and customer acquisition cost.Deliver an awe inspiring pitch with this creative Effective Sales Technique For New Product Launch KPI Dashboard To Monitor Sales Performance Graphics PDF bundle. Topics like Country Performance, Average Revenue, Customer Acquisition can be discussed with this completely editable template. It is available for immediate download depending on the needs and requirements of the user.
Slide 1 of 2
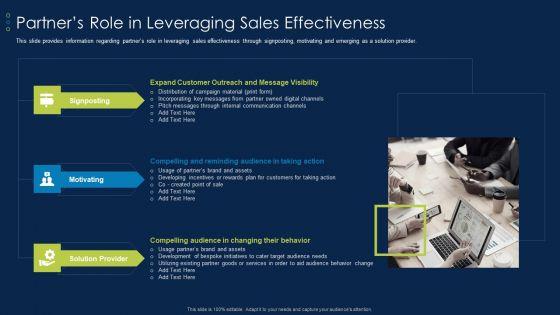
This slide provides information regarding partners role in leveraging sales effectiveness through signposting, motivating and emerging as a solution provider. This is a Business To Business Account Partners Role In Leveraging Sales Effectiveness Graphics PDF template with various stages. Focus and dispense information on three stages using this creative set, that comes with editable features. It contains large content boxes to add your information on topics like Signposting, Motivating, Solution Provider. You can also showcase facts, figures, and other relevant content using this PPT layout. Grab it now.
Slide 1 of 2
Showcasing this set of slides titled targeting customer to increase company sales icon graphics pdf. The topics addressed in these templates are targeting customer to increase company sales icon. All the content presented in this PPT design is completely editable. Download it and make adjustments in color, background, font etc. as per your unique business setting.
Slide 1 of 2
Presenting product marketing icon for increasing organizational sales graphics pdf to dispense important information. This template comprises four stages. It also presents valuable insights into the topics including product marketing icon for increasing organizational sales. This is a completely customizable PowerPoint theme that can be put to use immediately. So, download it and address the topic impactfully.

Slide 1 of 2
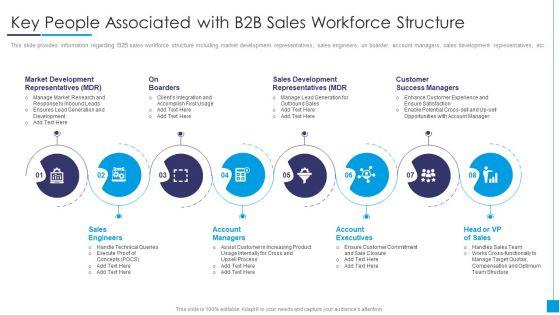
This slide provides information regarding B2B sales workforce structure including market development representatives, sales engineers, on boarder, account managers, sales development representatives, etc. Presenting b2b marketing content administration playbook key people associated with b2b sales graphics pdf to provide visual cues and insights. Share and navigate important information on eight stages that need your due attention. This template can be used to pitch topics like sales development representatives, customer success managers, account managers In addtion, this PPT design contains high resolution images, graphics, etc, that are easily editable and available for immediate download.

Slide 1 of 2
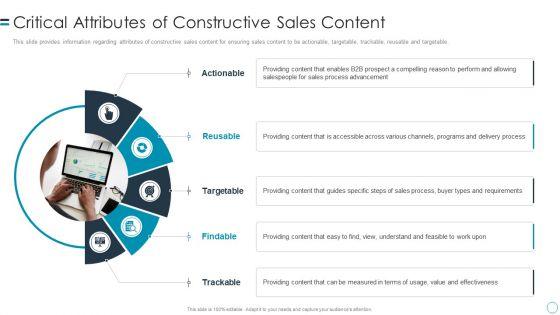
This slide provides information regarding attributes of constructive sales content for ensuring sales content to be actionable, targetable, trackable, reusable and targetable. Presenting b2b customers journey playbook critical attributes of constructive sales content graphics pdf to provide visual cues and insights. Share and navigate important information on five stages that need your due attention. This template can be used to pitch topics like actionable, reusable, targetable, findable, trackable. In addtion, this PPT design contains high resolution images, graphics, etc, that are easily editable and available for immediate download.
Slide 1 of 2
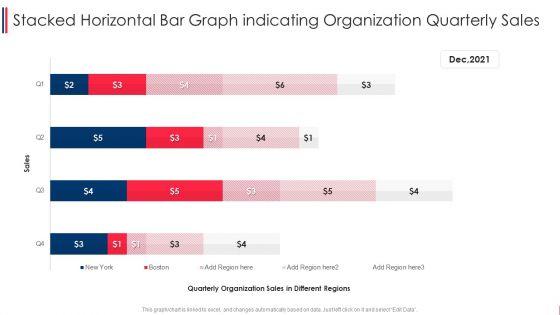
Pitch your topic with ease and precision using this stacked horizontal bar graph indicating organization quarterly sales graphics pdf. This layout presents information on stacked horizontal bar graph indicating organization quarterly sales. It is also available for immediate download and adjustment. So, changes can be made in the color, design, graphics or any other component to create a unique layout.


Slide 1 of 2
This is a agenda of key practices to create sales playbook graphics pdf template with various stages. Focus and dispense information on four stages using this creative set, that comes with editable features. It contains large content boxes to add your information on topics like agenda You can also showcase facts, figures, and other relevant content using this PPT layout. Grab it now.


Slide 1 of 2
This is a detailed guide consumer journey marketing map out the sales process graphics pdf template with various stages. Focus and dispense information on four stages using this creative set, that comes with editable features. It contains large content boxes to add your information on topics like activities, process owner, activities lead, activities support. You can also showcase facts, figures, and other relevant content using this PPT layout. Grab it now.
Slide 1 of 2
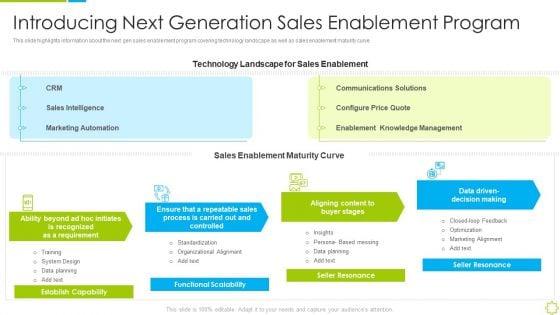
This slide highlights information about the next gen sales enablement program covering technology landscape as well as sales enablement maturity curve. This is a launch new sales enablement program lead generation introducing next generation sales graphics pdf template with various stages. Focus and dispense information on four stages using this creative set, that comes with editable features. It contains large content boxes to add your information on topics like technology, sales enablement, communications, management. You can also showcase facts, figures, and other relevant content using this PPT layout. Grab it now.

Slide 1 of 2
Showcasing this set of slides titled proportion circle slide for increase sales performance graphics pdf. The topics addressed in these templates are proportion circle slide for increase sales performance. All the content presented in this PPT design is completely editable. Download it and make adjustments in color, background, font etc. as per your unique business setting.

Slide 1 of 2
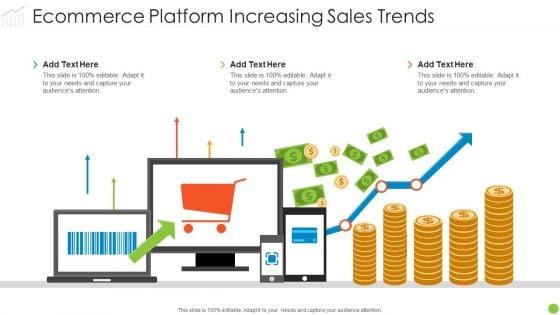
Persuade your audience using this ecommerce platform increasing sales trends graphics pdf. This PPT design covers one stages, thus making it a great tool to use. It also caters to a variety of topics including ecommerce platform increasing sales trends. Download this PPT design now to present a convincing pitch that not only emphasizes the topic but also showcases your presentation skills.

Slide 1 of 2
Presenting tree root cause evaluation for sales decline graphics pdf to dispense important information. This template comprises two stages. It also presents valuable insights into the topics including tree root cause evaluation for sales decline. This is a completely customizable PowerPoint theme that can be put to use immediately. So, download it and address the topic impactfully.


Slide 1 of 2
This slide outlines the strategic sales plan that organisation can use to increase their market share and profitability. It includes following steps setting milestone, target customer profiles, SWOT analysis, marketing strategy, revenue targets, positioning and taking action. Presenting seven step strategic sales strategy graphics pdf to dispense important information. This template comprises seven stages. It also presents valuable insights into the topics including setting up milestone, revenue targets, target customer profiles, swot analysis, positioning statement. This is a completely customizable PowerPoint theme that can be put to use immediately. So, download it and address the topic impactfully.

Slide 1 of 2
Developing New Product Messaging Canvas Determining Its USP Forecasting The Sales Price Graphics PDF
The following slide displays the sales data for the future as it displays a tabular representation of the historical and the forecasted data of the next four quarters Deliver and pitch your topic in the best possible manner with this developing new product messaging canvas determining its usp forecasting the sales price graphics pdf. Use them to share invaluable insights on forecasting the sales and impress your audience. This template can be altered and modified as per your expectations. So, grab it now.
Slide 1 of 2
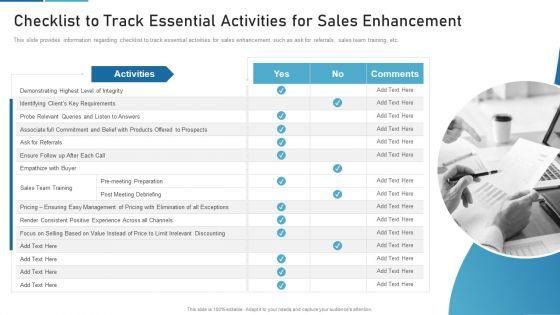
This slide provides information regarding checklist to track essential activities for sales enhancement such as ask for referrals, sales team training, etc. This is a sales process catalogue template checklist to track essential activities for sales enhancement graphics pdf template with various stages. Focus and dispense information on one stages using this creative set, that comes with editable features. It contains large content boxes to add your information on topics like pricing, management, pricing, integrity. You can also showcase facts, figures, and other relevant content using this PPT layout. Grab it now.

Slide 1 of 2
Deliver an awe inspiring pitch with this creative business management company sales graph ppt inspiration model pdf bundle. Topics like company sales graph can be discussed with this completely editable template. It is available for immediate download depending on the needs and requirements of the user.
Slide 1 of 2
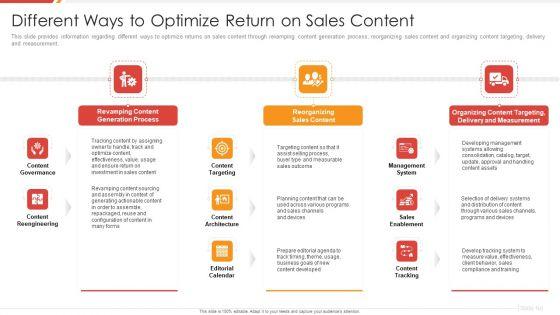
This slide provides information regarding different ways to optimize returns on sales content through revamping content generation process, reorganizing sales content and organizing content targeting, delivery and measurement. This is a enhancing b2b demand creation and sales growth different ways to optimize return on sales graphics pdf template with various stages. Focus and dispense information on three stages using this creative set, that comes with editable features. It contains large content boxes to add your information on topics like revamping content generation process, reorganizing sales content, organizing content targeting, delivery and measurement. You can also showcase facts, figures, and other relevant content using this PPT layout. Grab it now.
Slide 1 of 2
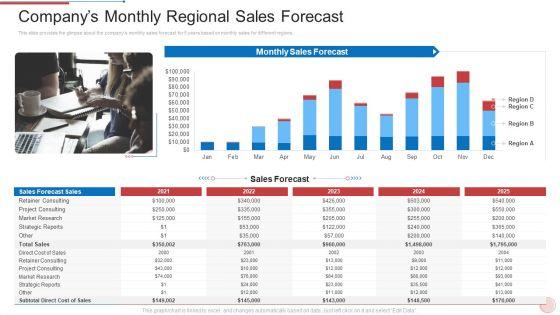
This slide provides the glimpse about the companys monthly sales forecast for 5 years based on monthly sales for different regions. Deliver and pitch your topic in the best possible manner with this regional marketing strategies companys monthly regional sales forecast graphics pdf. Use them to share invaluable insights on strategic, sales, cost and impress your audience. This template can be altered and modified as per your expectations. So, grab it now.
Slide 1 of 2
Presenting b2b sales plan graphics of crm sales funnel management ppt powerpoint presentation model icons pdf to dispense important information. This template comprises five stages. It also presents valuable insights into the topics including b2b sales plan graphics of crm sales funnel management. This is a completely customizable PowerPoint theme that can be put to use immediately. So, download it and address the topic impactfully.
Slide 1 of 2
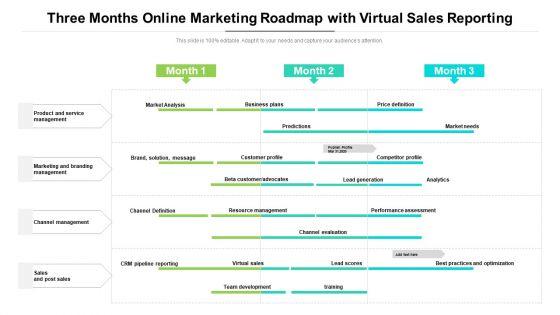
Presenting the three months online marketing roadmap with virtual sales reporting graphics. The template includes a roadmap that can be used to initiate a strategic plan. Not only this, the PowerPoint slideshow is completely editable and you can effortlessly modify the font size, font type, and shapes according to your needs. This PPT slide can be easily reached in standard screen and widescreen aspect ratios. The set is also available in various formats like PDF, PNG, and JPG. So download and use it multiple times as per your knowledge.

Slide 1 of 2
Showcasing this set of slides titled business historical and forecasted sales graphs ppt powerpoint presentation ideas themes pdf. The topics addressed in these templates are business historical and forecasted sales graphs. All the content presented in this PPT design is completely editable. Download it and make adjustments in color, background, font etc. as per your unique business setting.

Slide 1 of 2
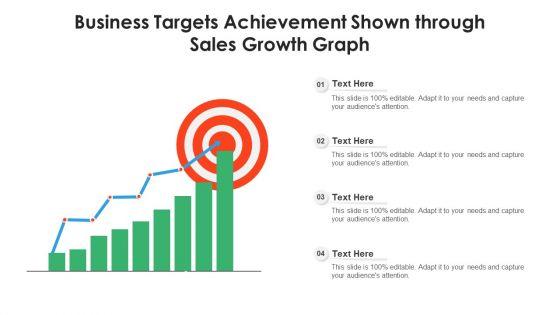
Pitch your topic with ease and precision using this business targets achievement shown through sales growth graph ppt powerpoint presentation gallery elements pdf. This layout presents information on business targets achievement shown through sales growth graph. It is also available for immediate download and adjustment. So, changes can be made in the color, design, graphics or any other component to create a unique layout.

Slide 1 of 2
Deliver an awe inspiring pitch with this creative company sales graph business analysis method ppt professional visuals pdf bundle. Topics like market value, sales can be discussed with this completely editable template. It is available for immediate download depending on the needs and requirements of the user.

Slide 1 of 2
This slide shows the dashboard related to smartphone market overview, revenue and sales of the company with top smartphones with their details.Deliver an awe inspiring pitch with this creative smartphone sales dashboard graphics pdf bundle. Topics like smartphone sales dashboard can be discussed with this completely editable template. It is available for immediate download depending on the needs and requirements of the user.


Slide 1 of 2
The purpose of this slide is to provide the information regarding the sales performance across various geographical regions in various financial years and the forecasted sales. Deliver an awe-inspiring pitch with this creative sales assistance boost overall efficiency projected sales performance graphics pdf bundle. Topics like projected sales performance can be discussed with this completely editable template. It is available for immediate download depending on the needs and requirements of the user.
Slide 1 of 2
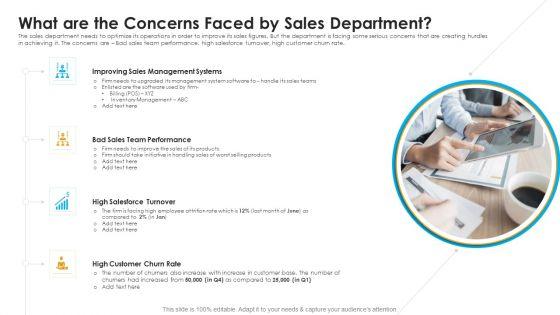
The sales department needs to optimize its operations in order to improve its sales figures. But the department is facing some serious concerns that are creating hurdles in achieving it. The concerns are Bad sales team performance, high salesforce turnover, high customer churn rate. Presenting sales assistance boost overall efficiency what are the concerns faced by sales department graphics pdf to provide visual cues and insights. Share and navigate important information on four stages that need your due attention. This template can be used to pitch topics like sales management systems, sales team performance, high customer churn rate. In addition, this PPT design contains high-resolution images, graphics, etc, that are easily editable and available for immediate download.
SHOW
- 60
- 120
- 180
DISPLAYING: 60 of 142 Item(s)
Page
