 AI PPT Maker
 Templates
 PPT Bundles
 Design Services
 Business PPTs
 Business Plan
 Management
 Strategy
 Introduction PPT
 Roadmap
 Self Introduction
 Timelines
 Process
 Marketing
 Agenda
 Technology
 Medical
 Startup Business Plan
 Cyber Security
 Dashboards
 SWOT
SWOT Proposals
 Education
 Pitch Deck
 Digital Marketing
 KPIs
KPIs Project Management
 Product Management
 Artificial Intelligence
 Target Market
 Communication
 Supply Chain
 Google Slides
 Research Services
 One Pagers
 All Categories
Sales performance kpi PowerPoint Presentation Templates and Google Slides
SHOW
- 60
- 120
- 180
DISPLAYING: 60 of 295 Item(s)
Page


Share a great deal of information on the topic by deploying this performance kpis organization sales ppt powerpoint presentation complete deck. Support your ideas and thought process with this prefabricated set. It includes a set of twelve slides, all fully modifiable and editable. Each slide can be restructured and induced with the information and content of your choice. You can add or remove large content boxes as well, to make this PPT slideshow more personalized. Its high-quality graphics and visuals help in presenting a well-coordinated pitch. This PPT template is also a resourceful tool to take visual cues from and implement the best ideas to help your business grow and expand. The main attraction of this well-formulated deck is that everything is editable, giving you the freedom to adjust it to your liking and choice. Changes can be made in the background and theme as well to deliver an outstanding pitch. Therefore, click on the download button now to gain full access to this multifunctional set.


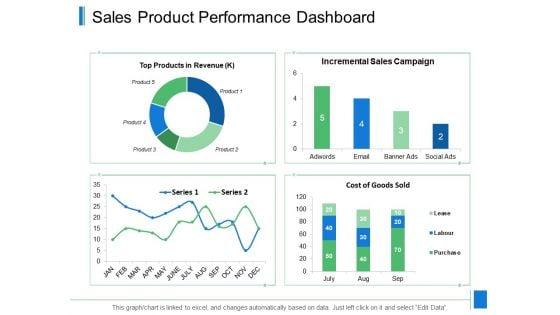
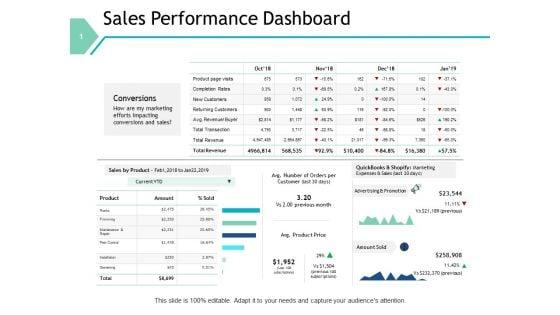
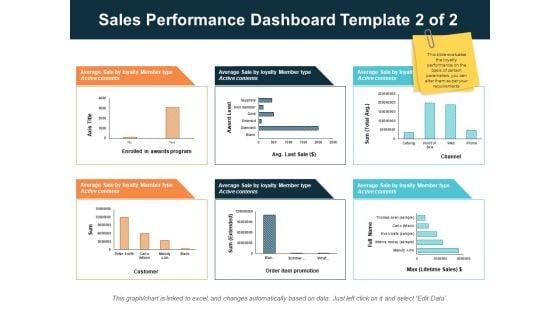
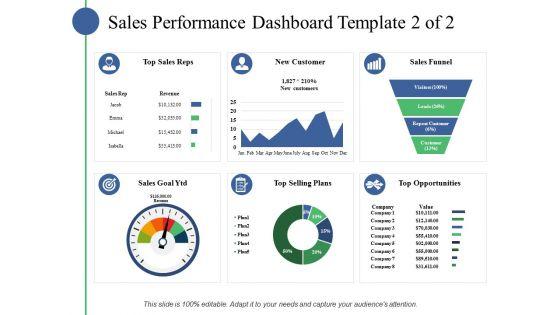
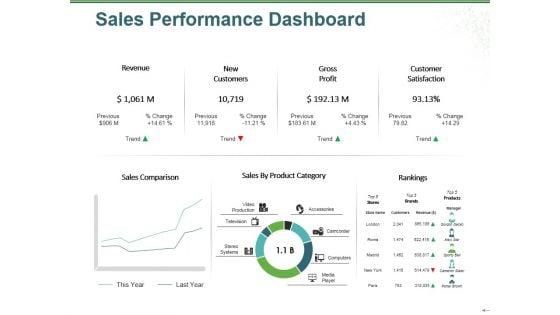
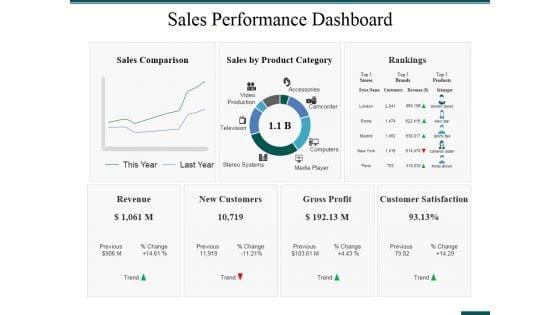
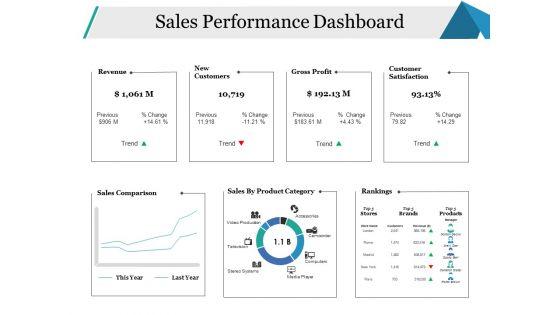
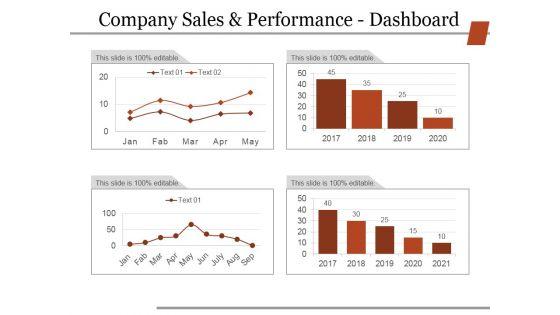
Presenting this set of slides with name sales product performance dashboard ppt powerpoint presentation styles files. The topics discussed in these slides are finance, marketing, management, investment, analysis. This is a completely editable PowerPoint presentation and is available for immediate download. Download now and impress your audience.
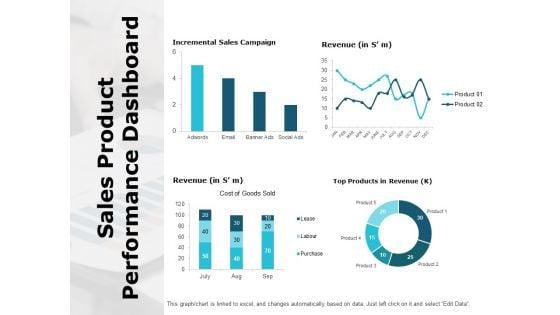


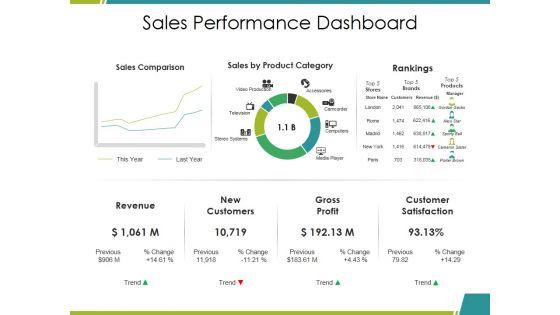
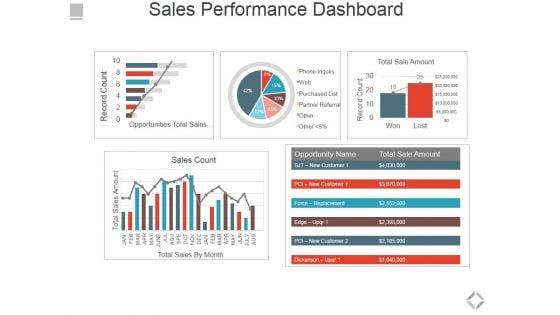
Presenting this set of slides with name sales product performance dashboard ppt powerpoint presentation pictures deck. The topics discussed in these slides are finance, marketing, management, investment, analysis. This is a completely editable PowerPoint presentation and is available for immediate download. Download now and impress your audience.


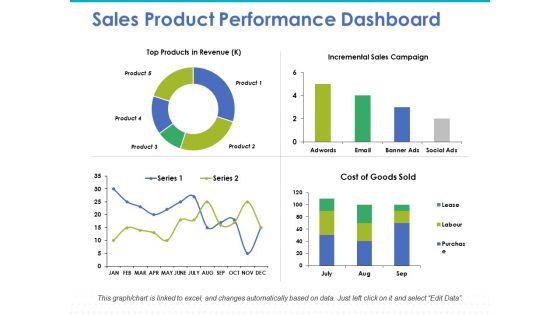
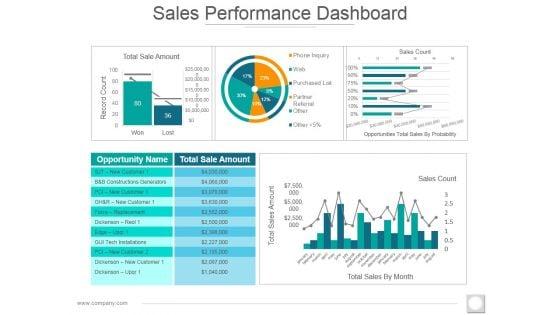
Presenting this set of slides with name sales product performance dashboard ppt powerpoint presentation infographic template format ideas. The topics discussed in these slides are marketing, business, management, planning, strategy. This is a completely editable PowerPoint presentation and is available for immediate download. Download now and impress your audience.
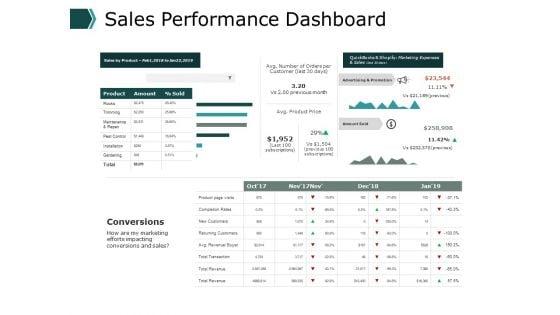


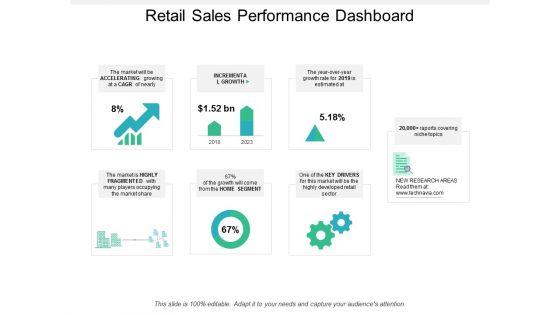


Presenting this set of slides with name retail sales performance dashboard ppt powerpoint presentation summary portfolio. The topics discussed in these slides are retail, business strategies, sales strategy. This is a completely editable PowerPoint presentation and is available for immediate download. Download now and impress your audience.
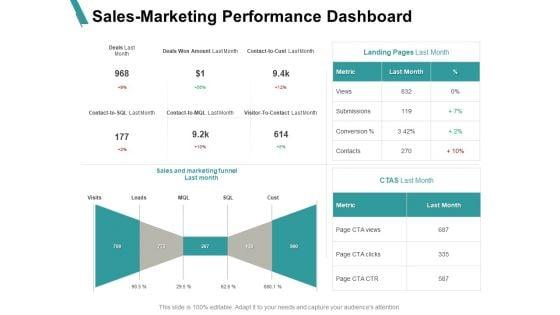


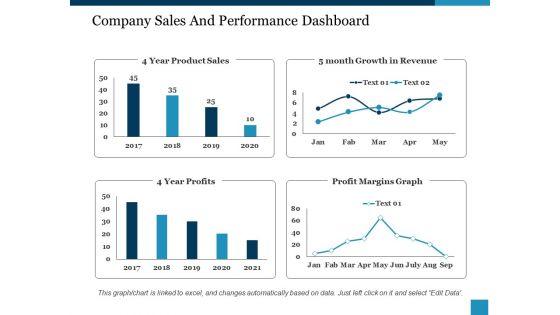
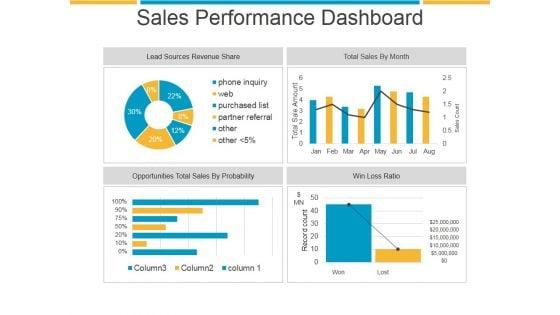
Presenting this set of slides with name sales marketing performance dashboard financial ppt powerpoint presentation styles backgrounds. The topics discussed in these slides are marketing, business, management, planning, strategy. This is a completely editable PowerPoint presentation and is available for immediate download. Download now and impress your audience.


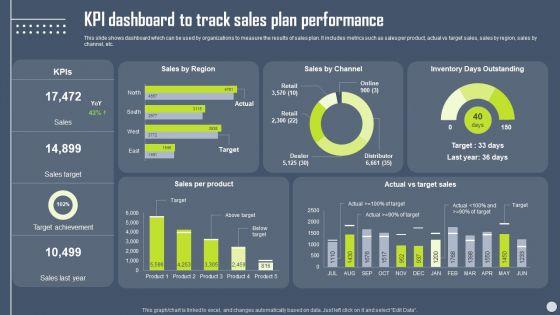
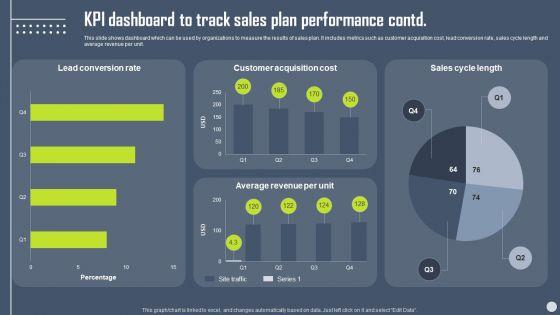

This slide shows dashboard which can be used by organizations to measure the results of sales plan. It includes metrics such as sales per product, actual vs target sales, sales by region, sales by channel, etc. Boost your pitch with our creative Boosting Yearly Business Revenue KPI Dashboard To Track Sales Plan Performance Topics PDF. Deliver an awe-inspiring pitch that will mesmerize everyone. Using these presentation templates you will surely catch everyones attention. You can browse the ppts collection on our website. We have researchers who are experts at creating the right content for the templates. So you dont have to invest time in any additional work. Just grab the template now and use them.
This slide represents metric dashboard to track sales performance on e-commerce website. It cover performance indicators such as sales breakdown, order breakdown, recurring sales etc. Make sure to capture your audiences attention in your business displays with our gratis customizable Strategies For Successful Customer Base Development In B2b M Commerce B2b Sales Performance Tracking Dashboard Demonstration PDF. These are great for business strategies, office conferences, capital raising or task suggestions. If you desire to acquire more customers for your tech business and ensure they stay satisfied, create your own sales presentation with these plain slides.


The following slide highlights sales order fulfilment dashboard for real-time customer analytics, performance and inventory management and sales forecasting etc. It includes components such as number of orders work in progress, value of sales orders, no. of orders shipped, sales order status, customer sales orders etc. Showcasing this set of slides titled Sales Order Processing Dashboard To Track Performance Information PDF. The topics addressed in these templates are Sales Order Status, Customer Sales Order, Work Progress. All the content presented in this PPT design is completely editable. Download it and make adjustments in color, background, font etc. as per your unique business setting.


This slide showcases KPI dashboard which can help sales team managers display and review performance rankings. It provides details about weekly sales score, target percentage, total target, sales team members, etc. Unleash your creativity with our How Leaders Can Improve Team Effectiveness Sales Team Performance Management KPI Dashboard Infographics PDF single-slide PPT template. Whether you are a seasoned presenter or a newbie, our editable and visually-stunning template will make your presentations shine. This template is versatile and easy to use. Make your presentations unforgettable with our premium template and leave a lasting impression on your audience.
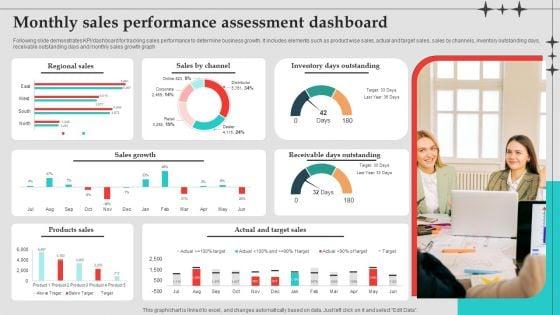

Following slide demonstrates KPI or dashboard for tracking sales performance to determine business growth. It includes elements such as product wise sales, actual and target sales, sales by channels, inventory outstanding days, receivable outstanding days and monthly sales growth graph. Showcasing this set of slides titled Monthly Sales Performance Assessment Dashboard Download PDF. The topics addressed in these templates are Sales Growth, Inventory Days Outstanding, Target Sales. All the content presented in this PPT design is completely editable. Download it and make adjustments in color, background, font etc. as per your unique business setting.

This slide showcases dashboard that can help organization to track the performance of sales employees and conduct training in case of any discrepancy in achievement of marketing goals. Its key elements are weekly sales, team sales, leaderboard this year etc. Boost your pitch with our creative Dashboard To Track Performance Of Field Marketing Sales Employees Topics PDF. Deliver an awe inspiring pitch that will mesmerize everyone. Using these presentation templates you will surely catch everyones attention. You can browse the ppts collection on our website. We have researchers who are experts at creating the right content for the templates. So you do not have to invest time in any additional work. Just grab the template now and use them.


Following slide demonstrates KPI dashboard to evaluate business sales performance by different countries to determine future growth opportunities. It includes key components such as actual v or s targeted sales, quarterly sales, location bases sales, annual sales achieved and region based sales shortfalls. Showcasing this set of slides titled Sales Employee Representative Performance Scorecard Dashboard By Different Countries Themes PDF. The topics addressed in these templates are Countries Wise Actual Sales, V Or S Targeted Sales, Annual Sales Achieved, Quarterly Sales Performance, Sales By Geographical Location. All the content presented in this PPT design is completely editable. Download it and make adjustments in color, background, font etc. as per your unique business setting.
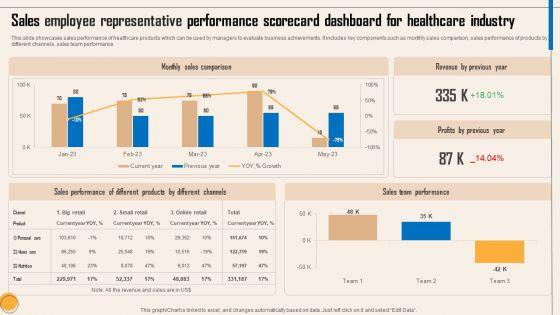
This slide showcases sales performance of healthcare products which can be used by managers to evaluate business achievements. It includes key components such as monthly sales comparison, sales performance of products by different channels, sales team performance. Pitch your topic with ease and precision using this Sales Employee Representative Performance Scorecard Dashboard For Healthcare Industry Clipart PDF. This layout presents information on Monthly Sales Comparison, Revenue By Previous Year, Sales Performance, Different Products, Different Channels, Sales Team Performance . It is also available for immediate download and adjustment. So, changes can be made in the color, design, graphics or any other component to create a unique layout.
This slide provides information regarding product branding performance tracking dashboard in terms of revenues, new customers, customer satisfaction rate. Make sure to capture your audiences attention in your business displays with our gratis customizable Product Branding To Enhance Product Sales Performance Tracking Dashboard Infographics PDF. These are great for business strategies, office conferences, capital raising or task suggestions. If you desire to acquire more customers for your tech business and ensure they stay satisfied, create your own sales presentation with these plain slides.
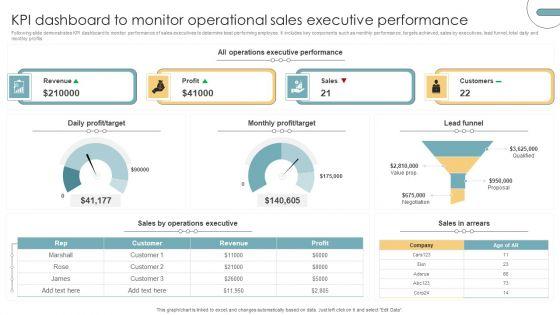
Following slide demonstrates KPI dashboard to monitor performance of sales executives to determine best performing employee. It includes key components such as monthly performance, targets achieved, sales by executives, lead funnel, total daily and monthly profits. Pitch your topic with ease and precision using this KPI Dashboard To Monitor Operational Sales Executive Performance Portrait PDF. This layout presents information on Revenue, Profit, Sales, Customers. It is also available for immediate download and adjustment. So, changes can be made in the color, design, graphics or any other component to create a unique layout.
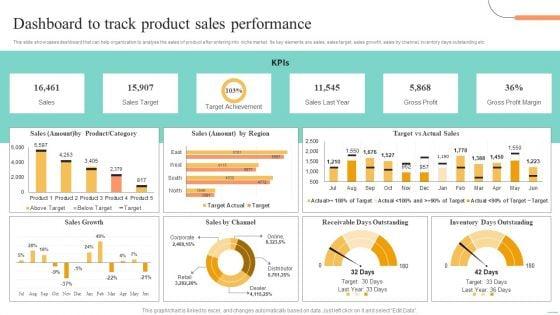
This slide showcases dashboard that can help organization to analyse the sales of product after entering into niche market. Its key elements are sales, sales target, sales growth, sales by channel, inventory days outstanding etc. Presenting this PowerPoint presentation, titled Price Leadership Technique Dashboard To Track Product Sales Performance Professional PDF, with topics curated by our researchers after extensive research. This editable presentation is available for immediate download and provides attractive features when used. Download now and captivate your audience. Presenting this Price Leadership Technique Dashboard To Track Product Sales Performance Professional PDF. Our researchers have carefully researched and created these slides with all aspects taken into consideration. This is a completely customizable Price Leadership Technique Dashboard To Track Product Sales Performance Professional PDF that is available for immediate downloading. Download now and make an impact on your audience. Highlight the attractive features available with our PPTs.
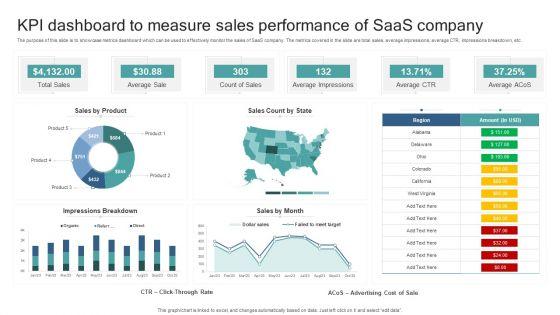
The purpose of this slide is to showcase metrics dashboard which can be used to effectively monitor the sales of SaaS company. The metrics covered in the slide are total sales, average impressions, average CTR, impressions breakdown, etc. Showcasing this set of slides titled KPI Dashboard To Measure Sales Performance Of Saas Company Summary PDF. The topics addressed in these templates are Total Sales, Average Sale, Count Of Sales, Average Impressions, Average Ctr. All the content presented in this PPT design is completely editable. Download it and make adjustments in color, background, font etc. as per your unique business setting.
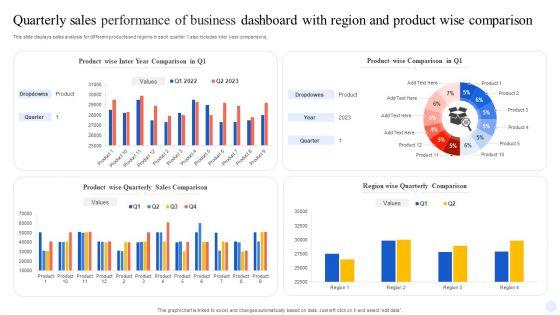

This slide displays sales analysis for different products and regions in each quarter. t also includes inter year comparisons. Pitch your topic with ease and precision using this Quarterly Sales Performance Of Business Dashboard With Region And Product Wise Comparison Guidelines PDF. This layout presents information on Product Wise Quarterly Sales, Comparison. It is also available for immediate download and adjustment. So, changes can be made in the color, design, graphics or any other component to create a unique layout.
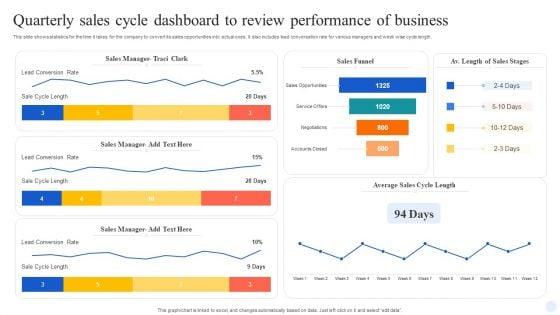

This slide shows statistics for the time it takes for the company to convert its sales opportunities into actual ones. It also includes lead conversation rate for various managers and week wise cycle length. Showcasing this set of slides titled Quarterly Sales Cycle Dashboard To Review Performance Of Business Demonstration PDF. The topics addressed in these templates are Sales Manager, Sales Funnel, Lead Conversion Rate. All the content presented in this PPT design is completely editable. Download it and make adjustments in color, background, font etc. as per your unique business setting.
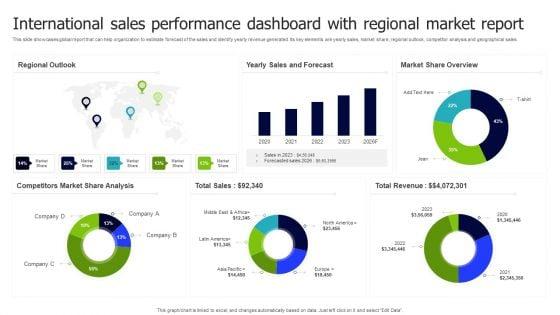

This slide showcases global report that can help organization to estimate forecast of the sales and identify yearly revenue generated. Its key elements are yearly sales, market share, regional outlook, competitor analysis and geographical sales. Pitch your topic with ease and precision using this International Sales Performance Dashboard With Regional Market Report Inspiration PDF. This layout presents information on Regional Outlook, Sales And Forecast, Market Share Overview. It is also available for immediate download and adjustment. So, changes can be made in the color, design, graphics or any other component to create a unique layout.
This slide showcases dashboard for sales performance that can help organization to analyze the effectiveness of sales campaigns and average response time of lead. Its key components are average contract value, average sales cycle length, follow up contract rate and sales activity. Showcasing this set of slides titled Sales Performance Dashboard With Average Lead Tracking Time Background PDF. The topics addressed in these templates are Avg Contract Value, Sales Activity, Contract Rate. All the content presented in this PPT design is completely editable. Download it and make adjustments in color, background, font etc. as per your unique business setting.

This slide covers the dashboard that depicts metrics to track company sales performance that focuses on number of sales, cost breakdown, accumulated revenues, incremental sales, etc. From laying roadmaps to briefing everything in detail, our templates are perfect for you. You can set the stage with your presentation slides. All you have to do is download these easy-to-edit and customizable templates. Change Management Process Dashboard Depicting Kpis To Track Sales Performance Introduction PDF will help you deliver an outstanding performance that everyone would remember and praise you for. Do download this presentation today.
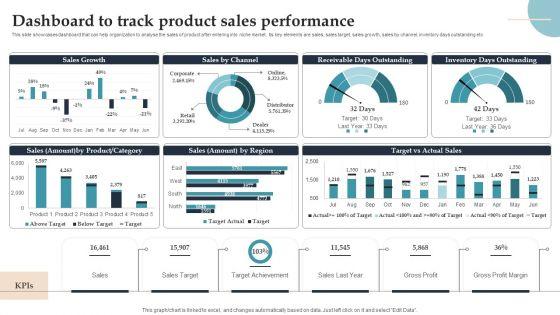

This slide showcases dashboard that can help organization to analyse the sales of product after entering into niche market. Its key elements are sales, sales target, sales growth, sales by channel, inventory days outstanding etc. Are you in need of a template that can accommodate all of your creative concepts This one is crafted professionally and can be altered to fit any style. Use it with Google Slides or PowerPoint. Include striking photographs, symbols, depictions, and other visuals. Fill, move around, or remove text boxes as desired. Test out color palettes and font mixtures. Edit and save your work, or work with colleagues. Download Product Rollout Techniques Dashboard To Track Product Sales Performance Infographics PDF and observe how to make your presentation outstanding. Give an impeccable presentation to your group and make your presentation unforgettable.
SHOW
- 60
- 120
- 180
DISPLAYING: 60 of 295 Item(s)
Page