AI PPT Maker
Templates
PPT Bundles
Design Services
Business PPTs
Business Plan
Management
Strategy
Introduction PPT
Roadmap
Self Introduction
Timelines
Process
Marketing
Agenda
Technology
Medical
Startup Business Plan
Cyber Security
Dashboards
SWOT
Proposals
Education
Pitch Deck
Digital Marketing
KPIs
Project Management
Product Management
Artificial Intelligence
Target Market
Communication
Supply Chain
Google Slides
Research Services
 One Pagers
All Categories
Sales-analytics PowerPoint Presentation Templates and Google Slides
15 Item(s)


Slide 1 of 7
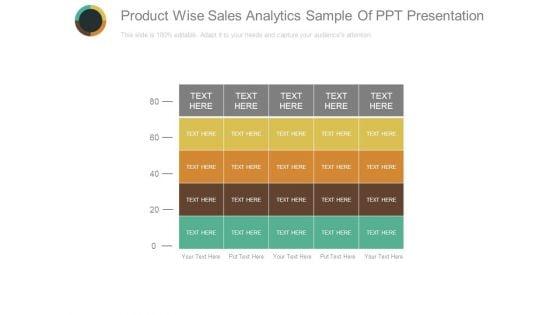
This is a product wise sales analytics sample of ppt presentation. This is a five stage process. The stages in this process are sales, presentation, management, business, marketing.
Slide 1 of 7
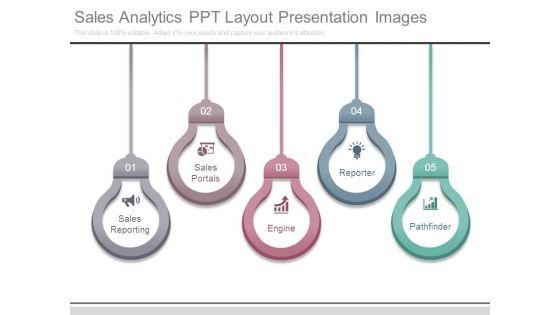
This is a sales analytics ppt layout presentation images. This is a five stage process. The stages in this process are sales reporting, sales portals, engine, reporter, pathfinder.


Slide 1 of 7
This is a sales analytics business template ppt design. This is a six stage process. The stages in this process are identify customer, create brand identify, develop pricing strategy, relate to customers, case management, assurance.
Slide 1 of 6
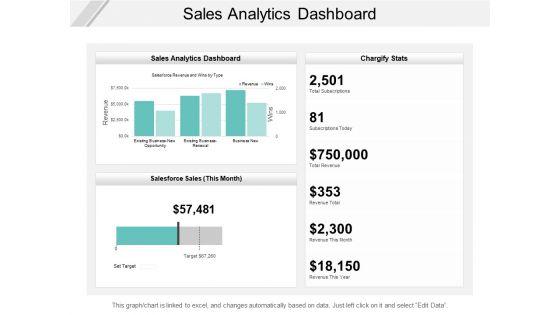
Presenting this set of slides with name sales analytics dashboard ppt powerpoint presentation outline diagrams. The topics discussed in these slides are buzz marketing, process, strategy. This is a completely editable PowerPoint presentation and is available for immediate download. Download now and impress your audience.


Slide 1 of 5
Presenting this set of slides with name sales analytics resources ppt powerpoint presentation gallery visuals cpb. This is an editable Powerpoint four stages graphic that deals with topics like sales analytics resources to help convey your message better graphically. This product is a premium product available for immediate download and is 100 percent editable in Powerpoint. Download this now and use it in your presentations to impress your audience.
Slide 1 of 5
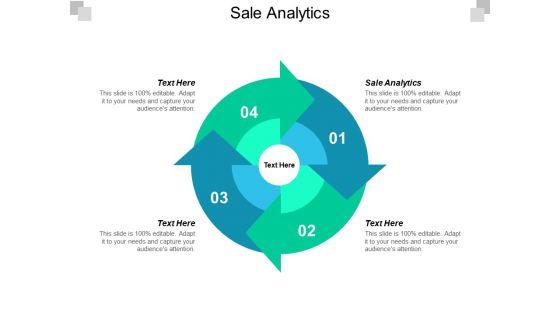
This is a sale analytics ppt powerpoint presentation ideas portrait cpb. This is a four stage process. The stages in this process are sale analytics.



Slide 1 of 5
This is a online business sales growth analytics vector ppt powerpoint presentation outline aids. This is a four stage process. The stages in this process are ecommerce, mercantilism, commercialism.
Slide 1 of 2
Presenting sales analytics for forecasting and planning icon ppt powerpoint presentation show pdf to dispense important information. This template comprises three stages. It also presents valuable insights into the topics including sales analytics for forecasting and planning icon. This is a completely customizable PowerPoint theme that can be put to use immediately. So, download it and address the topic impactfully.
Slide 1 of 2
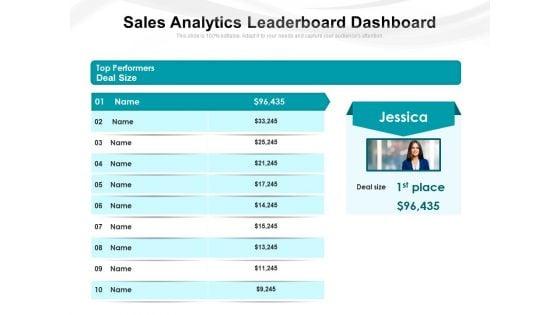
Sales Analytics Leaderboard Dashboard Ppt PowerPoint Presentation Infographic Template Templates PDF
Presenting this set of slides with name sales analytics leaderboard dashboard ppt powerpoint presentation infographic template templates pdf. The topics discussed in these slides are top performers, deal size, sales analytics, leaderboard dashboard. This is a completely editable PowerPoint presentation and is available for immediate download. Download now and impress your audience.
Slide 1 of 2
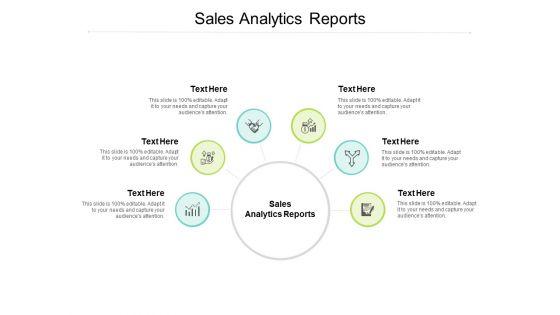
Presenting this set of slides with name sales analytics reports ppt powerpoint presentation gallery cpb. This is an editable Powerpoint six stages graphic that deals with topics like sales analytics reports to help convey your message better graphically. This product is a premium product available for immediate download and is 100 percent editable in Powerpoint. Download this now and use it in your presentations to impress your audience.


Slide 1 of 10
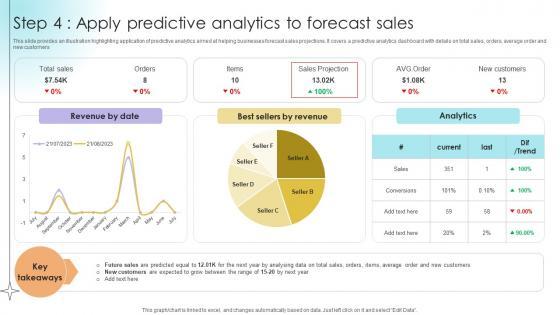
This slide provides an illustration highlighting application of predictive analytics aimed at helping businesses forecast sales projections. It covers a predictive analytics dashboard with details on total sales, orders, average order and new customers.Coming up with a presentation necessitates that the majority of the effort goes into the content and the message you intend to convey. The visuals of a PowerPoint presentation can only be effective if it supplements and supports the story that is being told. Keeping this in mind our experts created Step 4 Apply Predictive Analytics To Forecast Sales Data Analytics SS V to reduce the time that goes into designing the presentation. This way, you can concentrate on the message while our designers take care of providing you with the right template for the situation. This slide provides an illustration highlighting application of predictive analytics aimed at helping businesses forecast sales projections. It covers a predictive analytics dashboard with details on total sales, orders, average order and new customers.


Slide 1 of 10
This slide illustrates a KPI dashboard highlighting application of prescriptive analytics to analyze website visits and sales. It covers KPIs such as monthly visitors, monthly sales, cash deposits, increase in subscribers and orders received.This modern and well-arranged Prescriptive Analytics Dashboard To Track Website Sales Data Analytics SS V provides lots of creative possibilities. It is very simple to customize and edit with the Powerpoint Software. Just drag and drop your pictures into the shapes. All facets of this template can be edited with Powerpoint, no extra software is necessary. Add your own material, put your images in the places assigned for them, adjust the colors, and then you can show your slides to the world, with an animated slide included. This slide illustrates a KPI dashboard highlighting application of prescriptive analytics to analyze website visits and sales. It covers KPIs such as monthly visitors, monthly sales, cash deposits, increase in subscribers and orders received.


Slide 1 of 9
This slide showcases the steps followed to improve sales analytics which are identifying trends, setting goals, monitoring metrics, improving strategies, providing trainings and adjusting marketing strategy. This Building Stronger Customer Procedure To Optimize Sales Analytics For Improving Sales SA SS V from Slidegeeks makes it easy to present information on your topic with precision. It provides customization options, so you can make changes to the colors, design, graphics, or any other component to create a unique layout. It is also available for immediate download, so you can begin using it right away. Slidegeeks has done good research to ensure that you have everything you need to make your presentation stand out. Make a name out there for a brilliant performance. This slide showcases the steps followed to improve sales analytics which are identifying trends, setting goals, monitoring metrics, improving strategies, providing trainings and adjusting marketing strategy.


Slide 1 of 9
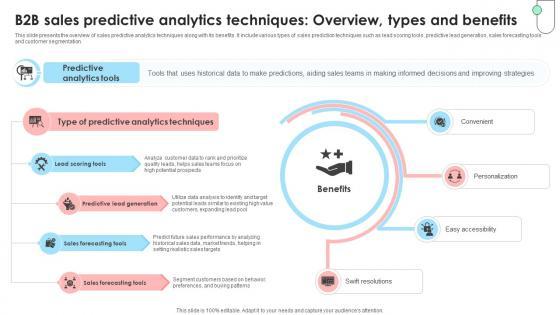
This slide presents the overview of sales predictive analytics techniques along with its benefits. It include various types of sales prediction techniques such as lead scoring tools, predictive lead generation, sales forecasting tools and customer segmentation. Whether you have daily or monthly meetings, a brilliant presentation is necessary. Navigating B2B Sales B2B Sales Predictive Analytics Techniques Overview SA SS V can be your best option for delivering a presentation. Represent everything in detail using Navigating B2B Sales B2B Sales Predictive Analytics Techniques Overview SA SS V and make yourself stand out in meetings. The template is versatile and follows a structure that will cater to your requirements. All the templates prepared by Slidegeeks are easy to download and edit. Our research experts have taken care of the corporate themes as well. So, give it a try and see the results. This slide presents the overview of sales predictive analytics techniques along with its benefits. It include various types of sales prediction techniques such as lead scoring tools, predictive lead generation, sales forecasting tools and customer segmentation.


Slide 1 of 9
This slide showcases the steps followed to improve sales analytics which are identifying trends, setting goals, monitoring metrics, improving strategies, providing trainings and adjusting marketing strategy. This Digital Marketing Strategies Procedure To Optimize Sales Analytics For Improving Sales SA SS V from Slidegeeks makes it easy to present information on your topic with precision. It provides customization options, so you can make changes to the colors, design, graphics, or any other component to create a unique layout. It is also available for immediate download, so you can begin using it right away. Slidegeeks has done good research to ensure that you have everything you need to make your presentation stand out. Make a name out there for a brilliant performance. This slide showcases the steps followed to improve sales analytics which are identifying trends, setting goals, monitoring metrics, improving strategies, providing trainings and adjusting marketing strategy.
15 Item(s)
