AI PPT Maker
Templates
PPT Bundles
Design Services
Business PPTs
Business Plan
Management
Strategy
Introduction PPT
Roadmap
Self Introduction
Timelines
Process
Marketing
Agenda
Technology
Medical
Startup Business Plan
Cyber Security
Dashboards
SWOT
Proposals
Education
Pitch Deck
Digital Marketing
KPIs
Project Management
Product Management
Artificial Intelligence
Target Market
Communication
Supply Chain
Google Slides
Research Services
 One Pagers
All Categories
Statistic department PowerPoint Presentation Templates and Google Slides
9 Item(s)



Slide 1 of 7
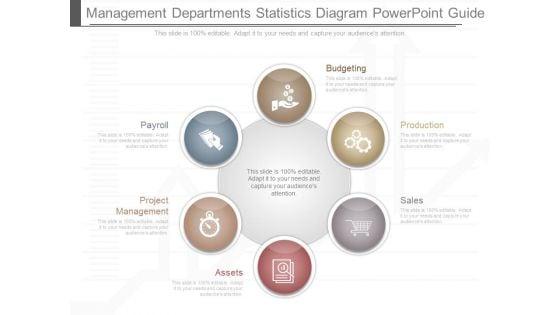
This is a management departments statistics diagram powerpoint guide. This is a six stage process. The stages in this process are budgeting , production, sales , assets, project management, payroll.


Slide 1 of 3
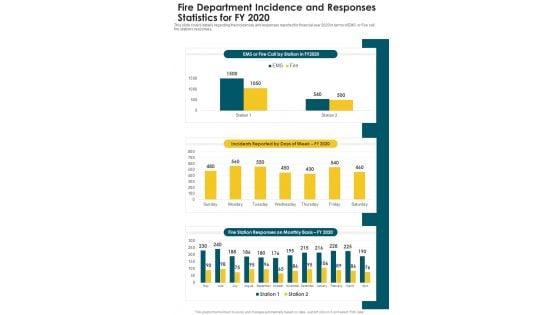
This slide covers details regarding the incidences and responses reported for financial year 2020 in terms of EMS or Fire call, fire stations responses. Presenting you a fantastic Fire Department Incidence And Responses Statistics For FY 2020 One Pager Documents. This piece is crafted on hours of research and professional design efforts to ensure you have the best resource. It is completely editable and its design allow you to rehash its elements to suit your needs. Get this Fire Department Incidence And Responses Statistics For FY 2020 One Pager Documents A4 One-pager now.

Slide 1 of 2
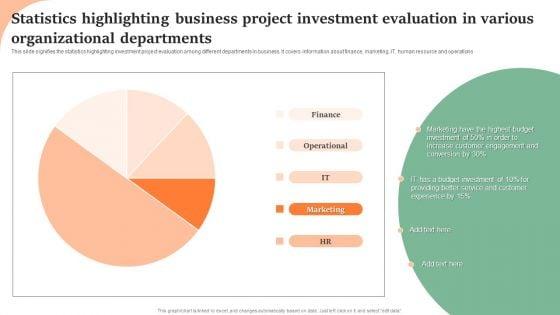
This slide signifies the statistics highlighting investment project evaluation among different departments in business. It covers information about finance, marketing, IT, human resource and operations. Showcasing this set of slides titled Statistics Highlighting Business Project Investment Evaluation In Various Organizational Departments Diagrams PDF. The topics addressed in these templates are Finance, Operational, IT, Marketing, HR. All the content presented in this PPT design is completely editable. Download it and make adjustments in color, background, font etc. as per your unique business setting.
Slide 1 of 2
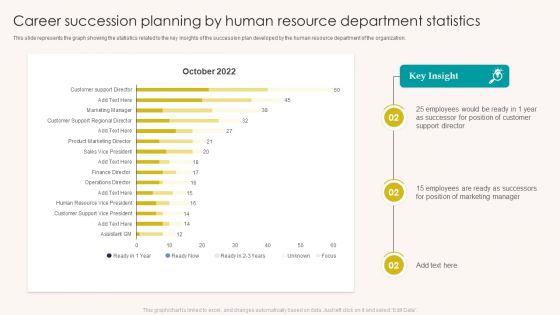
This slide represents the graph showing the statistics related to the key insights of the succession plan developed by the human resource department of the organization. Showcasing this set of slides titled Career Succession Planning By Human Resource Department Statistics Graphics PDF. The topics addressed in these templates are Employees, Customer, Marketing Manager. All the content presented in this PPT design is completely editable. Download it and make adjustments in color, background, font etc. as per your unique business setting.
Slide 1 of 2
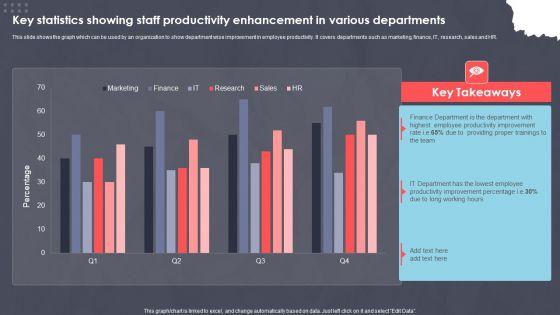
This slide shows the graph which can be used by an organization to show department wise improvement in employee productivity. It covers departments such as marketing, finance, IT, research, sales and HR. Pitch your topic with ease and precision using this Key Statistics Showing Staff Productivity Enhancement In Various Departments Ppt PowerPoint Presentation Slides Portrait PDF. This layout presents information on XXXXXXXXXXXXXXXXXXXXXXXXX. It is also available for immediate download and adjustment. So, changes can be made in the color, design, graphics or any other component to create a unique layout.

Slide 1 of 2
This slide illustrates the staff average age working in different departments. It includes departments such as senior management, manual, admin professional and technical and academic. Showcasing this set of slides titled Staff Average Age Statistics According To Department Demonstration PDF. The topics addressed in these templates are Administration Professional, Management, Employee. All the content presented in this PPT design is completely editable. Download it and make adjustments in color, background, font etc. as per your unique business setting.


Slide 1 of 9
This slide represents the statistical data related to the emerging trends in talent recruitment by the human resources department of the various organizations. Presenting Recruitment Trends Analysis In Human Resource Department Statistical Download PDF to provide visual cues and insights. Share and navigate important information on three stages that need your due attention. This template can be used to pitch topics like Recruiting Investments, Social Media, Recruitment Purposes. In addtion, this PPT design contains high resolution images, graphics, etc, that are easily editable and available for immediate download.


Slide 1 of 9
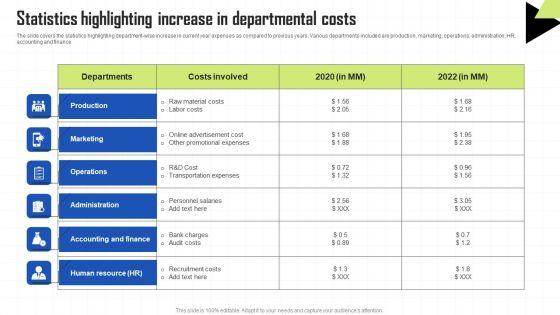
The slide covers the statistics highlighting department wise increase in current year expenses as compared to previous years. Various departments included are production, marketing, operations, administration, HR, accounting and finance Do you know about Slidesgeeks Key Techniques To Enhance Cost Efficiency Statistics Highlighting Increase In Departmental Costs Structure PDF. These are perfect for delivering any kind od presentation. Using it, create PowerPoint presentations that communicate your ideas and engage audiences. Save time and effort by using our pre designed presentation templates that are perfect for a wide range of topic. Our vast selection of designs covers a range of styles, from creative to business, and are all highly customizable and easy to edit. Download as a PowerPoint template or use them as Google Slides themes.


Slide 1 of 10
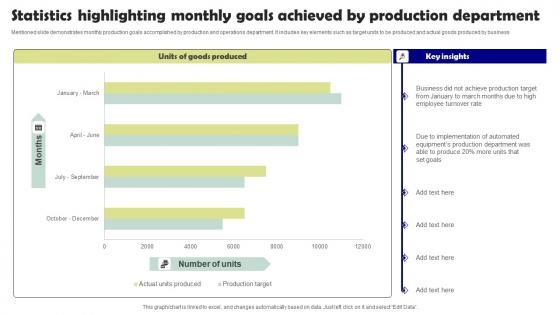
Mentioned slide demonstrates monthly production goals accomplished by production and operations department. It includes key elements such as target units to be produced and actual goods produced by business. Showcasing this set of slides titled Statistics Highlighting Monthly Goals Achieved By Production Department Graphics Pdf. The topics addressed in these templates are Goods Produced. All the content presented in this PPT design is completely editable. Download it and make adjustments in color, background, font etc. as per your unique business setting. Mentioned slide demonstrates monthly production goals accomplished by production and operations department. It includes key elements such as target units to be produced and actual goods produced by business.
9 Item(s)
