- Sign up
- Sign In
 AI PPT Maker
 Templates
 PPT Bundles
 Design Services
 Business PPTs
 Business Plan
 Management
 Strategy
 Introduction PPT
 Roadmap
 Self Introduction
 Timelines
 Process
 Marketing
 Agenda
 Technology
 Medical
 Startup Business Plan
 Cyber Security
 Dashboards
 SWOT
SWOT Proposals
 Education
 Pitch Deck
 Digital Marketing
 KPIs
KPIs Project Management
 Product Management
 Artificial Intelligence
 Target Market
 Communication
 Supply Chain
 Google Slides
 Research Services
 One Pagers
 All Categories
Statistical analytics PowerPoint Presentation Templates and Google Slides
SHOW
- 60
- 120
- 180
DISPLAYING: 60 of 61 Item(s)
Page

Persuade your audience using this Motor Insurance Analytics Statistics And Dashboard Icon Template PDF. This PPT design covers three stages, thus making it a great tool to use. It also caters to a variety of topics including Motor Insurance Analytics, Statistics And Dashboard Icon. Download this PPT design now to present a convincing pitch that not only emphasizes the topic but also showcases your presentation skills.
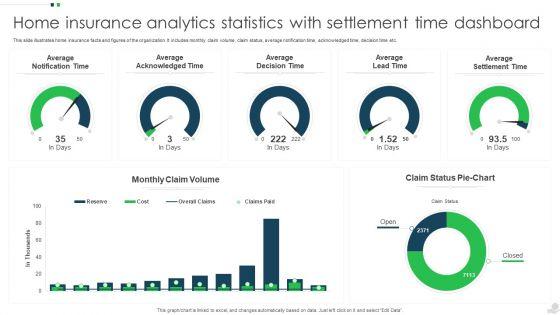

This slide illustrates home insurance facts and figures of the organization. It includes monthly claim volume, claim status, average notification time, acknowledged time, decision time etc. Pitch your topic with ease and precision using this Home Insurance Analytics Statistics With Settlement Time Dashboard Ideas PDF. This layout presents information on Average Acknowledged Time, Average Decision Time, Average Lead Time. It is also available for immediate download and adjustment. So, changes can be made in the color, design, graphics or any other component to create a unique layout.

This slide illustrates general status and trend of claims of health insurance providers. It includes claim status, reject status, past trend status and receivables. Showcasing this set of slides titled Healthcare Insurance Analytics Providers Statistics Dashboard Mockup PDF. The topics addressed in these templates are Claim Status, Past Trend Claims, Receivables. All the content presented in this PPT design is completely editable. Download it and make adjustments in color, background, font etc. as per your unique business setting.
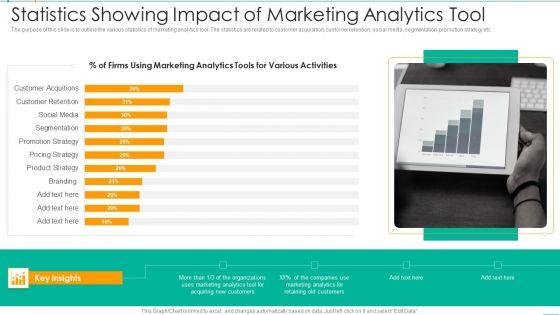
The purpose of this slide is to outline the various statistics of marketing analytics tool. The statistics are related to customer acquisition, customer retention, social media, segmentation, promotion strategy etc. Showcasing this set of slides titled Statistics Showing Impact Of Marketing Analytics Tool Background PDF. The topics addressed in these templates are Marketing, Organizations, Customers. All the content presented in this PPT design is completely editable. Download it and make adjustments in color, background, font etc. as per your unique business setting.
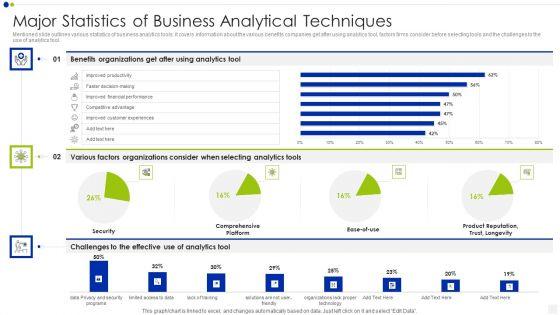

Mentioned slide outlines various statistics of business analytics tools. It covers information about the various benefits companies get after using analytics tool, factors firms consider before selecting tools and the challenges to the use of analytics tool. Showcasing this set of slides titled major statistics of business analytical techniques infographics pdf. The topics addressed in these templates are security, analytics, organizations. All the content presented in this PPT design is completely editable. Download it and make adjustments in color, background, font etc. as per your unique business setting.
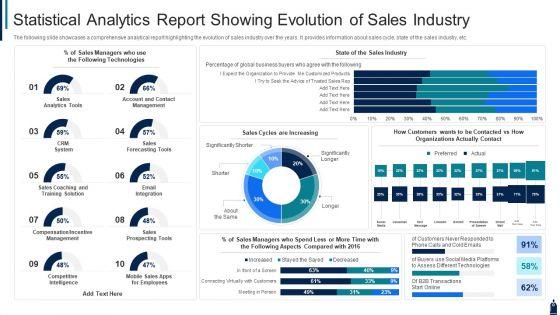
The following slide showcases a comprehensive analytical report highlighting the evolution of sales industry over the years. It provides information about sales cycle, state of the sales industry, etc. Showcasing this set of slides titled statistical analytics report showing evolution of sales industry diagrams pdf. The topics addressed in these templates are sales, technologies, system. All the content presented in this PPT design is completely editable. Download it and make adjustments in color, background, font etc. as per your unique business setting.
Presenting statistical data icon of data analytics using bar graph background pdf to dispense important information. This template comprises four stages. It also presents valuable insights into the topics including statistical data icon of data analytics using bar graph. This is a completely customizable PowerPoint theme that can be put to use immediately. So, download it and address the topic impactfully.
Persuade your audience using this statistical data dashboard icon depicting analytical figures sample pdf. This PPT design covers four stages, thus making it a great tool to use. It also caters to a variety of topics including statistical data dashboard icon depicting analytical figures. Download this PPT design now to present a convincing pitch that not only emphasizes the topic but also showcases your presentation skills.
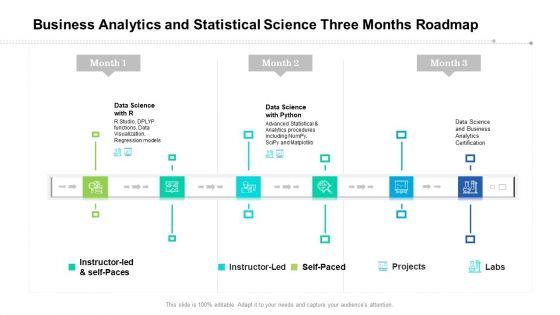
Presenting our jaw dropping business analytics and statistical science three months roadmap demonstration. You can alternate the color, font size, font type, and shapes of this PPT layout according to your strategic process. This PPT presentation is compatible with Google Slides and is available in both standard screen and widescreen aspect ratios. You can also download this well researched PowerPoint template design in different formats like PDF, JPG, and PNG. So utilize this visually appealing design by clicking the download button given below.
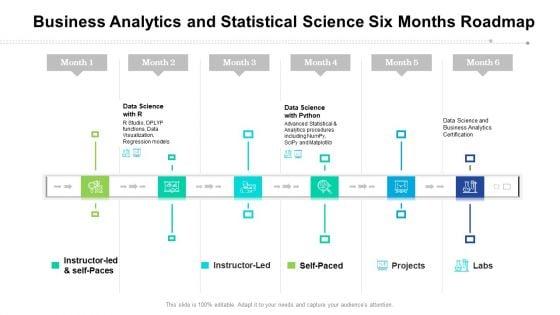

Presenting the business analytics and statistical science six months roadmap designs. The template includes a roadmap that can be used to initiate a strategic plan. Not only this, the PowerPoint slideshow is completely editable and you can effortlessly modify the font size, font type, and shapes according to your needs. This PPT slide can be easily reached in standard screen and widescreen aspect ratios. The set is also available in various formats like PDF, PNG, and JPG. So download and use it multiple times as per your knowledge.
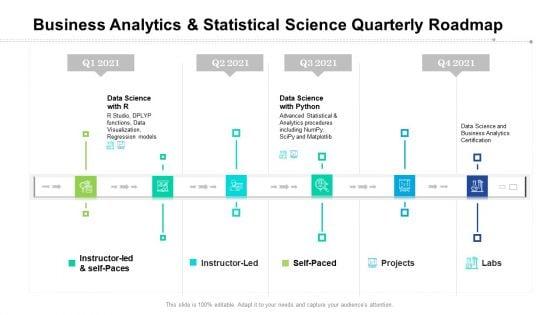

Introducing our business analytics and statistical science quarterly roadmap demonstration. This PPT presentation is Google Slides compatible, therefore, you can share it easily with the collaborators for measuring the progress. Also, the presentation is available in both standard screen and widescreen aspect ratios. So edit the template design by modifying the font size, font type, color, and shapes as per your requirements. As this PPT design is fully editable it can be presented in PDF, JPG and PNG formats.


Presenting our innovatively structured business analytics and statistical science half yearly roadmap summary Template. Showcase your roadmap process in different formats like PDF, PNG, and JPG by clicking the download button below. This PPT design is available in both Standard Screen and Widescreen aspect ratios. It can also be easily personalized and presented with modified font size, font type, color, and shapes to measure your progress in a clear way.
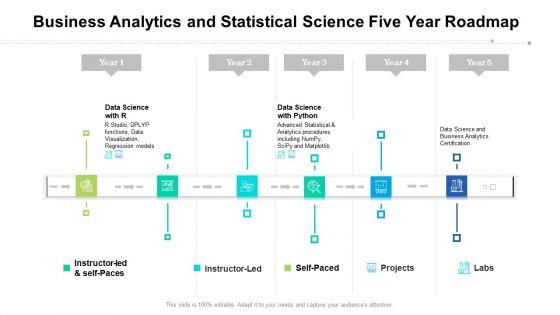
We present our business analytics and statistical science five year roadmap rules. This PowerPoint layout is easy to edit so you can change the font size, font type, color, and shape conveniently. In addition to this, the PowerPoint layout is Google Slides compatible, so you can share it with your audience and give them access to edit it. Therefore, download and save this well researched business analytics and statistical science five year roadmap rules in different formats like PDF, PNG, and JPG to smoothly execute your business plan.

Measure the engagement of a segment of a customers with your brand their last time of purchase and session. Each segment should be targeted differently by the marketing department. Deliver an awe inspiring pitch with this creative customer behavioral data and analytics customer lifecycle statistics elements pdf bundle. Topics like days since last session, days since last purchase, sessions per person, average session length can be discussed with this completely editable template. It is available for immediate download depending on the needs and requirements of the user.
Presenting this set of slides with name data analytics statistics ppt powerpoint presentation file grid cpb. This is an editable Powerpoint five stages graphic that deals with topics like data analytics statistics to help convey your message better graphically. This product is a premium product available for immediate download and is 100 percent editable in Powerpoint. Download this now and use it in your presentations to impress your audience.
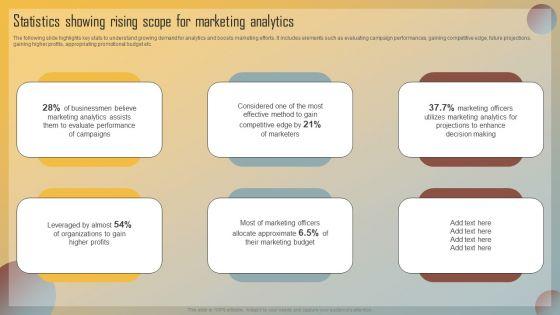


The following slide highlights key stats to understand growing demand for analytics and boosts marketing efforts. It includes elements such as evaluating campaign performances, gaining competitive edge, future projections, gaining higher profits, appropriating promotional budget etc. Find highly impressive Guide For Marketing Analytics To Improve Decisions Statistics Showing Rising Scope For Marketing Analytics Information PDF on Slidegeeks to deliver a meaningful presentation. You can save an ample amount of time using these presentation templates. No need to worry to prepare everything from scratch because Slidegeeks experts have already done a huge research and work for you. You need to download Guide For Marketing Analytics To Improve Decisions Statistics Showing Rising Scope For Marketing Analytics Information PDF for your upcoming presentation. All the presentation templates are 100 percent editable and you can change the color and personalize the content accordingly. Download now.

The following slide showcases some marketing analytics facts and figures to encourage business decisions based on big data. It includes elements such as higher return on investments, promotional expenses, competitive outputs, budget investments etc. This modern and well arranged Guide For Marketing Analytics To Improve Decisions Statistics Highlighting Demand For Data Driven Decision Making Slides PDF provides lots of creative possibilities. It is very simple to customize and edit with the Powerpoint Software. Just drag and drop your pictures into the shapes. All facets of this template can be edited with Powerpoint no extra software is necessary. Add your own material, put your images in the places assigned for them, adjust the colors, and then you can show your slides to the world, with an animated slide included.
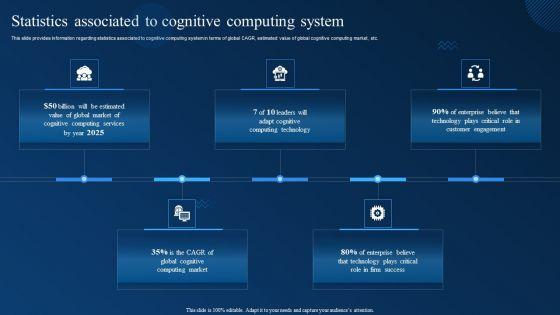
This slide provides information regarding statistics associated to cognitive computing system in terms of global CAGR, estimated value of global cognitive computing market, etc. This Cognitive Analytics Strategy And Techniques Statistics Associated To Cognitive Computing System Template PDF from Slidegeeks makes it easy to present information on your topic with precision. It provides customization options, so you can make changes to the colors, design, graphics, or any other component to create a unique layout. It is also available for immediate download, so you can begin using it right away. Slidegeeks has done good research to ensure that you have everything you need to make your presentation stand out. Make a name out there for a brilliant performance.
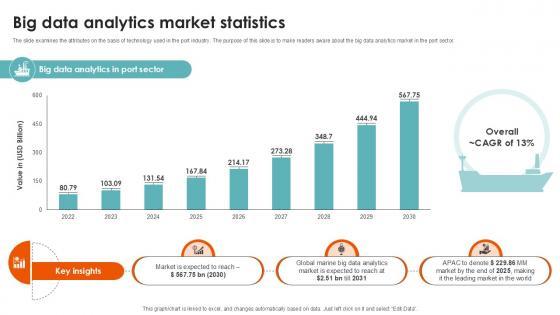

The slide examines the attributes on the basis of technology used in the port industry. The purpose of this slide is to make readers aware about the big data analytics market in the port sector. Boost your pitch with our creative Big Data Analytics Market Statistics Port Terminal Industry Ppt Template. Deliver an awe inspiring pitch that will mesmerize everyone. Using these presentation templates you will surely catch everyones attention. You can browse the ppts collection on our website. We have researchers who are experts at creating the right content for the templates. So you do not have to invest time in any additional work. Just grab the template now and use them. The slide examines the attributes on the basis of technology used in the port industry. The purpose of this slide is to make readers aware about the big data analytics market in the port sector.
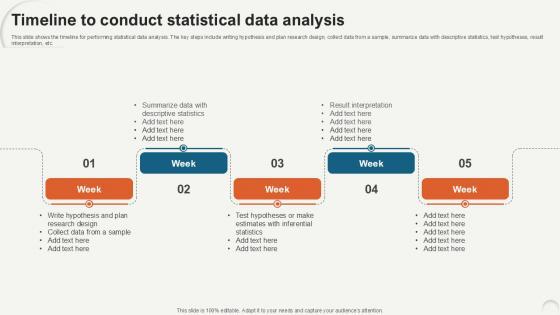
This slide shows the timeline for performing statistical data analysis. The key steps include writing hypothesis and plan research design, collect data from a sample, summarize data with descriptive statistics, test hypotheses, result interpretation, etc. Slidegeeks is here to make your presentations a breeze with Timeline To Conduct Statistical Data Analytics For Informed Decision Ppt Presentation With our easy-to-use and customizable templates, you can focus on delivering your ideas rather than worrying about formatting. With a variety of designs to choose from, you are sure to find one that suits your needs. And with animations and unique photos, illustrations, and fonts, you can make your presentation pop. So whether you are giving a sales pitch or presenting to the board, make sure to check out Slidegeeks first This slide shows the timeline for performing statistical data analysis. The key steps include writing hypothesis and plan research design, collect data from a sample, summarize data with descriptive statistics, test hypotheses, result interpretation, etc.
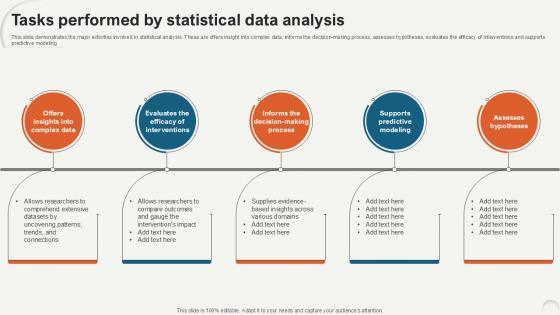
This slide demonstrates the major activities involved in statistical analysis. These are offers insight into complex data, informs the decision-making process, assesses hypotheses, evaluates the efficacy of interventions and supports predictive modeling. Present like a pro with Tasks Performed By Statistical Data Analytics For Informed Decision Ppt Presentation. Create beautiful presentations together with your team, using our easy-to-use presentation slides. Share your ideas in real-time and make changes on the fly by downloading our templates. So whether you are in the office, on the go, or in a remote location, you can stay in sync with your team and present your ideas with confidence. With Slidegeeks presentation got a whole lot easier. Grab these presentations today. This slide demonstrates the major activities involved in statistical analysis. These are offers insight into complex data, informs the decision-making process, assesses hypotheses, evaluates the efficacy of interventions and supports predictive modeling.

This slide outlines the statistical and data analysis methods applied in different fields. These domains are spatial models, time series, survival analysis, market segmentation, recommendation systems, attribution modeling, clustering, etc. Boost your pitch with our creative Statistical And Data Analysis Techniques Data Analytics For Informed Decision Ppt Sample. Deliver an awe-inspiring pitch that will mesmerize everyone. Using these presentation templates you will surely catch everyones attention. You can browse the ppts collection on our website. We have researchers who are experts at creating the right content for the templates. So you do not have to invest time in any additional work. Just grab the template now and use them. This slide outlines the statistical and data analysis methods applied in different fields. These domains are spatial models, time series, survival analysis, market segmentation, recommendation systems, attribution modeling, clustering, etc.
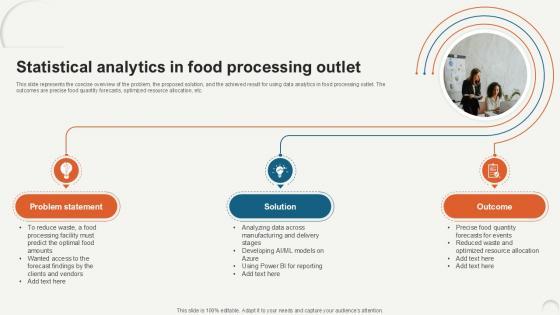
This slide represents the concise overview of the problem, the proposed solution, and the achieved result for using data analytics in food processing outlet. The outcomes are precise food quantity forecasts, optimized resource allocation, etc. Find a pre-designed and impeccable Statistical Analytics In Food Processing Data Analytics For Informed Decision Ppt PowerPoint. The templates can ace your presentation without additional effort. You can download these easy-to-edit presentation templates to make your presentation stand out from others. So, what are you waiting for Download the template from Slidegeeks today and give a unique touch to your presentation. This slide represents the concise overview of the problem, the proposed solution, and the achieved result for using data analytics in food processing outlet. The outcomes are precise food quantity forecasts, optimized resource allocation, etc.
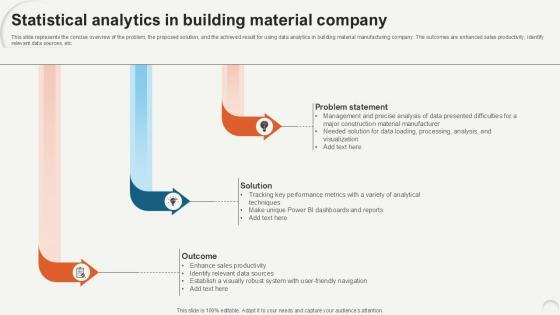
This slide represents the concise overview of the problem, the proposed solution, and the achieved result for using data analytics in building material manufacturing company. The outcomes are enhanced sales productivity, identify relevant data sources, etc. Do you know about Slidesgeeks Statistical Analytics In Building Data Analytics For Informed Decision Ppt PowerPoint These are perfect for delivering any kind od presentation. Using it, create PowerPoint presentations that communicate your ideas and engage audiences. Save time and effort by using our pre-designed presentation templates that are perfect for a wide range of topic. Our vast selection of designs covers a range of styles, from creative to business, and are all highly customizable and easy to edit. Download as a PowerPoint template or use them as Google Slides themes. This slide represents the concise overview of the problem, the proposed solution, and the achieved result for using data analytics in building material manufacturing company. The outcomes are enhanced sales productivity, identify relevant data sources, etc.
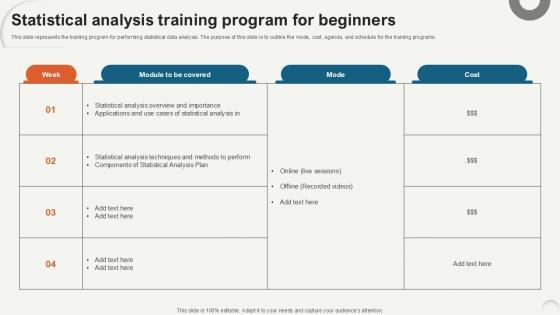
This slide represents the training program for performing statistical data analysis. The purpose of this slide is to outline the mode, cost, agenda, and schedule for the training programs. Take your projects to the next level with our ultimate collection of Statistical Analysis Training Program Data Analytics For Informed Decision Ppt Template. Slidegeeks has designed a range of layouts that are perfect for representing task or activity duration, keeping track of all your deadlines at a glance. Tailor these designs to your exact needs and give them a truly corporate look with your own brand colors they will make your projects stand out from the rest This slide represents the training program for performing statistical data analysis. The purpose of this slide is to outline the mode, cost, agenda, and schedule for the training programs.

The purpose of this slide is to outline the different software used to perform statistical analysis. This slide represents the primary features and benefits of various statistical software available in the market. This Statistical Analysis Software Features Data Analytics For Informed Decision Ppt Presentation from Slidegeeks makes it easy to present information on your topic with precision. It provides customization options, so you can make changes to the colors, design, graphics, or any other component to create a unique layout. It is also available for immediate download, so you can begin using it right away. Slidegeeks has done good research to ensure that you have everything you need to make your presentation stand out. Make a name out there for a brilliant performance. The purpose of this slide is to outline the different software used to perform statistical analysis. This slide represents the primary features and benefits of various statistical software available in the market.
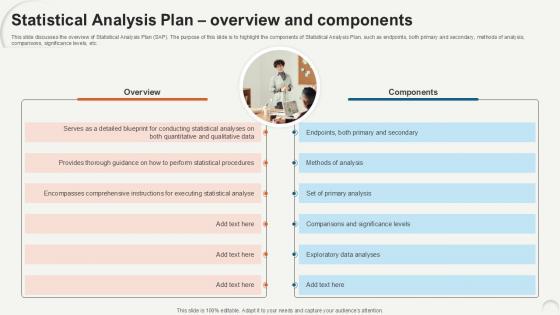
This slide discusses the overview of Statistical Analysis Plan SAP. The purpose of this slide is to highlight the components of Statistical Analysis Plan, such as endpoints, both primary and secondary, methods of analysis, comparisons, significance levels, etc. Here you can discover an assortment of the finest PowerPoint and Google Slides templates. With these templates, you can create presentations for a variety of purposes while simultaneously providing your audience with an eye-catching visual experience. Download Statistical Analysis Plan Overview Data Analytics For Informed Decision Ppt Template to deliver an impeccable presentation. These templates will make your job of preparing presentations much quicker, yet still, maintain a high level of quality. Slidegeeks has experienced researchers who prepare these templates and write high-quality content for you. Later on, you can personalize the content by editing the Statistical Analysis Plan Overview Data Analytics For Informed Decision Ppt Template. This slide discusses the overview of Statistical Analysis Plan SAP. The purpose of this slide is to highlight the components of Statistical Analysis Plan, such as endpoints, both primary and secondary, methods of analysis, comparisons, significance levels, etc.
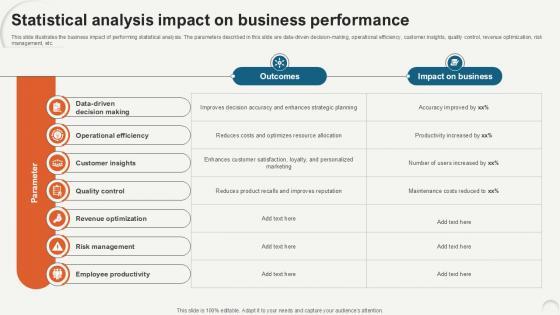
This slide illustrates the business impact of performing statistical analysis. The parameters described in this slide are data-driven decision-making, operational efficiency, customer insights, quality control, revenue optimization, risk management, etc. Presenting this PowerPoint presentation, titled Statistical Analysis Impact On Data Analytics For Informed Decision Ppt PowerPoint, with topics curated by our researchers after extensive research. This editable presentation is available for immediate download and provides attractive features when used. Download now and captivate your audience. Presenting this Statistical Analysis Impact On Data Analytics For Informed Decision Ppt PowerPoint. Our researchers have carefully researched and created these slides with all aspects taken into consideration. This is a completely customizable Statistical Analysis Impact On Data Analytics For Informed Decision Ppt PowerPoint that is available for immediate downloading. Download now and make an impact on your audience. Highlight the attractive features available with our PPTs. This slide illustrates the business impact of performing statistical analysis. The parameters described in this slide are data-driven decision-making, operational efficiency, customer insights, quality control, revenue optimization, risk management, etc.
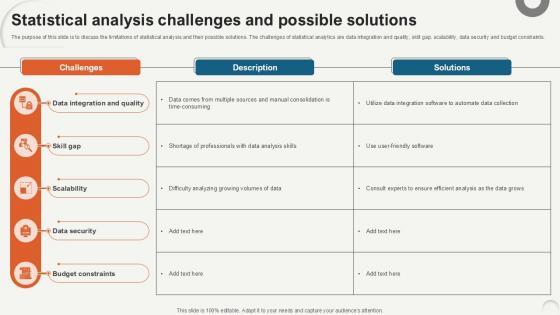
The purpose of this slide is to discuss the limitations of statistical analysis and their possible solutions. The challenges of statistical analytics are data integration and quality, skill gap, scalability, data security and budget constraints. Slidegeeks has constructed Statistical Analysis Challenges Data Analytics For Informed Decision Ppt Example after conducting extensive research and examination. These presentation templates are constantly being generated and modified based on user preferences and critiques from editors. Here, you will find the most attractive templates for a range of purposes while taking into account ratings and remarks from users regarding the content. This is an excellent jumping-off point to explore our content and will give new users an insight into our top-notch PowerPoint Templates. The purpose of this slide is to discuss the limitations of statistical analysis and their possible solutions. The challenges of statistical analytics are data integration and quality, skill gap, scalability, data security and budget constraints.
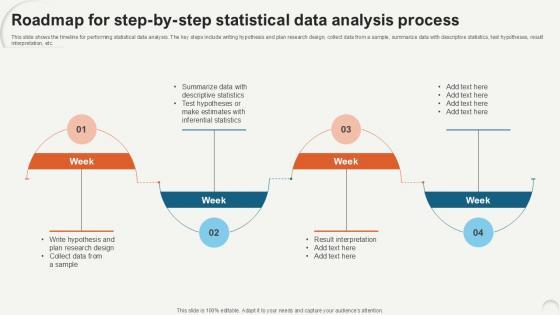
This slide shows the timeline for performing statistical data analysis. The key steps include writing hypothesis and plan research design, collect data from a sample, summarize data with descriptive statistics, test hypotheses, result interpretation, etc. Retrieve professionally designed Roadmap For Step By Step Statistical Data Analytics For Informed Decision Ppt PowerPoint to effectively convey your message and captivate your listeners. Save time by selecting pre-made slideshows that are appropriate for various topics, from business to educational purposes. These themes come in many different styles, from creative to corporate, and all of them are easily adjustable and can be edited quickly. Access them as PowerPoint templates or as Google Slides themes. You do not have to go on a hunt for the perfect presentation because Slidegeeks got you covered from everywhere. This slide shows the timeline for performing statistical data analysis. The key steps include writing hypothesis and plan research design, collect data from a sample, summarize data with descriptive statistics, test hypotheses, result interpretation, etc.
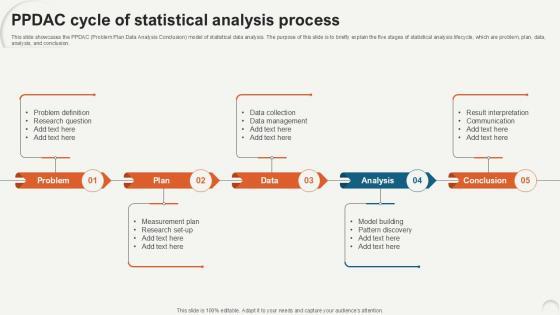
This slide showcases the PPDAC Problem Plan Data Analysis Conclusion model of statistical data analysis. The purpose of this slide is to briefly explain the five stages of statistical analysis lifecycle, which are problem, plan, data, analysis, and conclusion. Are you searching for a PPDAC Cycle Of Statistical Data Analytics For Informed Decision Ppt Template that is uncluttered, straightforward, and original Its easy to edit, and you can change the colors to suit your personal or business branding. For a presentation that expresses how much effort you have put in, this template is ideal With all of its features, including tables, diagrams, statistics, and lists, its perfect for a business plan presentation. Make your ideas more appealing with these professional slides. Download PPDAC Cycle Of Statistical Data Analytics For Informed Decision Ppt Template from Slidegeeks today. This slide showcases the PPDAC Problem Plan Data Analysis Conclusion model of statistical data analysis. The purpose of this slide is to briefly explain the five stages of statistical analysis lifecycle, which are problem, plan, data, analysis, and conclusion.
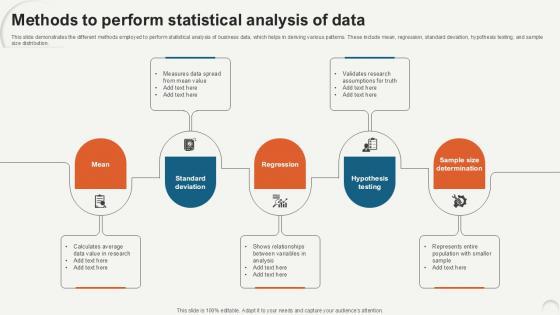
This slide demonstrates the different methods employed to perform statistical analysis of business data, which helps in deriving various patterns. These include mean, regression, standard deviation, hypothesis testing, and sample size distribution. The best PPT templates are a great way to save time, energy, and resources. Slidegeeks have 100 percent editable powerpoint slides making them incredibly versatile. With these quality presentation templates, you can create a captivating and memorable presentation by combining visually appealing slides and effectively communicating your message. Download Methods To Perform Statistical Data Analytics For Informed Decision Ppt Presentation from Slidegeeks and deliver a wonderful presentation. This slide demonstrates the different methods employed to perform statistical analysis of business data, which helps in deriving various patterns. These include mean, regression, standard deviation, hypothesis testing, and sample size distribution.
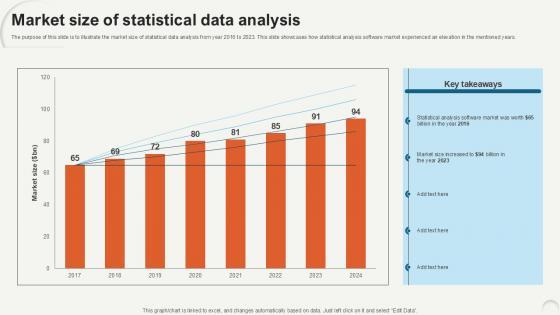
The purpose of this slide is to illustrate the market size of statistical data analysis from year 2016 to 2023. This slide showcases how statistical analysis software market experienced an elevation in the mentioned years. Explore a selection of the finest Market Size Of Statistical Data Analytics For Informed Decision Ppt Template here. With a plethora of professionally designed and pre-made slide templates, you can quickly and easily find the right one for your upcoming presentation. You can use our Market Size Of Statistical Data Analytics For Informed Decision Ppt Template to effectively convey your message to a wider audience. Slidegeeks has done a lot of research before preparing these presentation templates. The content can be personalized and the slides are highly editable. Grab templates today from Slidegeeks. The purpose of this slide is to illustrate the market size of statistical data analysis from year 2016 to 2023. This slide showcases how statistical analysis software market experienced an elevation in the mentioned years.
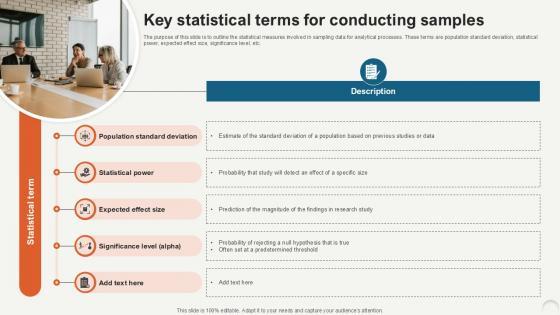
The purpose of this slide is to outline the statistical measures involved in sampling data for analytical processes. These terms are population standard deviation, statistical power, expected effect size, significance level, etc. Welcome to our selection of the Key Statistical Terms For Conducting Data Analytics For Informed Decision Ppt Template. These are designed to help you showcase your creativity and bring your sphere to life. Planning and Innovation are essential for any business that is just starting out. This collection contains the designs that you need for your everyday presentations. All of our PowerPoints are 100Percent editable, so you can customize them to suit your needs. This multi-purpose template can be used in various situations. Grab these presentation templates today. The purpose of this slide is to outline the statistical measures involved in sampling data for analytical processes. These terms are population standard deviation, statistical power, expected effect size, significance level, etc.

This slide outlines the various sections of Statistical Analysis Plan SAP. The components include document information, sample size calculation, analysis goals and objectives, outcome measures, data analysis procedures, statistical significance, etc. This Key Components Of Statistical Data Analytics For Informed Decision Ppt Example is perfect for any presentation, be it in front of clients or colleagues. It is a versatile and stylish solution for organizing your meetings. The Key Components Of Statistical Data Analytics For Informed Decision Ppt Example features a modern design for your presentation meetings. The adjustable and customizable slides provide unlimited possibilities for acing up your presentation. Slidegeeks has done all the homework before launching the product for you. So, do not wait, grab the presentation templates today This slide outlines the various sections of Statistical Analysis Plan SAP. The components include document information, sample size calculation, analysis goals and objectives, outcome measures, data analysis procedures, statistical significance, etc.
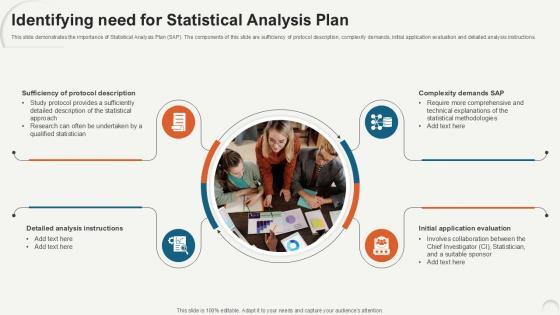
This slide demonstrates the importance of Statistical Analysis Plan SAP. The components of this slide are sufficiency of protocol description, complexity demands, initial application evaluation and detailed analysis instructions. Coming up with a presentation necessitates that the majority of the effort goes into the content and the message you intend to convey. The visuals of a PowerPoint presentation can only be effective if it supplements and supports the story that is being told. Keeping this in mind our experts created Identifying Need For Statistical Data Analytics For Informed Decision Ppt PowerPoint to reduce the time that goes into designing the presentation. This way, you can concentrate on the message while our designers take care of providing you with the right template for the situation. This slide demonstrates the importance of Statistical Analysis Plan SAP. The components of this slide are sufficiency of protocol description, complexity demands, initial application evaluation and detailed analysis instructions.


This slide depicts the forecast value of statistical analysis software market. The purpose of this slide is to highlight the expected contribution of different countries in global market of statistical data analysis software, such as North America, Europe, etc. Are you in need of a template that can accommodate all of your creative concepts This one is crafted professionally and can be altered to fit any style. Use it with Google Slides or PowerPoint. Include striking photographs, symbols, depictions, and other visuals. Fill, move around, or remove text boxes as desired. Test out color palettes and font mixtures. Edit and save your work, or work with colleagues. Download Global Market Of Statistical Data Analytics For Informed Decision Ppt PowerPoint and observe how to make your presentation outstanding. Give an impeccable presentation to your group and make your presentation unforgettable. This slide depicts the forecast value of statistical analysis software market. The purpose of this slide is to highlight the expected contribution of different countries in global market of statistical data analysis software, such as North America, Europe, etc.
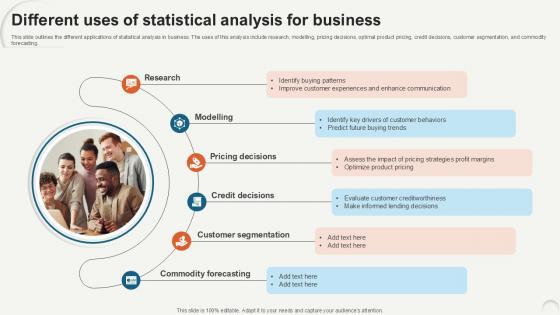
This slide outlines the different applications of statistical analysis in business. The uses of this analysis include research, modelling, pricing decisions, optimal product pricing, credit decisions, customer segmentation, and commodity forecasting. If your project calls for a presentation, then Slidegeeks is your go-to partner because we have professionally designed, easy-to-edit templates that are perfect for any presentation. After downloading, you can easily edit Different Uses Of Statistical Data Analytics For Informed Decision Ppt Slide and make the changes accordingly. You can rearrange slides or fill them with different images. Check out all the handy templates This slide outlines the different applications of statistical analysis in business. The uses of this analysis include research, modelling, pricing decisions, optimal product pricing, credit decisions, customer segmentation, and commodity forecasting.
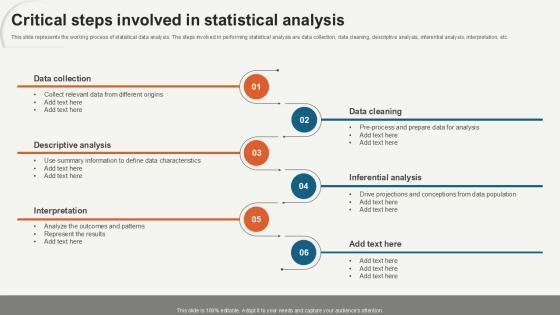
This slide represents the working process of statistical data analysis. The steps involved in performing statistical analysis are data collection, data cleaning, descriptive analysis, inferential analysis, interpretation, etc. Slidegeeks is here to make your presentations a breeze with Critical Steps Involved In Statistical Data Analytics For Informed Decision Ppt Presentation With our easy-to-use and customizable templates, you can focus on delivering your ideas rather than worrying about formatting. With a variety of designs to choose from, you are sure to find one that suits your needs. And with animations and unique photos, illustrations, and fonts, you can make your presentation pop. So whether you are giving a sales pitch or presenting to the board, make sure to check out Slidegeeks first This slide represents the working process of statistical data analysis. The steps involved in performing statistical analysis are data collection, data cleaning, descriptive analysis, inferential analysis, interpretation, etc.
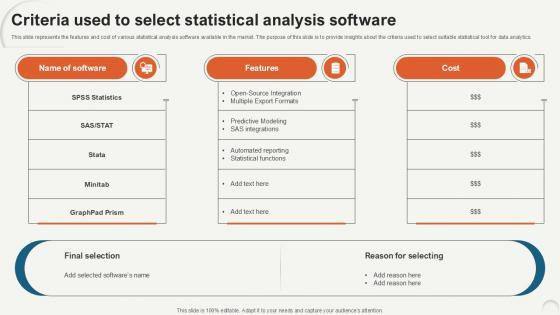
This slide represents the features and cost of various statistical analysis software available in the market. The purpose of this slide is to provide insights about the criteria used to select suitable statistical tool for data analytics. Present like a pro with Criteria Used To Select Statistical Data Analytics For Informed Decision Ppt Sample. Create beautiful presentations together with your team, using our easy-to-use presentation slides. Share your ideas in real-time and make changes on the fly by downloading our templates. So whether you are in the office, on the go, or in a remote location, you can stay in sync with your team and present your ideas with confidence. With Slidegeeks presentation got a whole lot easier. Grab these presentations today. This slide represents the features and cost of various statistical analysis software available in the market. The purpose of this slide is to provide insights about the criteria used to select suitable statistical tool for data analytics.

This slide represents the checklist to conduct statistical data analysis. The fundamental approaches are writing hypothesis and plan research design, collect data from a sample, summarize data with descriptive statistics, test hypotheses, result interpretation, etc. Get a simple yet stunning designed Checklist To Perform Statistical Data Analytics For Informed Decision Ppt Slide. It is the best one to establish the tone in your meetings. It is an excellent way to make your presentations highly effective. So, download this PPT today from Slidegeeks and see the positive impacts. Our easy-to-edit Checklist To Perform Statistical Data Analytics For Informed Decision Ppt Slide can be your go-to option for all upcoming conferences and meetings. So, what are you waiting for Grab this template today. This slide represents the checklist to conduct statistical data analysis. The fundamental approaches are writing hypothesis and plan research design, collect data from a sample, summarize data with descriptive statistics, test hypotheses, result interpretation, etc.
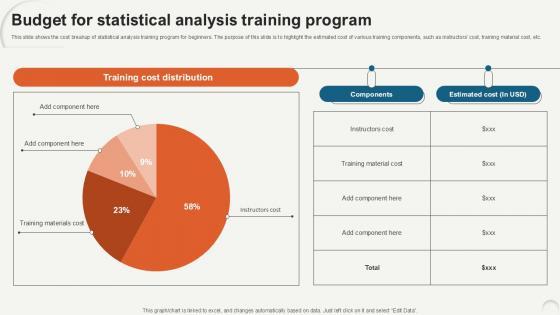
This slide shows the cost breakup of statistical analysis training program for beginners. The purpose of this slide is to highlight the estimated cost of various training components, such as instructors cost, training material cost, etc. Do you have to make sure that everyone on your team knows about any specific topic I yes, then you should give Budget For Statistical Data Analytics For Informed Decision Ppt Slide a try. Our experts have put a lot of knowledge and effort into creating this impeccable Budget For Statistical Data Analytics For Informed Decision Ppt Slide. You can use this template for your upcoming presentations, as the slides are perfect to represent even the tiniest detail. You can download these templates from the Slidegeeks website and these are easy to edit. So grab these today This slide shows the cost breakup of statistical analysis training program for beginners. The purpose of this slide is to highlight the estimated cost of various training components, such as instructors cost, training material cost, etc.

This slide outlines the different costs involved in conducting statistical data analysis. The cost categories are software and tools, hardware and infrastructure, data collection and cleaning, personnel, reporting and documentation, data storage, etc. There are so many reasons you need a Budget For Performing Statistical Data Analytics For Informed Decision Ppt Template. The first reason is you can not spend time making everything from scratch, Thus, Slidegeeks has made presentation templates for you too. You can easily download these templates from our website easily. This slide outlines the different costs involved in conducting statistical data analysis. The cost categories are software and tools, hardware and infrastructure, data collection and cleaning, personnel, reporting and documentation, data storage, etc.
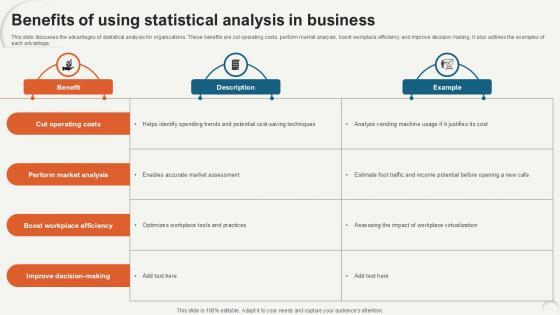
This slide discusses the advantages of statistical analysis for organizations. These benefits are cut operating costs, perform market analysis, boost workplace efficiency and improve decision making. It also outlines the examples of each advantage. Want to ace your presentation in front of a live audience Our Benefits Of Using Statistical Data Analytics For Informed Decision Ppt PowerPoint can help you do that by engaging all the users towards you. Slidegeeks experts have put their efforts and expertise into creating these impeccable powerpoint presentations so that you can communicate your ideas clearly. Moreover, all the templates are customizable, and easy-to-edit and downloadable. Use these for both personal and commercial use. This slide discusses the advantages of statistical analysis for organizations. These benefits are cut operating costs, perform market analysis, boost workplace efficiency and improve decision making. It also outlines the examples of each advantage.
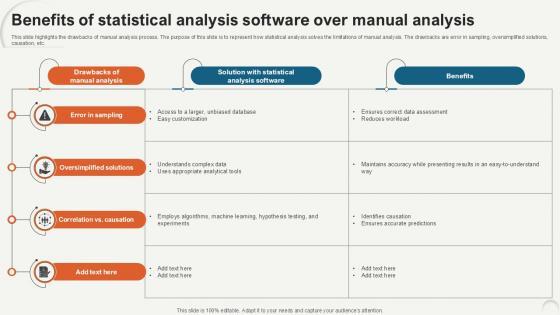
This slide highlights the drawbacks of manual analysis process. The purpose of this slide is to represent how statistical analysis solves the limitations of manual analysis. The drawbacks are error in sampling, oversimplified solutions, causation, etc. Slidegeeks is one of the best resources for PowerPoint templates. You can download easily and regulate Benefits Of Statistical Analysis Data Analytics For Informed Decision Ppt Slide for your personal presentations from our wonderful collection. A few clicks is all it takes to discover and get the most relevant and appropriate templates. Use our Templates to add a unique zing and appeal to your presentation and meetings. All the slides are easy to edit and you can use them even for advertisement purposes. This slide highlights the drawbacks of manual analysis process. The purpose of this slide is to represent how statistical analysis solves the limitations of manual analysis. The drawbacks are error in sampling, oversimplified solutions, causation, etc.
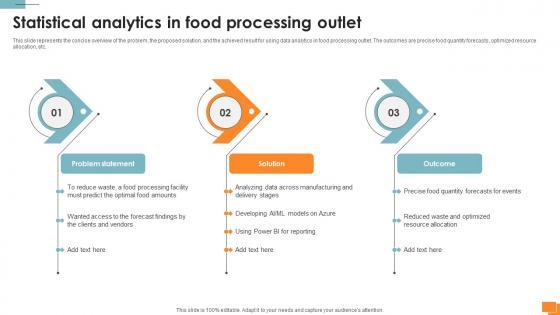
This slide represents the concise overview of the problem, the proposed solution, and the achieved result for using data analytics in food processing outlet. The outcomes are precise food quantity forecasts, optimized resource allocation, etc. Want to ace your presentation in front of a live audience Our Statistical Tools For Evidence Statistical Analytics In Food Processing Outlet can help you do that by engaging all the users towards you. Slidegeeks experts have put their efforts and expertise into creating these impeccable powerpoint presentations so that you can communicate your ideas clearly. Moreover, all the templates are customizable, and easy-to-edit and downloadable. Use these for both personal and commercial use. This slide represents the concise overview of the problem, the proposed solution, and the achieved result for using data analytics in food processing outlet. The outcomes are precise food quantity forecasts, optimized resource allocation, etc.
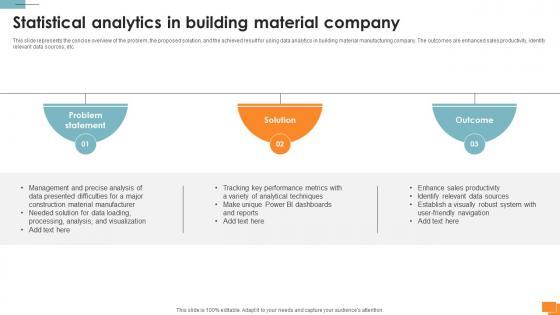
This slide represents the concise overview of the problem, the proposed solution, and the achieved result for using data analytics in building material manufacturing company. The outcomes are enhanced sales productivity, identify relevant data sources, etc. Slidegeeks is one of the best resources for PowerPoint templates. You can download easily and regulate Statistical Tools For Evidence Statistical Analytics In Building Material Company for your personal presentations from our wonderful collection. A few clicks is all it takes to discover and get the most relevant and appropriate templates. Use our Templates to add a unique zing and appeal to your presentation and meetings. All the slides are easy to edit and you can use them even for advertisement purposes. This slide represents the concise overview of the problem, the proposed solution, and the achieved result for using data analytics in building material manufacturing company. The outcomes are enhanced sales productivity, identify relevant data sources, etc.
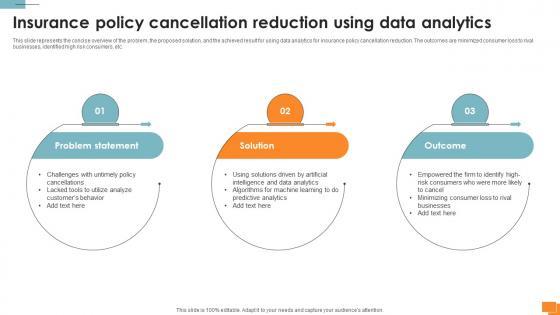
This slide represents the concise overview of the problem, the proposed solution, and the achieved result for using data analytics for insurance policy cancellation reduction. The outcomes are minimized consumer loss to rival businesses, identified high risk consumers, etc. The best PPT templates are a great way to save time, energy, and resources. Slidegeeks have 100 percent editable powerpoint slides making them incredibly versatile. With these quality presentation templates, you can create a captivating and memorable presentation by combining visually appealing slides and effectively communicating your message. Download Statistical Tools For Evidence Insurance Policy Cancellation Reduction Using Data Analytics from Slidegeeks and deliver a wonderful presentation. This slide represents the concise overview of the problem, the proposed solution, and the achieved result for using data analytics for insurance policy cancellation reduction. The outcomes are minimized consumer loss to rival businesses, identified high risk consumers, etc.
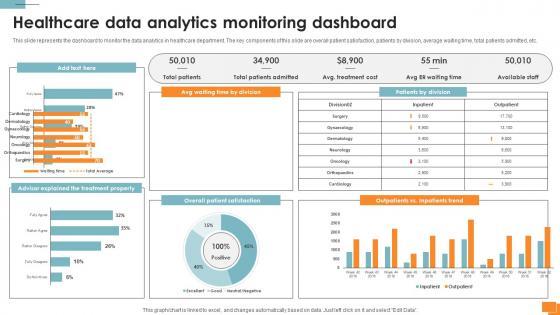

This slide represents the dashboard to monitor the data analytics in healthcare department. The key components of this slide are overall patient satisfaction, patients by division, average waiting time, total patients admitted, etc. Welcome to our selection of the Statistical Tools For Evidence Healthcare Data Analytics Monitoring Dashboard. These are designed to help you showcase your creativity and bring your sphere to life. Planning and Innovation are essential for any business that is just starting out. This collection contains the designs that you need for your everyday presentations. All of our PowerPoints are 100Percent editable, so you can customize them to suit your needs. This multi-purpose template can be used in various situations. Grab these presentation templates today. This slide represents the dashboard to monitor the data analytics in healthcare department. The key components of this slide are overall patient satisfaction, patients by division, average waiting time, total patients admitted, etc.

This slide represents the concise overview of the problem, the proposed solution, and the achieved result for end-to-end HR data and analytics management. The outcomes are providing predictive reporting capabilities, boost platform security, etc. Coming up with a presentation necessitates that the majority of the effort goes into the content and the message you intend to convey. The visuals of a PowerPoint presentation can only be effective if it supplements and supports the story that is being told. Keeping this in mind our experts created Statistical Tools For Evidence End To End HR Data And Analytics Management to reduce the time that goes into designing the presentation. This way, you can concentrate on the message while our designers take care of providing you with the right template for the situation. This slide represents the concise overview of the problem, the proposed solution, and the achieved result for end-to-end HR data and analytics management. The outcomes are providing predictive reporting capabilities, boost platform security, etc.

This slide represents the concise overview of the problem, the proposed solution, and the achieved result for using data analytics to improve visualization for US manufacturers. The problems were poor data performance, unmanageable reporting, etc. Crafting an eye-catching presentation has never been more straightforward. Let your presentation shine with this tasteful yet straightforward Statistical Tools For Evidence Data Analytics To Improve Visualization For Us Manufacturers template. It offers a minimalistic and classy look that is great for making a statement. The colors have been employed intelligently to add a bit of playfulness while still remaining professional. Construct the ideal Statistical Tools For Evidence Data Analytics To Improve Visualization For Us Manufacturers that effortlessly grabs the attention of your audience Begin now and be certain to wow your customers This slide represents the concise overview of the problem, the proposed solution, and the achieved result for using data analytics to improve visualization for US manufacturers. The problems were poor data performance, unmanageable reporting, etc.
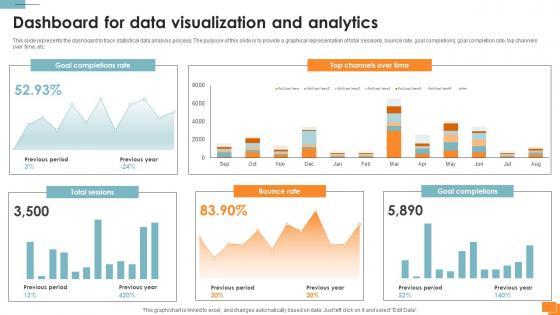
This slide represents the dashboard to track statistical data analysis process. The purpose of this slide is to provide a graphical representation of total sessions, bounce rate, goal completions, goal completion rate, top channels over time, etc. Are you in need of a template that can accommodate all of your creative concepts This one is crafted professionally and can be altered to fit any style. Use it with Google Slides or PowerPoint. Include striking photographs, symbols, depictions, and other visuals. Fill, move around, or remove text boxes as desired. Test out color palettes and font mixtures. Edit and save your work, or work with colleagues. Download Statistical Tools For Evidence Dashboard For Data Visualization And Analytics and observe how to make your presentation outstanding. Give an impeccable presentation to your group and make your presentation unforgettable. This slide represents the dashboard to track statistical data analysis process. The purpose of this slide is to provide a graphical representation of total sessions, bounce rate, goal completions, goal completion rate, top channels over time, etc.
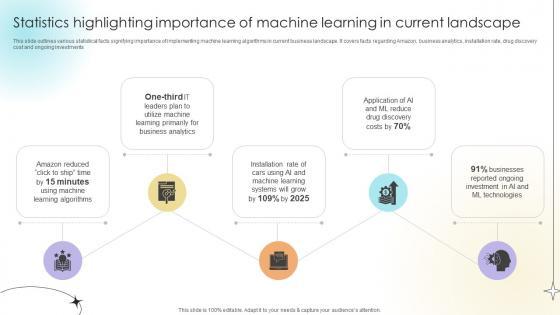
This slide outlines various statistical facts signifying importance of implementing machine learning algorithms in current business landscape. It covers facts regarding Amazon, business analytics, installation rate, drug discovery cost and ongoing investments.Do you know about Slidesgeeks Statistics Highlighting Importance Of Machine Learning In Current Landscape Data Analytics SS V These are perfect for delivering any kind od presentation. Using it, create PowerPoint presentations that communicate your ideas and engage audiences. Save time and effort by using our pre-designed presentation templates that are perfect for a wide range of topic. Our vast selection of designs covers a range of styles, from creative to business, and are all highly customizable and easy to edit. Download as a PowerPoint template or use them as Google Slides themes. This slide outlines various statistical facts signifying importance of implementing machine learning algorithms in current business landscape. It covers facts regarding Amazon, business analytics, installation rate, drug discovery cost and ongoing investments.


This slide outlines statistical figures citing reasons for businesses to adopt customer journey mapping. It covers reasons pertaining to providers, customer journey, processes, sales leads, etc Crafting an eye-catching presentation has never been more straightforward. Let your presentation shine with this tasteful yet straightforward Statistics Highlighting Need For Customer Journey Mapping Product Analytics Implementation Data Analytics V template. It offers a minimalistic and classy look that is great for making a statement. The colors have been employed intelligently to add a bit of playfulness while still remaining professional. Construct the ideal Statistics Highlighting Need For Customer Journey Mapping Product Analytics Implementation Data Analytics V that effortlessly grabs the attention of your audience Begin now and be certain to wow your customers This slide outlines statistical figures citing reasons for businesses to adopt customer journey mapping. It covers reasons pertaining to providers, customer journey, processes, sales leads, etc
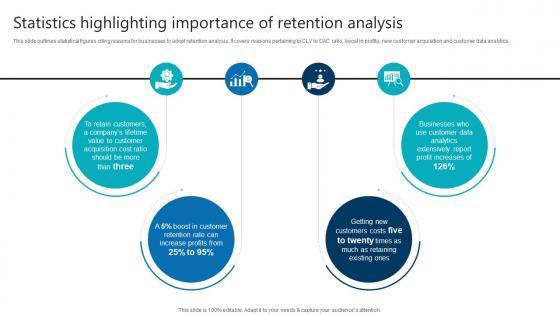
This slide outlines statistical figures citing reasons for businesses to adopt retention analysis. It covers reasons pertaining to CLV to CAC ratio, boost in profits, new customer acquisition and customer data analyticsAre you in need of a template that can accommodate all of your creative concepts This one is crafted professionally and can be altered to fit any style. Use it with Google Slides or PowerPoint. Include striking photographs, symbols, depictions, and other visuals. Fill, move around, or remove text boxes as desired. Test out color palettes and font mixtures. Edit and save your work, or work with colleagues. Download Statistics Highlighting Importance Of Retention Analysis Product Analytics Implementation Data Analytics V and observe how to make your presentation outstanding. Give an impeccable presentation to your group and make your presentation unforgettable. This slide outlines statistical figures citing reasons for businesses to adopt retention analysis. It covers reasons pertaining to CLV to CAC ratio, boost in profits, new customer acquisition and customer data analytics
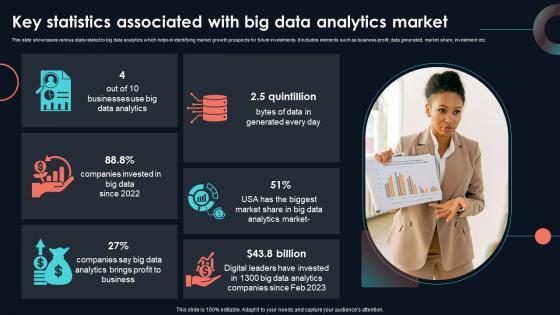
This slide showcases various stats related to big data analytics which helps in identifying market growth prospects for future investments. It includes elements such as business profit, data generated, market share, investment etc. If you are looking for a format to display your unique thoughts, then the professionally designed Key Statistics Associated With Big Data Developing Strategic Insights Using Big Data Analytics SS V is the one for you. You can use it as a Google Slides template or a PowerPoint template. Incorporate impressive visuals, symbols, images, and other charts. Modify or reorganize the text boxes as you desire. Experiment with shade schemes and font pairings. Alter, share or cooperate with other people on your work. Download Key Statistics Associated With Big Data Developing Strategic Insights Using Big Data Analytics SS V and find out how to give a successful presentation. Present a perfect display to your team and make your presentation unforgettable. This slide showcases various stats related to big data analytics which helps in identifying market growth prospects for future investments. It includes elements such as business profit, data generated, market share, investment etc.
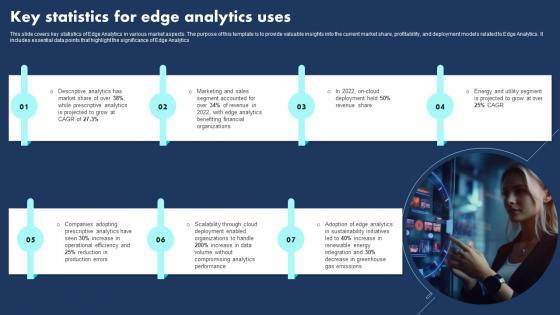
This slide covers key statistics of Edge Analytics in various market aspects. The purpose of this template is to provide valuable insights into the current market share, profitability, and deployment models related to Edge Analytics. It includes essential data points that highlight the significance of Edge Analytics.Showcasing this set of slides titled Key Statistics For Edge Analytics Uses Introduction Pdf The topics addressed in these templates are Descriptive Analytics, Production Errors, Decrease Greenhouse All the content presented in this PPT design is completely editable. Download it and make adjustments in color, background, font etc. as per your unique business setting. This slide covers key statistics of Edge Analytics in various market aspects. The purpose of this template is to provide valuable insights into the current market share, profitability, and deployment models related to Edge Analytics. It includes essential data points that highlight the significance of Edge Analytics.
Pitch your topic with ease and precision using this Icon Showing Developing Statistical Capabilities Analytics Ppt Model Show PDF. This layout presents information on Icon Showing, Developing Statistical, Capabilities Analytics. It is also available for immediate download and adjustment. So, changes can be made in the color, design, graphics or any other component to create a unique layout. Our Icon Showing Developing Statistical Capabilities Analytics Ppt Model Show PDF are topically designed to provide an attractive backdrop to any subject. Use them to look like a presentation pro.
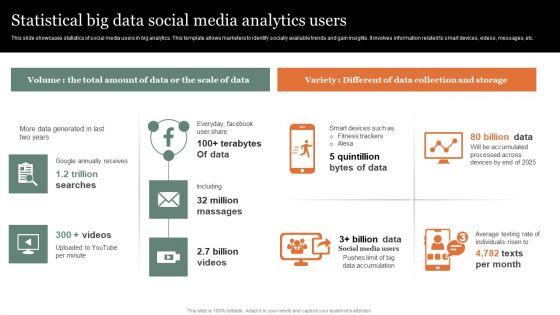
Showcasing this set of slides titled Statistical Big Data Social Media Analytics Users Pictures PDF Brochure. The topics addressed in these templates are Statistical, Social, Analytics. All the content presented in this PPT design is completely editable. Download it and make adjustments in color, background, font etc. as per your unique business setting.
SHOW
- 60
- 120
- 180
DISPLAYING: 60 of 61 Item(s)
Page