AI PPT Maker
Templates
PPT Bundles
Design Services
Business PPTs
Business Plan
Management
Strategy
Introduction PPT
Roadmap
Self Introduction
Timelines
Process
Marketing
Agenda
Technology
Medical
Startup Business Plan
Cyber Security
Dashboards
SWOT
Proposals
Education
Pitch Deck
Digital Marketing
KPIs
Project Management
Product Management
Artificial Intelligence
Target Market
Communication
Supply Chain
Google Slides
Research Services
 One Pagers
All Categories
Technology Performance PowerPoint Presentation Templates and Google Slides
SHOW
- 60
- 120
- 180
DISPLAYING: 60 of 132 Item(s)
Page


Slide 1 of 12
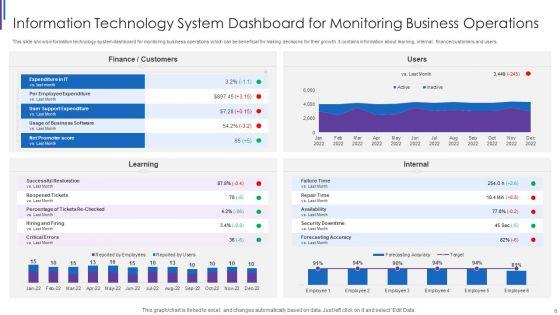
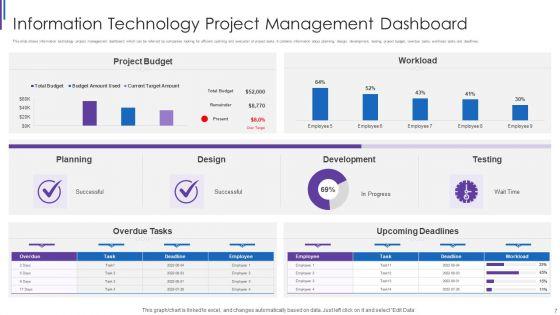
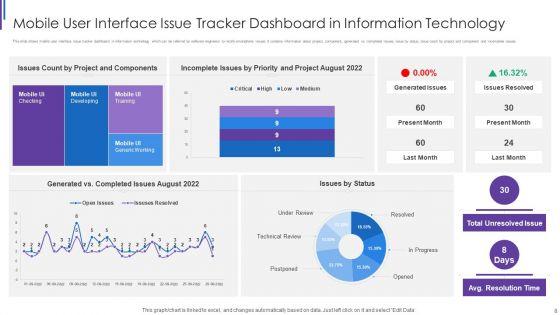
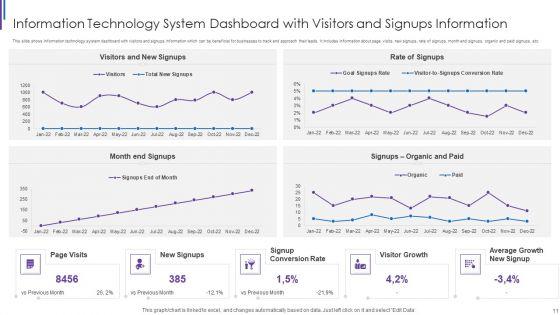
This IT Performance Dashboard Ppt PowerPoint Presentation Complete Deck With Slides acts as backup support for your ideas, vision, thoughts, etc. Use it to present a thorough understanding of the topic. This PPT slideshow can be utilized for both in-house and outside presentations depending upon your needs and business demands. Entailing twelve slides with a consistent design and theme, this template will make a solid use case. As it is intuitively designed, it suits every business vertical and industry. All you have to do is make a few tweaks in the content or any other component to design unique presentations. The biggest advantage of this complete deck is that it can be personalized multiple times once downloaded. The color, design, shapes, and other elements are free to modify to add personal touches. You can also insert your logo design in this PPT layout. Therefore a well-thought and crafted presentation can be delivered with ease and precision by downloading this IT Performance Dashboard Ppt PowerPoint Presentation Complete Deck With Slides PPT slideshow.

Slide 1 of 7
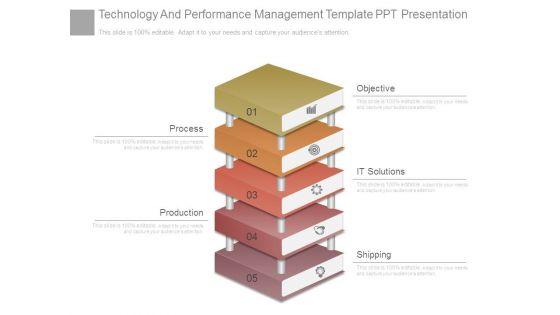
This is a technology and performance management template ppt presentation. This is a five stage process. The stages in this process are objective, process, production, it solutions, shipping.
Slide 1 of 5
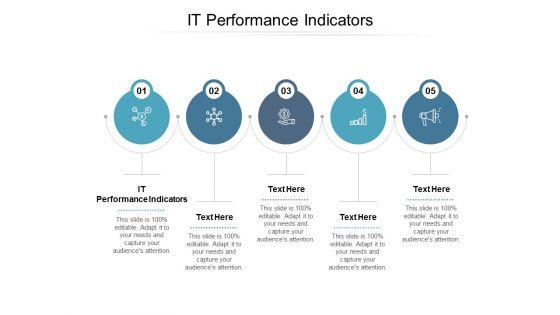
Presenting this set of slides with name it performance indicators ppt powerpoint presentation styles graphic tips cpb. This is an editable Powerpoint five stages graphic that deals with topics like it performance indicators to help convey your message better graphically. This product is a premium product available for immediate download and is 100 percent editable in Powerpoint. Download this now and use it in your presentations to impress your audience.


Slide 1 of 5
Presenting this set of slides with name it performance metrics ppt powerpoint presentation deck cpb. This is an editable Powerpoint three stages graphic that deals with topics like it performance metrics to help convey your message better graphically. This product is a premium product available for immediate download and is 100 percent editable in Powerpoint. Download this now and use it in your presentations to impress your audience.


Slide 1 of 5
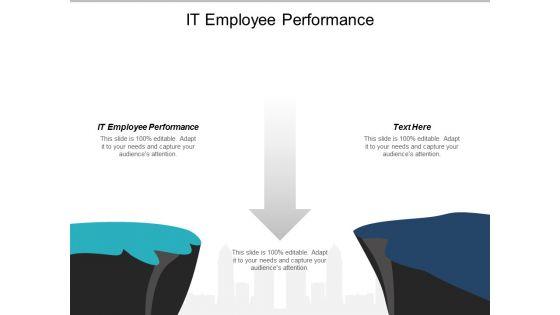
Presenting this set of slides with name it employee performance ppt powerpoint presentation gallery show cpb. This is an editable Powerpoint two stages graphic that deals with topics like it employee performance to help convey your message better graphically. This product is a premium product available for immediate download and is 100 percent editable in Powerpoint. Download this now and use it in your presentations to impress your audience.
Slide 1 of 5
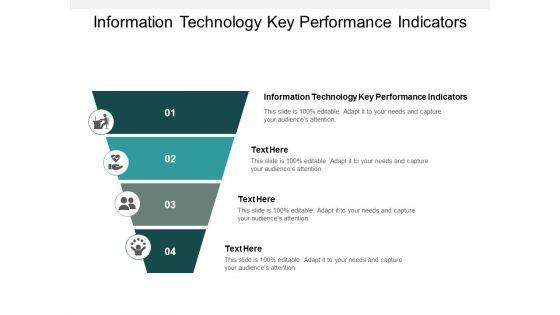
Presenting this set of slides with name information technology key performance indicators ppt powerpoint presentation infographics tips cpb. This is an editable Powerpoint four stages graphic that deals with topics like information technology key performance indicators to help convey your message better graphically. This product is a premium product available for immediate download and is 100 percent editable in Powerpoint. Download this now and use it in your presentations to impress your audience.


Slide 1 of 5
This is a technology performance management ppt powerpoint presentation infographic template aids cpb. This is a five stage process. The stages in this process are technology performance management.
Slide 1 of 3
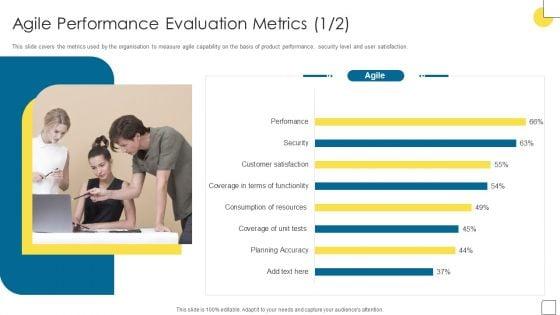
This slide covers the metrics used by the organisation to measure agile capability on the basis of product performance, security level and user satisfaction. Presenting this PowerPoint presentation, titled Agile Software Programming Module For IT Agile Performance Evaluation Metrics Diagrams PDF, with topics curated by our researchers after extensive research. This editable presentation is available for immediate download and provides attractive features when used. Download now and captivate your audience. Presenting this Agile Software Programming Module For IT Agile Performance Evaluation Metrics Diagrams PDF. Our researchers have carefully researched and created these slides with all aspects taken into consideration. This is a completely customizable Agile Software Programming Module For IT Agile Performance Evaluation Metrics Diagrams PDF that is available for immediate downloading. Download now and make an impact on your audience. Highlight the attractive features available with our PPTs.

Slide 1 of 2
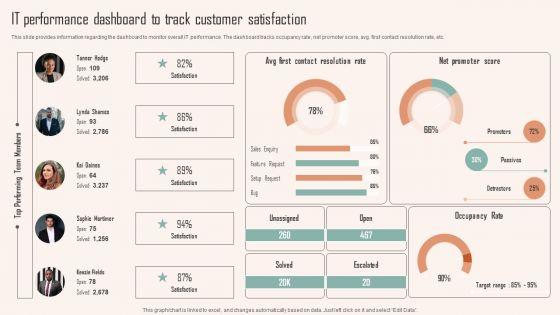
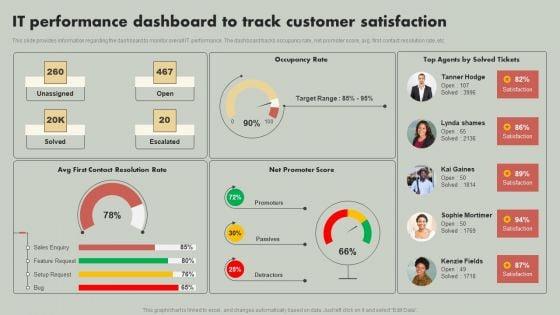
This slide provides information regarding the dashboard to monitor overall IT performance. The dashboard tracks occupancy rate, net promoter score, avg. first contact resolution rate, etc. The IT Performance Dashboard To Track Customer Satisfaction Ppt PowerPoint Presentation File Styles PDF is a compilation of the most recent design trends as a series of slides. It is suitable for any subject or industry presentation, containing attractive visuals and photo spots for businesses to clearly express their messages. This template contains a variety of slides for the user to input data, such as structures to contrast two elements, bullet points, and slides for written information. Slidegeeks is prepared to create an impression.
Slide 1 of 2
This slide provides information regarding the dashboard to monitor overall IT performance. The dashboard tracks occupancy rate, net promoter score, avg. first contact resolution rate, etc. Formulating a presentation can take up a lot of effort and time, so the content and message should always be the primary focus. The visuals of the PowerPoint can enhance the presenters message, so our IT Reducing Costs And Management Tips IT Performance Dashboard To Track Customer Satisfaction Graphics PDF was created to help save time. Instead of worrying about the design, the presenter can concentrate on the message while our designers work on creating the ideal templates for whatever situation is needed. Slidegeeks has experts for everything from amazing designs to valuable content, we have put everything into IT Reducing Costs And Management Tips IT Performance Dashboard To Track Customer Satisfaction Graphics PDF

Slide 1 of 2
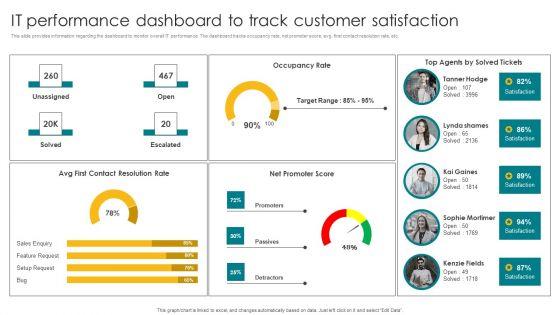
This slide provides information regarding the dashboard to monitor overall IT performance. The dashboard tracks occupancy rate, net promoter score, avg. first contact resolution rate, etc. Boost your pitch with our creative Deploying Corporate Aligned IT Strategy IT Performance Dashboard To Track Customer Satisfaction Clipart PDF. Deliver an awe inspiring pitch that will mesmerize everyone. Using these presentation templates you will surely catch everyones attention. You can browse the ppts collection on our website. We have researchers who are experts at creating the right content for the templates. So you do not have to invest time in any additional work. Just grab the template now and use them.
Slide 1 of 2
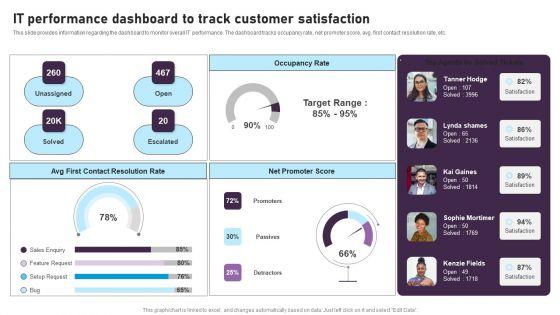
This slide provides information regarding the dashboard to monitor overall IT performance. The dashboard tracks occupancy rate, net promoter score, avg. first contact resolution rate, etc. Boost your pitch with our creative IT Performance Dashboard To Track Customer Satisfaction Elements PDF. Deliver an awe inspiring pitch that will mesmerize everyone. Using these presentation templates you will surely catch everyones attention. You can browse the ppts collection on our website. We have researchers who are experts at creating the right content for the templates. So you do not have to invest time in any additional work. Just grab the template now and use them.
Slide 1 of 2
This slide provides information regarding the dashboard to monitor overall IT performance. The dashboard tracks occupancy rate, net promoter score, avg. first contact resolution rate, etc. Crafting an eye-catching presentation has never been more straightforward. Let your presentation shine with this tasteful yet straightforward IT Performance Dashboard To Track Customer Satisfaction Designs PDF template. It offers a minimalistic and classy look that is great for making a statement. The colors have been employed intelligently to add a bit of playfulness while still remaining professional. Construct the ideal IT Performance Dashboard To Track Customer Satisfaction Designs PDF that effortlessly grabs the attention of your audience Begin now and be certain to wow your customers

Slide 1 of 2
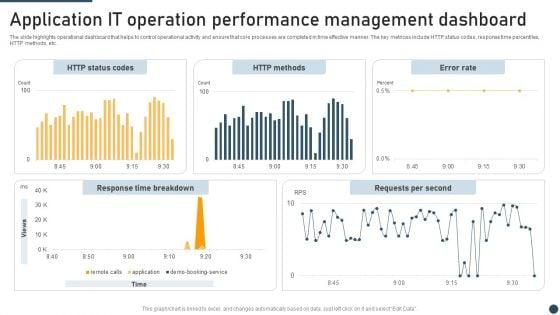
The slide highlights operational dashboard that helps to control operational activity and ensure that core processes are completed in time effective manner. The key metrices include HTTP status codes, response time percentiles, HTTP methods, etc. Showcasing this set of slides titled Application It Operation Performance Management Dashboard Themes PDF. The topics addressed in these templates are HTTP Status Codes, HTTP Methods, Error Rate. All the content presented in this PPT design is completely editable. Download it and make adjustments in color, background, font etc. as per your unique business setting.

Slide 1 of 2
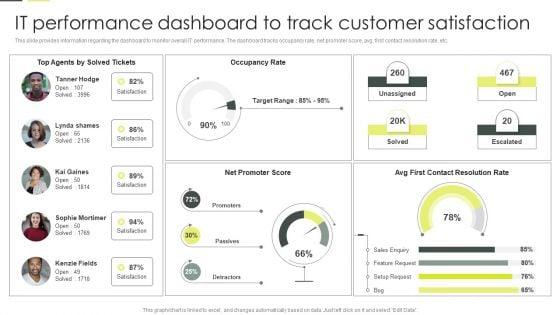
This slide provides information regarding the dashboard to monitor overall IT performance. The dashboard tracks occupancy rate, net promoter score, avg. first contact resolution rate, etc. Find a pre designed and impeccable Building An IT Strategy Plan For Business Expansion IT Performance Dashboard To Track Customer Satisfaction Download PDF. The templates can ace your presentation without additional effort. You can download these easy to edit presentation templates to make your presentation stand out from others. So, what are you waiting for Download the template from Slidegeeks today and give a unique touch to your presentation.

Slide 1 of 2
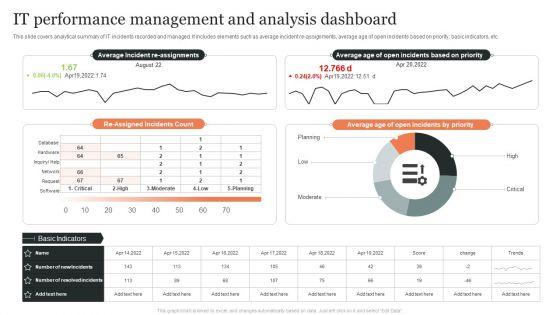
This slide covers analytical summary of IT incidents recorded and managed. It includes elements such as average incident re-assignments, average age of open incidents based on priority, basic indicators, etc. Showcasing this set of slides titled IT Performance Management And Analysis Dashboard Ppt Styles Portrait PDF. The topics addressed in these templates are Average Age, Open Incidents Priority, Re Assigned, Incidents Count. All the content presented in this PPT design is completely editable. Download it and make adjustments in color, background, font etc. as per your unique business setting.

Slide 1 of 2
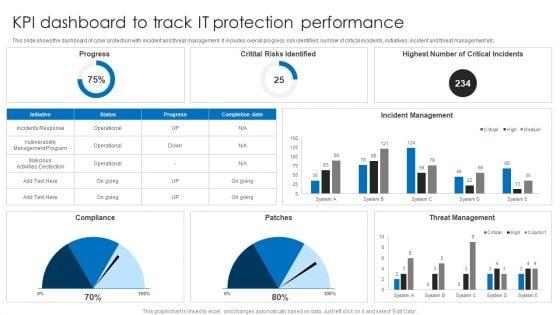
This slide shows the dashboard of cyber protection with incident and threat management. It includes overall progress, risk identified, number of critical incidents, initiatives, incident and threat management etc. Pitch your topic with ease and precision using this KPI Dashboard To Track IT Protection Performance Elements PDF. This layout presents information on Incident Management, Threat Management, Critital Risks Identified. It is also available for immediate download and adjustment. So, changes can be made in the color, design, graphics or any other component to create a unique layout.


Slide 1 of 2
Presenting you an exemplary One Pager IT Department Performance Improvement Plan PDF Document PPT Template. Our one-pager template comprises all the must-have essentials of an inclusive document. You can edit it with ease, as its layout is completely editable. With such freedom, you can tweak its design and other elements to your requirements. Download this One Pager IT Department Performance Improvement Plan PDF Document PPT Template Download now.
Slide 1 of 2
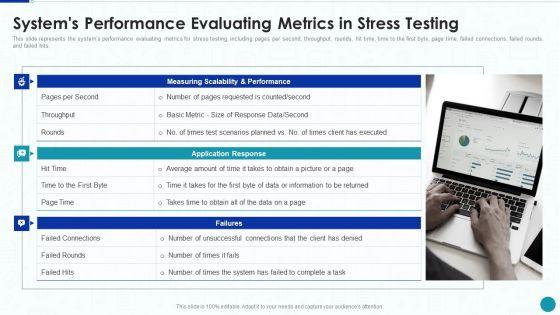
This slide represents the systems performance evaluating metrics for stress testing, including pages per second, throughput, rounds, hit time, time to the first byte, page time, failed connections, failed rounds, and failed hits. Presenting Compliance Testing IT Systems Performance Evaluating Metrics In Stress Testing Background PDF to provide visual cues and insights. Share and navigate important information on three stages that need your due attention. This template can be used to pitch topics like Data Or Information, Basic Metric, Measuring Scalability. In addtion, this PPT design contains high resolution images, graphics, etc, that are easily editable and available for immediate download.

Slide 1 of 2
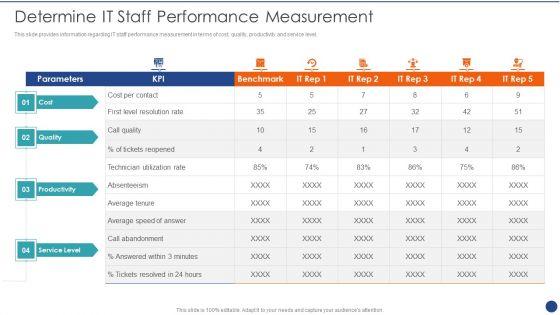
This slide provides information regarding IT staff performance measurement in terms of cost, quality, productivity and service level. Deliver an awe inspiring pitch with this creative Cios Methodologies To Improve IT Spending Determine It Staff Performance Measurement Designs PDF bundle. Topics like Reserved Instances, Pricing Recommendations, Running Instances can be discussed with this completely editable template. It is available for immediate download depending on the needs and requirements of the user.
Slide 1 of 2
This slide provides information regarding IT staff performance measurement in terms of cost, quality, productivity and service level. Deliver an awe inspiring pitch with this creative Cios Value Optimization Determine IT Staff Performance Measurement Diagrams PDF bundle. Topics like Parameters KPI, Cost Per, Service Level can be discussed with this completely editable template. It is available for immediate download depending on the needs and requirements of the user.


Slide 1 of 2
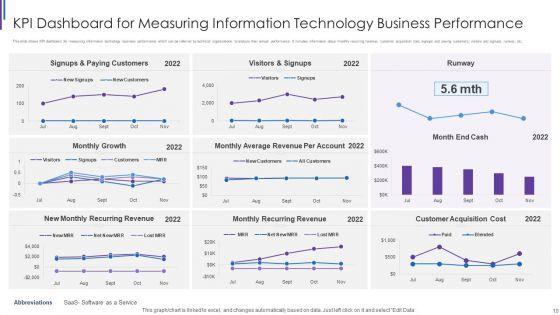
This slide shows KPI dashboard for measuring information technology business performance which can be referred by technical organizations to analyze their annual performance. It includes information about monthly recurring revenue, customer acquisition cost, signups and paying customers, visitors and signups, runway, etc. Showcasing this set of slides titled KPI Dashboard For Measuring Information Technology Business Performance Designs PDF. The topics addressed in these templates are Signups And Paying, Customers Monthly Growth, Visitors And Signups, Monthly Average Revenue. All the content presented in this PPT design is completely editable. Download it and make adjustments in color, background, font etc. as per your unique business setting.
Slide 1 of 2
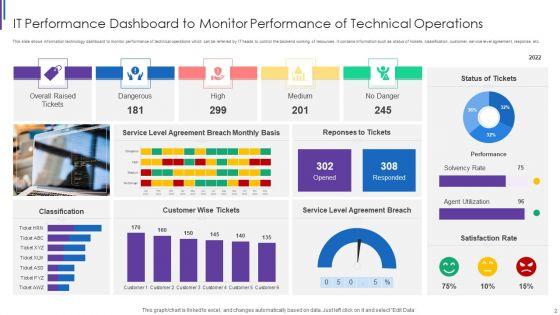
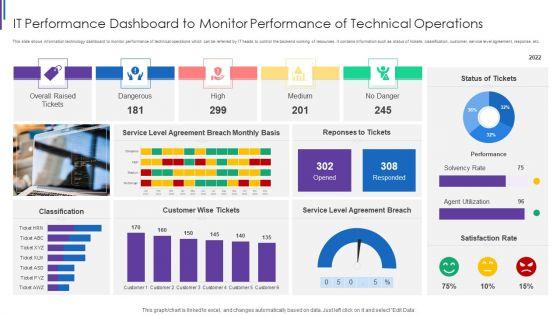
This slide shows information technology dashboard to monitor performance of technical operations which can be referred by IT heads to control the backend working of resources. It contains information such as status of tickets, classification, customer, service level agreement, response, etc. Showcasing this set of slides titled IT Performance Dashboard To Monitor Performance Of Technical Operations Download PDF. The topics addressed in these templates are Overall Raised Tickets, Dangerous High Medium, Service Level Agreement, Customer Wise Tickets. All the content presented in this PPT design is completely editable. Download it and make adjustments in color, background, font etc. as per your unique business setting.

Slide 1 of 2
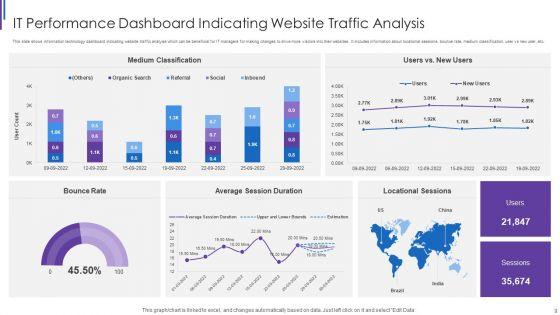
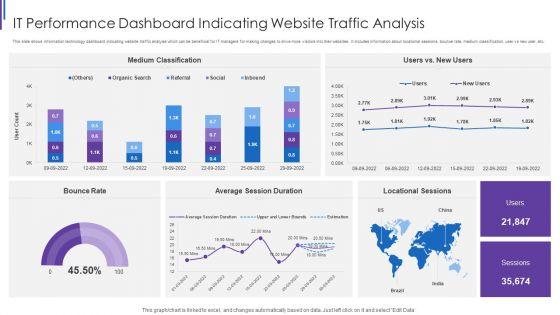
This slide shows information technology dashboard indicating website traffic analysis which can be beneficial for IT managers for making changes to drive more visitors into their websites. It includes information about locational sessions, bounce rate, medium classification, user vs new user, etc. Pitch your topic with ease and precision using this IT Performance Dashboard Indicating Website Traffic Analysis Background PDF. This layout presents information on Medium Classification Rate, Average Session Duration, Locational Sessions Bounce. It is also available for immediate download and adjustment. So, changes can be made in the color, design, graphics or any other component to create a unique layout.

Slide 1 of 2
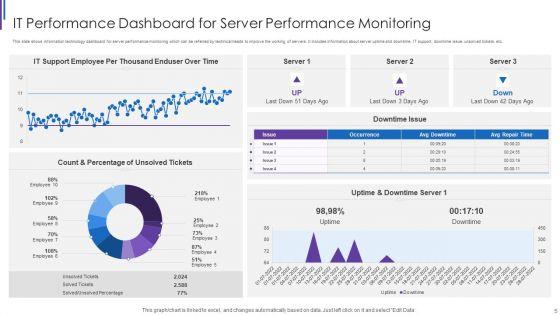
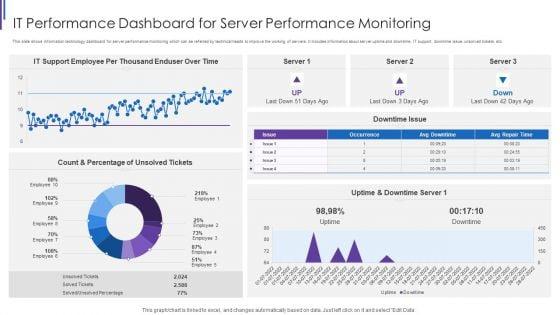
This slide shows information technology dashboard for server performance monitoring which can be referred by technical heads to improve the working of servers. It includes information about server uptime and downtime, IT support, downtime issue, unsolved tickets, etc. Showcasing this set of slides titled IT Performance Dashboard For Server Performance Monitoring Portrait PDF. The topics addressed in these templates are IT Support Employee, Per Thousand Enduser, Uptime And Downtime, Count And Percentage. All the content presented in this PPT design is completely editable. Download it and make adjustments in color, background, font etc. as per your unique business setting.

Slide 1 of 2
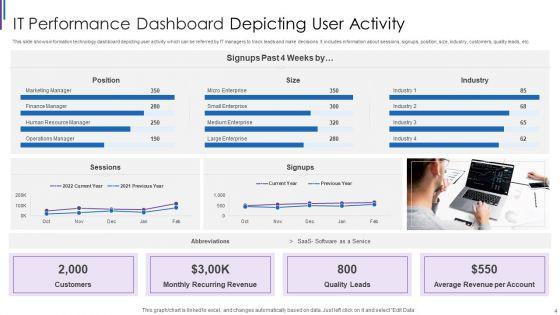
This slide shows information technology dashboard depicting user activity which can be referred by IT managers to track leads and make decisions. It includes information about sessions, signups, position, size, industry, customers, quality leads, etc. Pitch your topic with ease and precision using this IT Performance Dashboard Depicting User Activity Inspiration PDF. This layout presents information on Monthly Recurring Revenue, Average Revenue Per, Account Quality Leads, Customers Position Sessions. It is also available for immediate download and adjustment. So, changes can be made in the color, design, graphics or any other component to create a unique layout.
Slide 1 of 2
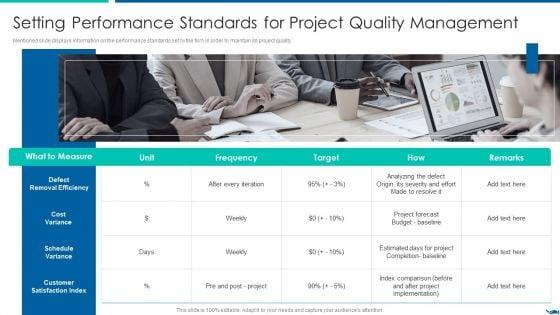
Mentioned slide displays information on the performance standards set by the firm in order to maintain its project quality. This is a Project QA Through Agile Methodology IT Setting Performance Standards Inspiration PDF template with various stages. Focus and dispense information on one stage using this creative set, that comes with editable features. It contains large content boxes to add your information on topics like Defect Removal Efficiency, Cost Variance, Schedule Variance. You can also showcase facts, figures, and other relevant content using this PPT layout. Grab it now.
Slide 1 of 2
Persuade your audience using this managing time technology for performance measurement icon ppt powerpoint presentation file visuals pdf. This PPT design covers three stages, thus making it a great tool to use. It also caters to a variety of topics including managing time technology for performance measurement icon. Download this PPT design now to present a convincing pitch that not only emphasizes the topic but also showcases your presentation skills.
Slide 1 of 2
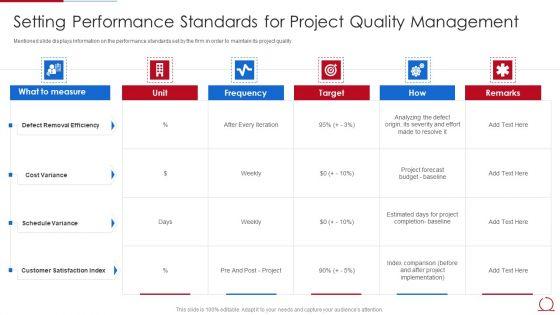
Mentioned slide displays information on the performance standards set by the firm in order to maintain its project quality. Deliver an awe inspiring pitch with this creative quality assurance model for agile it setting performance standards for project quality diagrams pdf bundle. Topics like defect removal efficiency, cost variance, schedule variance, customer satisfaction index can be discussed with this completely editable template. It is available for immediate download depending on the needs and requirements of the user.
Slide 1 of 2
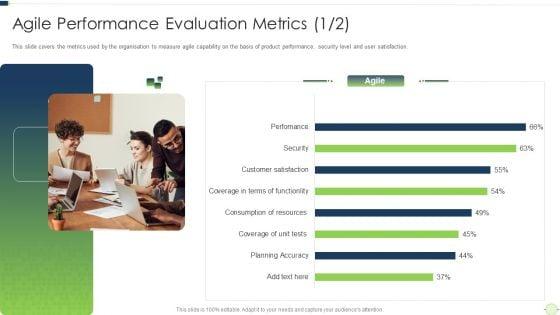
This slide covers the metrics used by the organisation to measure agile capability on the basis of product performance, security level and user satisfaction. Deliver an awe inspiring pitch with this creative agile software programming module for information technology agile performance evaluation infographics pdf bundle. Topics like agile performance evaluation metrics can be discussed with this completely editable template. It is available for immediate download depending on the needs and requirements of the user.
Slide 1 of 2
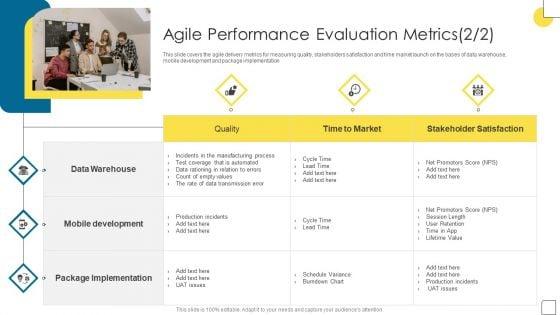
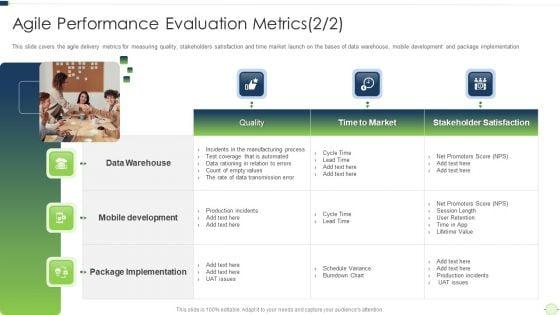
This slide covers the agile delivery metrics for measuring quality, stakeholders satisfaction and time market launch on the bases of data warehouse, mobile development and package implementation. This is a agile software programming module for information technology agile performance evaluation metrics infographics pdf template with various stages. Focus and dispense information on three stages using this creative set, that comes with editable features. It contains large content boxes to add your information on topics like time to market, mobile development, package implementation. You can also showcase facts, figures, and other relevant content using this PPT layout. Grab it now.

Slide 1 of 2
Presenting memcache technology it unmatched performance at any scale after memcache cache microsoft pdf to provide visual cues and insights. Share and navigate important information on three stages that need your due attention. This template can be used to pitch topics like performance, resources, requirements. In addtion, this PPT design contains high resolution images, graphics, etc, that are easily editable and available for immediate download.
Slide 1 of 2
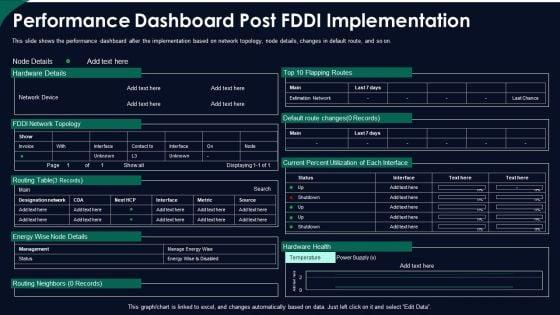
This slide shows the performance dashboard after the implementation based on network topology, node details, changes in default route, and so on. Deliver an awe inspiring pitch with this creative fddi network standard it performance dashboard post fddi implementation ppt slides background pdf bundle. Topics like performance dashboard post fddi implementation can be discussed with this completely editable template. It is available for immediate download depending on the needs and requirements of the user.


Slide 1 of 2
This slide depicts performance memory and activity metrics dashboard for Redis cache, including cache hit ratio, slow log, latency, used memory, etc. This is a redis cache data structure it performance memory and activity metrics introduction pdf template with various stages. Focus and dispense information on one stages using this creative set, that comes with editable features. It contains large content boxes to add your information on topics like performance memory and activity metrics dashboard for redis cache. You can also showcase facts, figures, and other relevant content using this PPT layout. Grab it now.

Slide 1 of 2
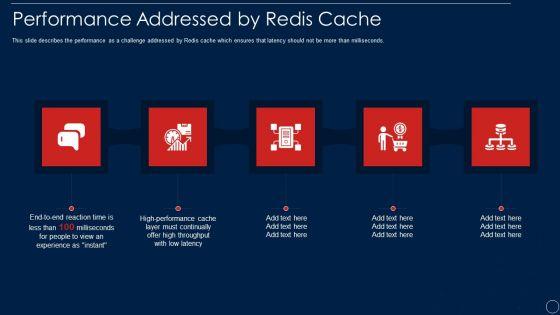
This slide describes the performance as a challenge addressed by Redis cache which ensures that latency should not be more than milliseconds. Presenting redis cache data structure it performance addressed by redis cache themes pdf to provide visual cues and insights. Share and navigate important information on five stages that need your due attention. This template can be used to pitch topics like performance addressed by redis cache. In addtion, this PPT design contains high resolution images, graphics, etc, that are easily editable and available for immediate download.
Slide 1 of 2
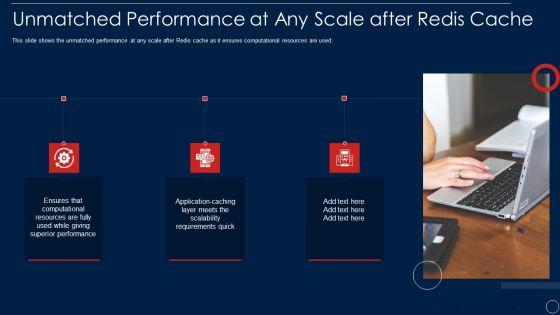
This slide shows the unmatched performance at any scale after Redis cache as it ensures computational resources are used. This is a redis cache data structure it unmatched performance at any scale after redis cache summary pdf template with various stages. Focus and dispense information on three stages using this creative set, that comes with editable features. It contains large content boxes to add your information on topics like resources, performance, requirements, application. You can also showcase facts, figures, and other relevant content using this PPT layout. Grab it now.
Slide 1 of 2
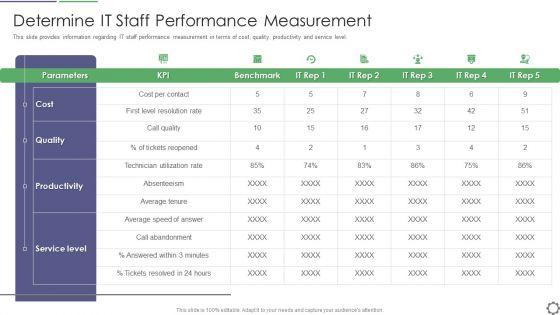
This slide provides information regarding IT staff performance measurement in terms of cost, quality, productivity and service level. Deliver an awe inspiring pitch with this creative determine it staff performance measurement ppt powerpoint presentation file infographics pdf bundle. Topics like quality, service level, productivity can be discussed with this completely editable template. It is available for immediate download depending on the needs and requirements of the user.
Slide 1 of 2
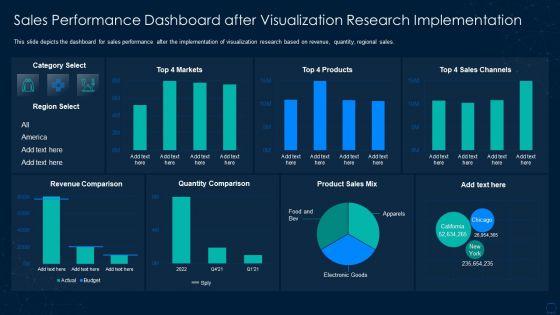
This slide depicts the dashboard for sales performance after the implementation of visualization research based on revenue, quantity, regional sales. Deliver and pitch your topic in the best possible manner with this graphical representation of research it sales performance dashboard sample pdf. Use them to share invaluable insights on sales performance dashboard after visualization research implementation and impress your audience. This template can be altered and modified as per your expectations. So, grab it now.

Slide 1 of 2
This slide covers the agile delivery metrics for measuring quality, stakeholders satisfaction and time market launch on the bases of data warehouse, mobile development and package implementation. Deliver and pitch your topic in the best possible manner with this agile methodology in project management it agile performance evaluation metrics quality slides pdf. Use them to share invaluable insights on data warehouse, mobile development, package implementation and impress your audience. This template can be altered and modified as per your expectations. So, grab it now.
Slide 1 of 2
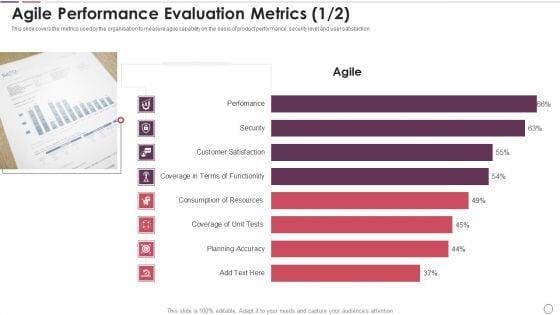
This slide covers the metrics used by the organisation to measure agile capability on the basis of product performance, security level and user satisfaction. Deliver an awe inspiring pitch with this creative agile methodology in project management it agile performance evaluation metrics agile clipart pdf bundle. Topics like agile performance evaluation metrics can be discussed with this completely editable template. It is available for immediate download depending on the needs and requirements of the user.


Slide 1 of 2
This slide provides the glimpse about the one day performance covering different cycles such as project charter, iteration, day, integration and episode. Deliver an awe inspiring pitch with this creative scrum crystal xp development it performance of different activities under various cycles microsoft pdf bundle. Topics like plan, design, project charter can be discussed with this completely editable template. It is available for immediate download depending on the needs and requirements of the user.
Slide 1 of 2
This template covers DevOps assessment key performance indicators such as activity by application, storefront users, revenue by hours etc. Deliver an awe inspiring pitch with this creative development and operations kpi dashboard it devops performance kpi dashboard icons pdf bundle. Topics like revenue, service can be discussed with this completely editable template. It is available for immediate download depending on the needs and requirements of the user.


Slide 1 of 2
This slide provides the glimpse about the project performance review along with budget, earned and actual values along with cost, schedule and performance index. Deliver an awe inspiring pitch with this creative project management modelling techniques it project performance review information pdf bundle. Topics like budget, earned, actual, cost, schedule, performance index can be discussed with this completely editable template. It is available for immediate download depending on the needs and requirements of the user.

Slide 1 of 2
This slide covers the metrics used by the organisation to measure agile capability on the basis of product performance, security level and user satisfaction. Deliver an awe inspiring pitch with this creative agile approach in it agile performance evaluation metrics accuracy clipart pdf bundle. Topics like performance, security level, user satisfaction, planning accuracy, consumptions of resources can be discussed with this completely editable template. It is available for immediate download depending on the needs and requirements of the user.


Slide 1 of 2
This slide covers the agile delivery metrics for measuring quality, stakeholders satisfaction and time market launch on the bases of data warehouse, mobile development and package implementation. Deliver and pitch your topic in the best possible manner with this agile approach in it agile performance evaluation metrics warehouse ppt pictures example introduction pdf. Use them to share invaluable insights on data warehouse, mobile development, package implementation and impress your audience. This template can be altered and modified as per your expectations. So, grab it now.
Slide 1 of 2
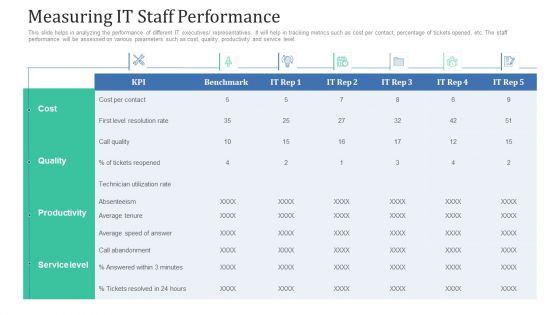
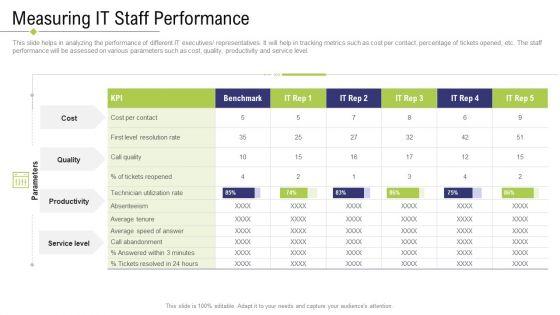
This slide helps in analyzing the performance of different IT executives representatives. It will help in tracking metrics such as cost per contact, percentage of tickets opened, etc. The staff performance will be assessed on various parameters such as cost, quality, productivity and service level. Deliver an awe-inspiring pitch with this creative retaining clients improving information technology facilities measuring it staff performance designs pdf bundle. Topics like cost, quality, productivity, service level can be discussed with this completely editable template. It is available for immediate download depending on the needs and requirements of the user.

Slide 1 of 2
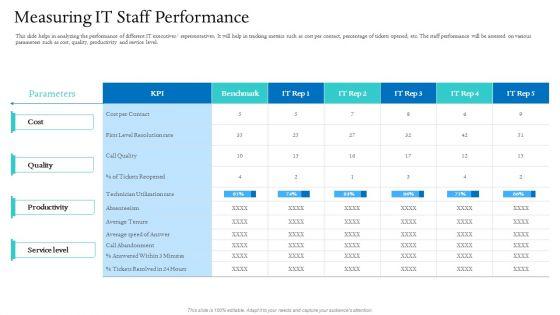
This slide helps in analyzing the performance of different IT executives representatives. It will help in tracking metrics such as cost per contact, percentage of tickets opened, etc. The staff performance will be assessed on various parameters such as cost, quality, productivity and service level. Deliver an awe inspiring pitch with this creative technology facility maintenance and provider measuring IT staff performance guidelines pdf bundle. Topics like cost per contact, parameters, productivity, service level, technician utilization rate can be discussed with this completely editable template. It is available for immediate download depending on the needs and requirements of the user.
Slide 1 of 2
This slide helps in analyzing the performance of different IT executives or representatives. It will help in tracking metrics such as cost per contact, percentage of tickets opened, etc. The staff performance will be assessed on various parameters such as cost, quality, productivity and service level. Deliver an awe-inspiring pitch with this creative impeccable information technology facility measuring it staff performance ppt icon design templates pdf bundle. Topics like service level, productivity, quality, cost can be discussed with this completely editable template. It is available for immediate download depending on the needs and requirements of the user.
Slide 1 of 2
This slide helps in analyzing the performance of different IT executives representatives. It will help in tracking metrics such as cost per contact, percentage of tickets opened, etc. The staff performance will be assessed on various parameters such as cost, quality, productivity and service level. Deliver and pitch your topic in the best possible manner with this information technology facilities governance measuring IT staff performance ppt infographic template graphics download pdf. Use them to share invaluable insights on cost per contact, productivity, service level, technician, parameters and impress your audience. This template can be altered and modified as per your expectations. So, grab it now.


Slide 1 of 2
This slide helps in analyzing the performance of different IT executives or representatives. It will help in tracking metrics such as cost per contact, percentage of tickets opened, etc. The staff performance will be assessed on various parameters such as cost, quality, productivity and service level. Deliver an awe-inspiring pitch with this creative information technology facility flow administration measuring it staff performance structure pdf bundle. Topics like cost, quality, productivity, service level can be discussed with this completely editable template. It is available for immediate download depending on the needs and requirements of the user.

Slide 1 of 2
Deliver an awe inspiring pitch with this creative marketing technology stack performance measurement kpis professional pdf bundle. Topics like performance metrics, digital advertisement, average response time, technology types can be discussed with this completely editable template. It is available for immediate download depending on the needs and requirements of the user.
Slide 1 of 2
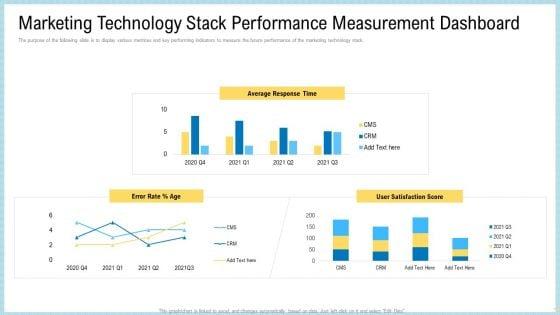
The purpose of the following slide is to display various metrices and key performing indicators to measure the future performance of the marketing technology stack. Deliver and pitch your topic in the best possible manner with this marketing technology stack performance measurement dashboard demonstration pdf. Use them to share invaluable insights on average response time, user satisfaction score, error rate and impress your audience. This template can be altered and modified as per your expectations. So, grab it now.

Slide 1 of 2
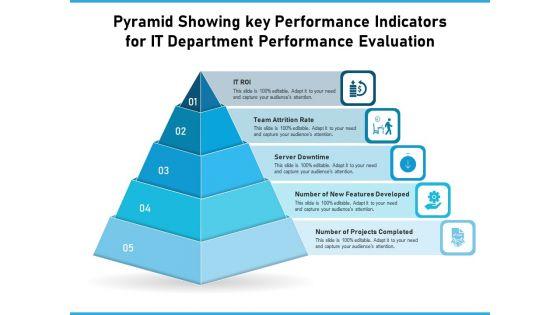
Persuade your audience using this pyramid showing key performance indicators for it department performance evaluation ppt powerpoint presentation show graphics design pdf. This PPT design covers five stages, thus making it a great tool to use. It also caters to a variety of topics including it roi, team attrition rate, server downtime, number of new features developed, number of projects completed. Download this PPT design now to present a convincing pitch that not only emphasizes the topic but also showcases your presentation skills.

Slide 1 of 2
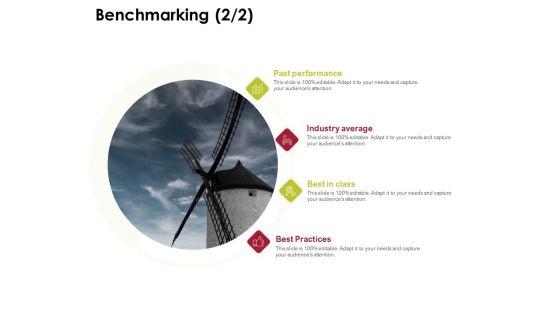
Presenting this set of slides with name power management system and technology benchmarking performance rules pdf. The topics discussed in these slides are past performance, industry average, best in class, best practices. This is a completely editable PowerPoint presentation and is available for immediate download. Download now and impress your audience.
Slide 1 of 2
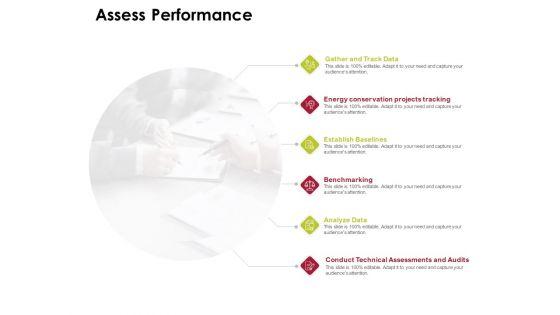
Presenting this set of slides with name power management system and technology assess performance diagrams pdf. This is a six stage process. The stages in this process are gather and track data, energy conservation projects tracking, establish baselines, benchmarking, analyze data, conduct technical assessments and audits. This is a completely editable PowerPoint presentation and is available for immediate download. Download now and impress your audience.

Slide 1 of 2
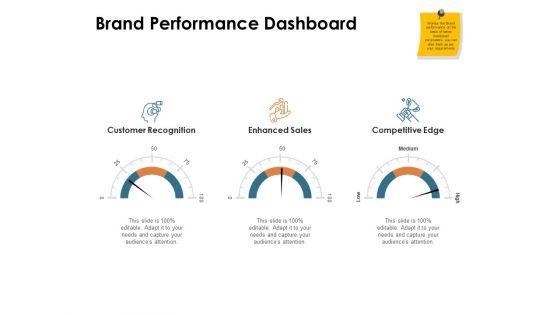
Presenting this set of slides with name brand identity how build it brand performance dashboard ppt professional mockup pdf. This is a three stage process. The stages in this process are customer recognition, enhanced sales, competitive edge. This is a completely editable PowerPoint presentation and is available for immediate download. Download now and impress your audience.

Slide 1 of 2
Presenting this set of slides with name itil strategy service excellence measuring it staff performance cost ppt powerpoint presentation file background image pdf. The topics discussed in these slides are cost, quality, productivity, service level. This is a completely editable PowerPoint presentation and is available for immediate download. Download now and impress your audience.


Slide 1 of 9
This slide provides information regarding a roadmap to track initiatives that support business goals and enhance IT performance. Key focus areas include business assistance, IT excellence, innovation. Do you have to make sure that everyone on your team knows about any specific topic I yes, then you should give Roadmap To Monitor Strategies Assisting Business Objectives And Enhance IT Performance Ppt PowerPoint Presentation File Professional PDF a try. Our experts have put a lot of knowledge and effort into creating this impeccable Roadmap To Monitor Strategies Assisting Business Objectives And Enhance IT Performance Ppt PowerPoint Presentation File Professional PDF. You can use this template for your upcoming presentations, as the slides are perfect to represent even the tiniest detail. You can download these templates from the Slidegeeks website and these are easy to edit. So grab these today.

Slide 1 of 1
This slide provides information regarding a roadmap to track initiatives that support business goals and enhance IT performance. Key focus areas include business assistance, IT excellence, innovation. If your project calls for a presentation, then Slidegeeks is your go to partner because we have professionally designed, easy to edit templates that are perfect for any presentation. After downloading, you can easily edit Roadmap To Monitor Strategies Assisting Business Objectives And Enhance IT Performance Pictures PDF and make the changes accordingly. You can rearrange slides or fill them with different images. Check out all the handy templates.


Slide 1 of 9
This slide provides information regarding a roadmap to track initiatives that support business goals and enhance IT performance. Key focus areas include business assistance, IT excellence, innovation. Retrieve professionally designed Roadmap To Monitor Strategies Assisting Business Objectives And Enhance IT Enhance IT Performance Structure PDF to effectively convey your message and captivate your listeners. Save time by selecting pre-made slideshows that are appropriate for various topics, from business to educational purposes. These themes come in many different styles, from creative to corporate, and all of them are easily adjustable and can be edited quickly. Access them as PowerPoint templates or as Google Slides themes. You do not have to go on a hunt for the perfect presentation because Slidegeeks got you covered from everywhere.
SHOW
- 60
- 120
- 180
DISPLAYING: 60 of 132 Item(s)
Page
