AI PPT Maker
Templates
PPT Bundles
Design Services
Business PPTs
Business Plan
Management
Strategy
Introduction PPT
Roadmap
Self Introduction
Timelines
Process
Marketing
Agenda
Technology
Medical
Startup Business Plan
Cyber Security
Dashboards
SWOT
Proposals
Education
Pitch Deck
Digital Marketing
KPIs
Project Management
Product Management
Artificial Intelligence
Target Market
Communication
Supply Chain
Google Slides
Research Services
 One Pagers
All Categories
Two years comparison charts PowerPoint Presentation Templates and Google Slides
2 Item(s)
Slide 1 of 2
Persuade your audience using this Chart Illustrating Two Year Comparison Of Business Data Icon Ppt Outline Example Topics PDF. This PPT design covers three stages, thus making it a great tool to use. It also caters to a variety of topics including chart illustrating two year comparison of business data icon. Download this PPT design now to present a convincing pitch that not only emphasizes the topic but also showcases your presentation skills.


Slide 1 of 10
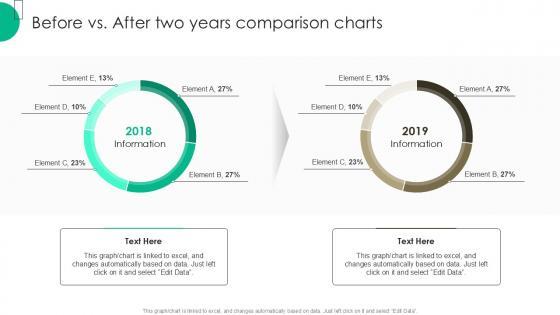
Retrieve professionally designed Before Vs After Two Years Comparison Charts PPT Sample SS to effectively convey your message and captivate your listeners. Save time by selecting pre-made slideshows that are appropriate for various topics, from business to educational purposes. These themes come in many different styles, from creative to corporate, and all of them are easily adjustable and can be edited quickly. Access them as PowerPoint templates or as Google Slides themes. You do not have to go on a hunt for the perfect presentation because Slidegeeks got you covered from everywhere. Our Before Vs After Two Years Comparison Charts PPT Sample SS are topically designed to provide an attractive backdrop to any subject. Use them to look like a presentation pro.
2 Item(s)
