AI PPT Maker
Templates
PPT Bundles
Design Services
Business PPTs
Business Plan
Management
Strategy
Introduction PPT
Roadmap
Self Introduction
Timelines
Process
Marketing
Agenda
Technology
Medical
Startup Business Plan
Cyber Security
Dashboards
SWOT
Proposals
Education
Pitch Deck
Digital Marketing
KPIs
Project Management
Product Management
Artificial Intelligence
Target Market
Communication
Supply Chain
Google Slides
Research Services
 One Pagers
All Categories
Visual Dashboards PowerPoint Presentation Templates and Google Slides
4 Item(s)




Slide 1 of 7
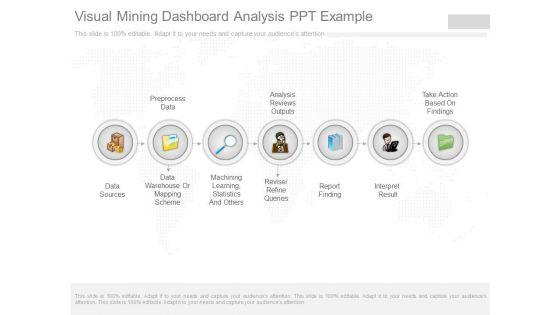
This is a visual mining dashboard analysis ppt example. This is a seven stage process. The stages in this process are data sources, preprocess data, data warehouse or mapping scheme, machining learning, statistics and others, analysis reviews outputs, revise refine queries, report finding, interpret result, take action based on findings.
Slide 1 of 4
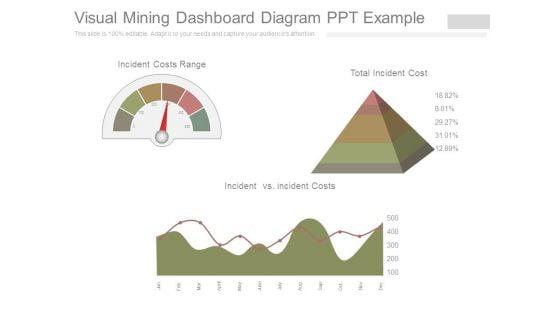
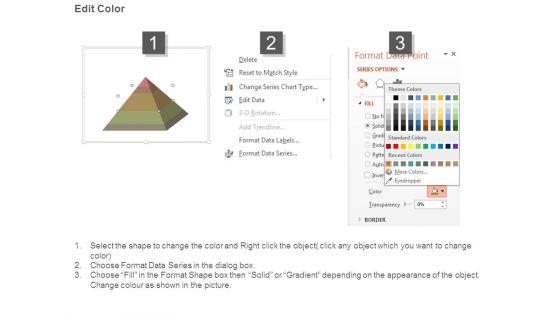
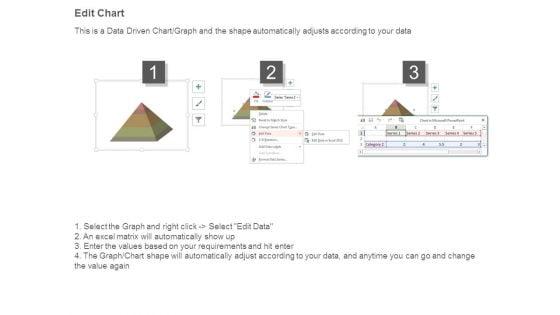
This is a visual mining dashboard diagram ppt example. This is a three stage process. The stages in this process are incident costs range, incident vs incident costs, total incident cost.


Slide 1 of 4
This is a project status visual dashboard indicator ppt images gallery. This is a four stage process. The stages in this process are business, marketing, dashboard, measure, presentation.
Slide 1 of 2
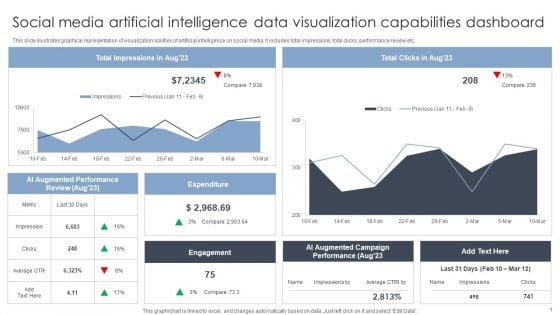
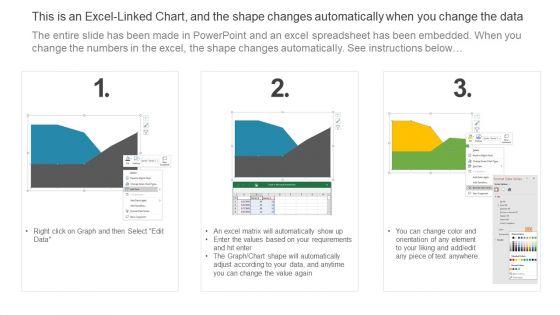
This slide illustrates graphical representation of visualization abilities of artificial intelligence on social media. It includes total impressions, total clicks, performance review etc. Pitch your topic with ease and precision using this Social Media Artificial Intelligence Data Visualization Capabilities Dashboard Inspiration PDF. This layout presents information on Artificial Intelligence, Data Visualization Capabilities. It is also available for immediate download and adjustment. So, changes can be made in the color, design, graphics or any other component to create a unique layout.
4 Item(s)
