AI PPT Maker
Templates
PPT Bundles
Design Services
Business PPTs
Business Plan
Management
Strategy
Introduction PPT
Roadmap
Self Introduction
Timelines
Process
Marketing
Agenda
Technology
Medical
Startup Business Plan
Cyber Security
Dashboards
SWOT
Proposals
Education
Pitch Deck
Digital Marketing
KPIs
Project Management
Product Management
Artificial Intelligence
Target Market
Communication
Supply Chain
Google Slides
Research Services
 One Pagers
All Categories
Visual Information PowerPoint Presentation Templates and Google Slides
15 Item(s)


Slide 1 of 4
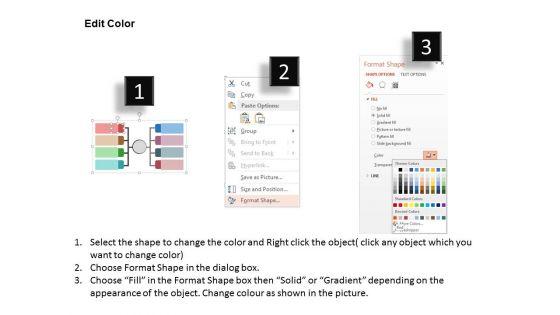
Develop competitive advantage with our above template which contains graphics of connected banners. This diagram provides an effective way of displaying business information. You can edit text, color, shade and style as per you need.


Slide 1 of 3
This power point template contains diagram of tags infographic. Download this PPT diagram slide to display business information visually. Make outstanding presentation by using this creative diagram.


Slide 1 of 3
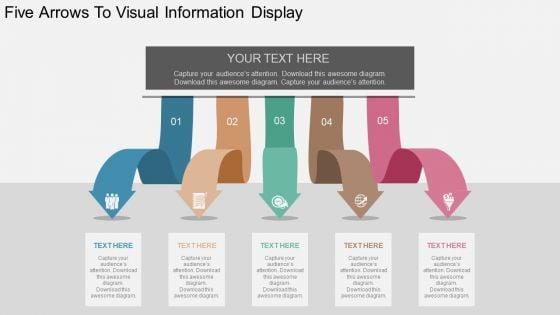
Develop competitive advantage with our above template which contains a five arrows steps diagram. This diagram provides an effective way of displaying business information. You can edit text, color, shade and style as per you need.
Slide 1 of 3
Define your ideas in a unique and inspiring manner using this diagram which contains a graphic of five arrows. This pre-designed and appealing arrows design offers an optimized possibility to illustrate your business strategy.
Slide 1 of 3
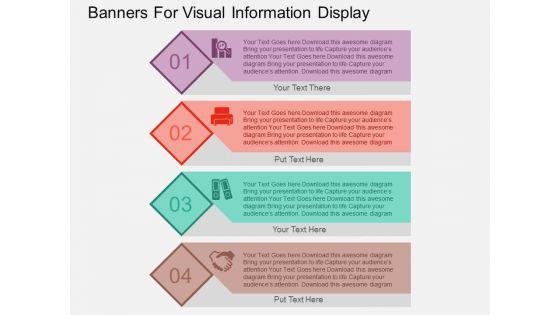
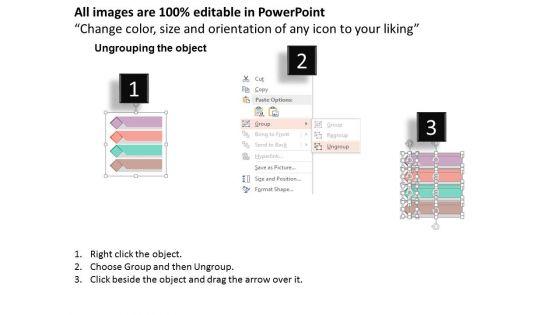
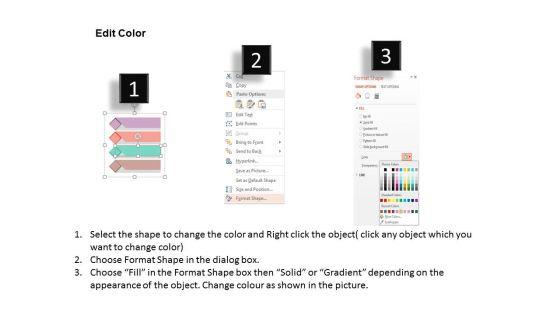
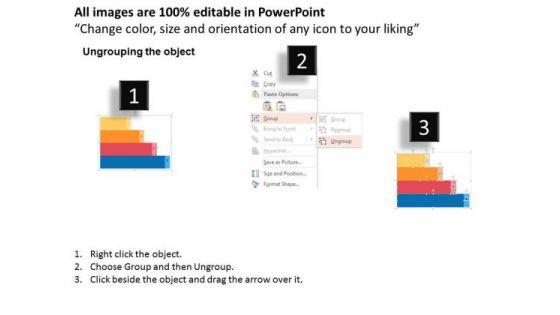
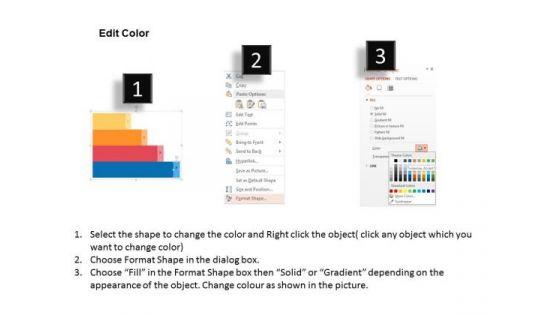
This business diagram has been designed with diagram of four banners infographic. Download this slide to portray concept of management strategy for success. This diagram can be used for visual information display in any presentation.
Slide 1 of 3
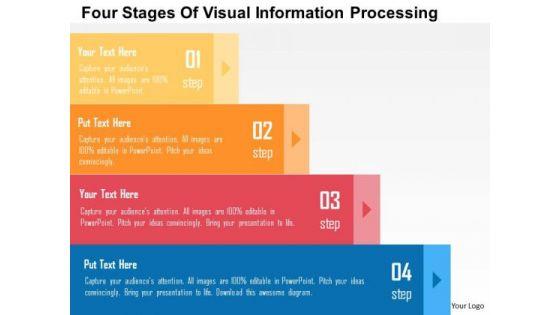
This business slide displays four text boxes. Download this diagram to display information in visual manner. This template is innovatively designed to highlight your worthy views


Slide 1 of 3
This business power point template is designed with unique network diagram. This business diagram is useful to display visual information for any business process. Use this template for professional approach.


Slide 1 of 3
Open Up Doors That Lead To Success. Our Business Diagram Visual Information PowerPoint PPT Presentation Powerpoint Templates Provide The Handles. Opportunity Will Come Knocking At Your Door. Welcome It With Our Business Powerpoint Templates.


Slide 1 of 2
This template depicts that by incorporating high quality visual content into social media marketing strategy, the company can earn more engagement, more shares, and more followers from the target audience. Presenting Playbook For Social Media Channel Content Format Guidelines Visual Content Information PDF to provide visual cues and insights. Share and navigate important information on four stages that need your due attention. This template can be used to pitch topics like Designed Elements, Infographics, Sources. In addtion, this PPT design contains high resolution images, graphics, etc, that are easily editable and available for immediate download.


Slide 1 of 2
This slide explains information visualization as a branch of visualization research that includes visuals like histograms, trend graphs, flow charts.Presenting Departments Of Visualization Research Information Visualization Research Branch Clipart PDF to provide visual cues and insights. Share and navigate important information on four stages that need your due attention. This template can be used to pitch topics like Interactive Visual, Representations Of Abstract, Information In addtion, this PPT design contains high resolution images, graphics, etc, that are easily editable and available for immediate download.


Slide 1 of 2
Presenting Table Of Contents For Departments Of Visualization Research Information PDF to provide visual cues and insights. Share and navigate important information on one stage that need your due attention. This template can be used to pitch topics like Tools And Software, Visualization , Tableau As Visualization In addtion, this PPT design contains high resolution images, graphics, etc, that are easily editable and available for immediate download.


Slide 1 of 2
This slide shows visual analytics, the last branch of visualization research, which emerged from the advancements in the other two branches and mainly focused on analytical reasoning.Presenting Departments Of Visualization Research Visual Analytics Branch Of Visualization Research Information PDF to provide visual cues and insights. Share and navigate important information on five stages that need your due attention. This template can be used to pitch topics like Information Visualization, Advancements In Scientific, Interactive Visual Interface In addtion, this PPT design contains high resolution images, graphics, etc, that are easily editable and available for immediate download.
Slide 1 of 2
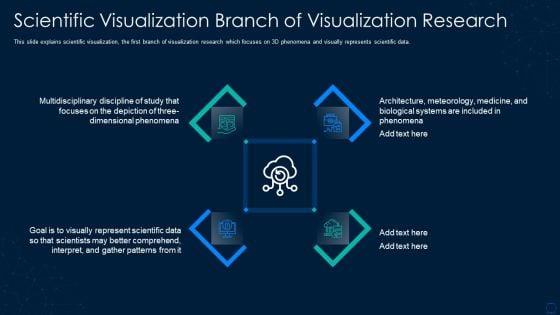
This slide explains scientific visualization, the first branch of visualization research which focuses on 3D phenomena and visually represents scientific data. This is a graphical representation of research it scientific visualization branch information pdf template with various stages. Focus and dispense information on four stages using this creative set, that comes with editable features. It contains large content boxes to add your information on topics like scientific visualization branch of visualization research. You can also showcase facts, figures, and other relevant content using this PPT layout. Grab it now.
Slide 1 of 2
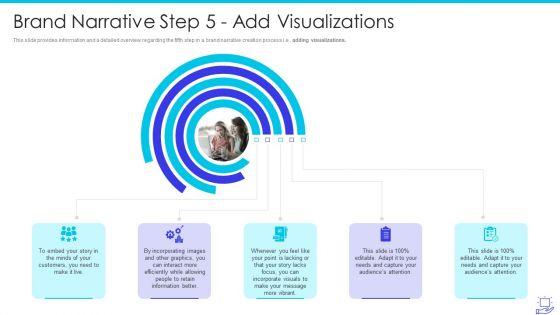
This slide provides information and a detailed overview regarding the fifth step in a brand narrative creation process i.e. adding visualizations. Presenting deploying brand storytelling influence customer brand narrative step 5 add visualizations information pdf to provide visual cues and insights. Share and navigate important information on five stages that need your due attention. This template can be used to pitch topics like information, graphics, customers. In addtion, this PPT design contains high resolution images, graphics, etc, that are easily editable and available for immediate download.


Slide 1 of 9
Persuade your audience using this Business Intelligence Dashboard Icon For Data Analysis And Visualization Information PDF. This PPT design covers three stages, thus making it a great tool to use. It also caters to a variety of topics including Business Intelligence Dashboard Icon, Data Analysis And Visualization. Download this PPT design now to present a convincing pitch that not only emphasizes the topic but also showcases your presentation skills.
15 Item(s)
