AI PPT Maker
Templates
PPT Bundles
Design Services
Business PPTs
Business Plan
Management
Strategy
Introduction PPT
Roadmap
Self Introduction
Timelines
Process
Marketing
Agenda
Technology
Medical
Startup Business Plan
Cyber Security
Dashboards
SWOT
Proposals
Education
Pitch Deck
Digital Marketing
KPIs
Project Management
Product Management
Artificial Intelligence
Target Market
Communication
Supply Chain
Google Slides
Research Services
 One Pagers
All Categories
Visualize Data PowerPoint Presentation Templates and Google Slides
30 Item(s)
Slide 1 of 5
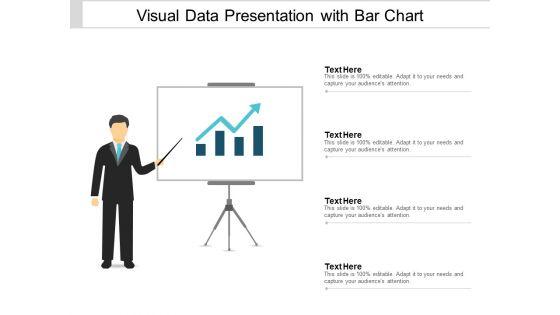
This is a visual data presentation with bar chart ppt powerpoint presentation portfolio brochure. This is a four stage process. The stages in this process are visual aids, communication, business.
Slide 1 of 3
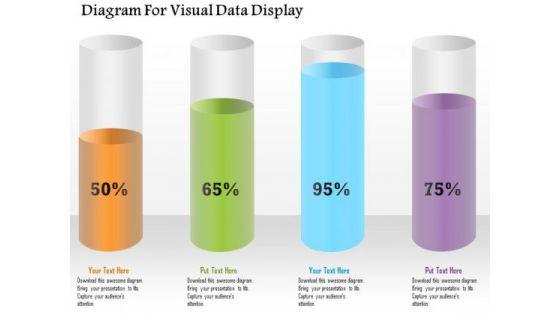
Four colored cylindrical bars with percentage values are used to design this power point template. This diagram slide helps to display financial data analysis. Use this diagram for your business and finance related presentations.


Slide 1 of 3
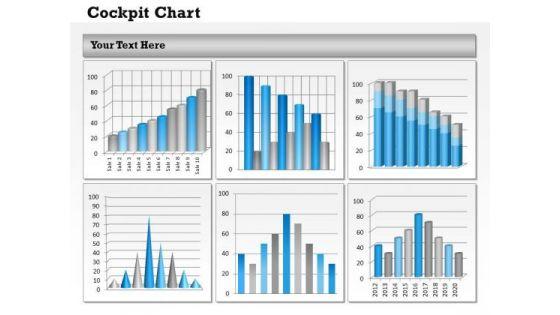
Establish Your Dominion With Our Consulting Diagram Dashboard To Visualize Business Data Consulting Diagram Powerpoint Templates. Rule The Stage With Your Thoughts.
Slide 1 of 2
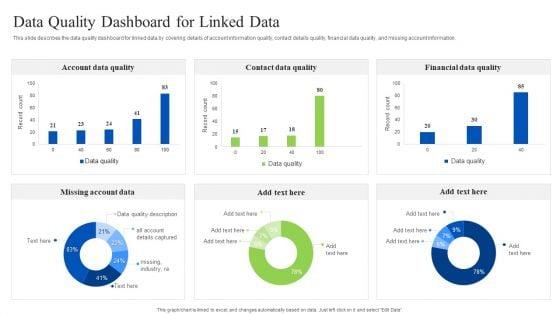
This slide describes the data quality dashboard for linked data by covering details of account information quality, contact details quality, financial data quality, and missing account information. Create an editable Linked Data Visualization Data Quality Dashboard For Linked Data Pictures PDF that communicates your idea and engages your audience. Whether youre presenting a business or an educational presentation, pre-designed presentation templates help save time. Linked Data Visualization Data Quality Dashboard For Linked Data Pictures PDF is highly customizable and very easy to edit, covering many different styles from creative to business presentations. Slidegeeks has creative team members who have crafted amazing templates. So, go and get them without any delay.
Slide 1 of 2
This slide describes that using visualization in academic areas caters to easy detection of trendy data sets and helps understand the data. Presenting Departments Of Visualization Research Data Visualization Helps In Academic Research Icons PDF to provide visual cues and insights. Share and navigate important information on six stages that need your due attention. This template can be used to pitch topics like Eliminating Irrelevant, Visualizations Condense, Employed Successfully In addtion, this PPT design contains high resolution images, graphics, etc, that are easily editable and available for immediate download.


Slide 1 of 2
This slide depicts the impact of visualization research implementation, which results in data-driven project planning, due to which there is a 23 times increase in happy customers.This is a Departments Of Visualization Research Data Driven Project Planning After Visualization Rules PDF template with various stages. Focus and dispense information on three stages using this creative set, that comes with editable features. It contains large content boxes to add your information on topics like Visualization Research, Strategy Of The Company, Customers Are Regained You can also showcase facts, figures, and other relevant content using this PPT layout. Grab it now.


Slide 1 of 2
Presenting 8 steps infographic visual for data mining privacy issues ppt powerpoint presentation file sample pdf to dispense important information. This template comprises eight stages. It also presents valuable insights into the topics including 8 steps infographic visual for data mining privacy issues. This is a completely customizable PowerPoint theme that can be put to use immediately. So, download it and address the topic impactfully.

Slide 1 of 2
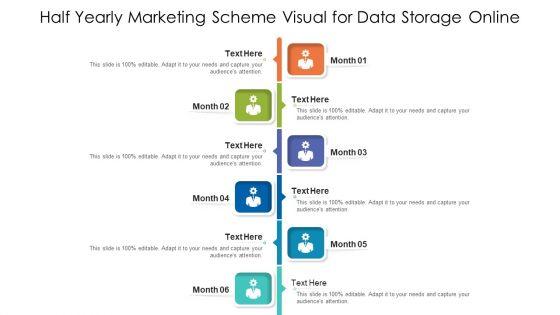
Persuade your audience using this half yearly marketing scheme visual for data storage online ppt powerpoint presentation gallery files pdf. This PPT design covers six stages, thus making it a great tool to use. It also caters to a variety of topics including half yearly marketing scheme visual for data storage online. Download this PPT design now to present a convincing pitch that not only emphasizes the topic but also showcases your presentation skills.
Slide 1 of 2
Persuade your audience using this 5 stage roadmap visual for data mining privacy issues ppt powerpoint presentation icon outline pdf. This PPT design covers five stages, thus making it a great tool to use. It also caters to a variety of topics including 5 stage roadmap visual for data mining privacy issues. Download this PPT design now to present a convincing pitch that not only emphasizes the topic but also showcases your presentation skills.
Slide 1 of 2
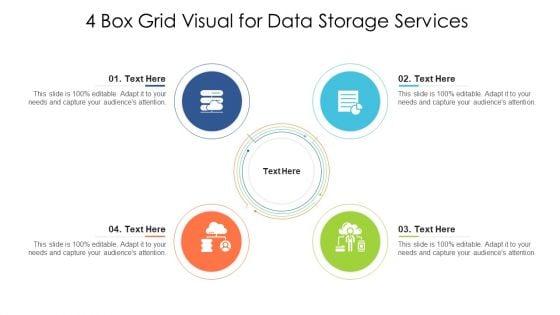
Persuade your audience using this 4 box grid visual for data storage services ppt gallery demonstration pdf. This PPT design covers four stages, thus making it a great tool to use. It also caters to a variety of topics including 4 box grid visual for data storage services. Download this PPT design now to present a convincing pitch that not only emphasizes the topic but also showcases your presentation skills.


Slide 1 of 2
Persuade your audience using this aims presentation visual of data operations team structure ppt powerpoint presentation gallery infographics pdf. This PPT design covers four stages, thus making it a great tool to use. It also caters to a variety of topics including aims presentation visual of data operations team structure. Download this PPT design now to present a convincing pitch that not only emphasizes the topic but also showcases your presentation skills.

Slide 1 of 2
Persuade your audience using this business objective presentation visual of data information and knowledge information pdf. This PPT design covers four stages, thus making it a great tool to use. It also caters to a variety of topics including business objective presentation visual of data information and knowledge. Download this PPT design now to present a convincing pitch that not only emphasizes the topic but also showcases your presentation skills.
Slide 1 of 2
Presenting annual timeline roadmap visual for data mining privacy issues ppt powerpoint presentation icon files pdf to dispense important information. This template comprises six stages. It also presents valuable insights into the topics including annual timeline roadmap visual for data mining privacy issues. This is a completely customizable PowerPoint theme that can be put to use immediately. So, download it and address the topic impactfully.
Slide 1 of 2
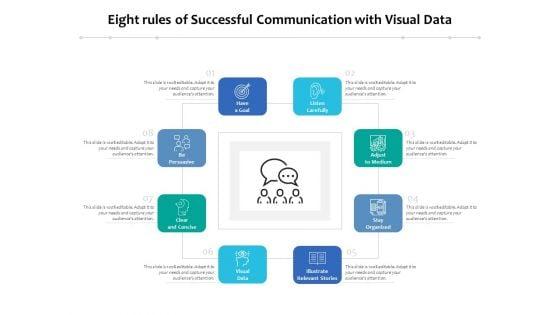
Persuade your audience using this eight rules of successful communication with visual data ppt powerpoint presentation file outline pdf. This PPT design covers eight stages, thus making it a great tool to use. It also caters to a variety of topics including organized, persuasive, goal. Download this PPT design now to present a convincing pitch that not only emphasizes the topic but also showcases your presentation skills.


Slide 1 of 2
Presenting this set of slides with name data visualization techniques data analytics ppt powerpoint presentation outline clipart images cpb. This is an editable Powerpoint six stages graphic that deals with topics like data visualization techniques data analytics to help convey your message better graphically. This product is a premium product available for immediate download and is 100 percent editable in Powerpoint. Download this now and use it in your presentations to impress your audience.


Slide 1 of 9
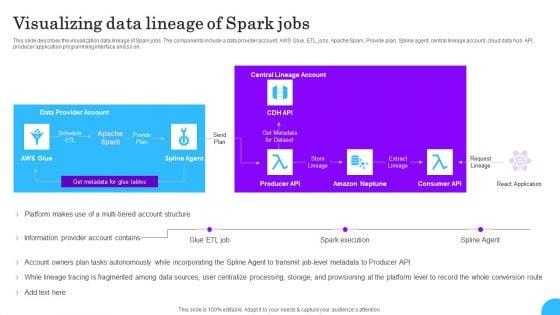
This slide describes the visualization data lineage of Spark jobs. The components include a data provider account, AWS Glue, ETL jobs, Apache Spark, Provide plan, Spline agent, central lineage account, cloud data hub API, producer application programming interface and so on. Coming up with a presentation necessitates that the majority of the effort goes into the content and the message you intend to convey. The visuals of a PowerPoint presentation can only be effective if it supplements and supports the story that is being told. Keeping this in mind our experts created Comprehensive Analysis Of Different Data Lineage Classification Visualizing Data Lineage Of Spark Jobs Slides PDF to reduce the time that goes into designing the presentation. This way, you can concentrate on the message while our designers take care of providing you with the right template for the situation.


Slide 1 of 9
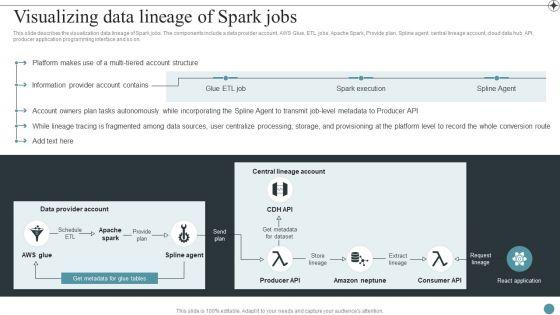
This slide describes the visualization data lineage of Spark jobs. The components include a data provider account, AWS Glue, ETL jobs, Apache Spark, Provide plan, Spline agent, central lineage account, cloud data hub API, producer application programming interface and so on.Make sure to capture your audiences attention in your business displays with our gratis customizable Visualizing Data Lineage Of Spark Jobs Deploying Data Lineage IT Professional PDF. These are great for business strategies, office conferences, capital raising or task suggestions. If you desire to acquire more customers for your tech business and ensure they stay satisfied, create your own sales presentation with these plain slides.


Slide 1 of 9
This slide outlines the pattern-based data lineage technique that generates the data lineage using patterns in metadata. It doesnt require knowledge of programming language for data processing, which is added advantage for non-technical stakeholders.Find a pre-designed and impeccable Overview Of Graph Data Lineage Visualization Deploying Data Lineage IT Professional PDF. The templates can ace your presentation without additional effort. You can download these easy-to-edit presentation templates to make your presentation stand out from others. So, what are you waiting for Download the template from Slidegeeks today and give a unique touch to your presentation.


Slide 1 of 9
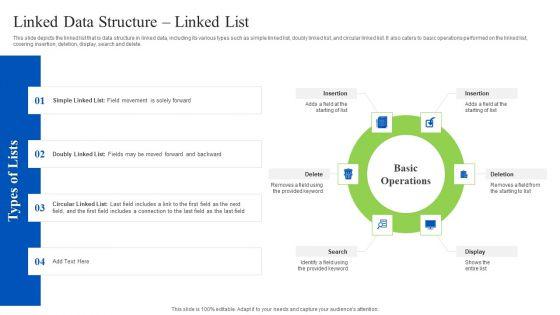
This slide depicts the linked list that is data structure in linked data, including its various types such as simple linked list, doubly linked list, and circular linked list. It also caters to basic operations performed on the linked list, covering insertion, deletion, display, search and delete. Coming up with a presentation necessitates that the majority of the effort goes into the content and the message you intend to convey. The visuals of a PowerPoint presentation can only be effective if it supplements and supports the story that is being told. Keeping this in mind our experts created Linked Data Visualization Linked Data Structure Linked List Ppt Outline Professional PDF to reduce the time that goes into designing the presentation. This way, you can concentrate on the message while our designers take care of providing you with the right template for the situation.


Slide 1 of 9
This slide represents the simple linked list data structure of linked data, including its representation, and various elements such as first, next, node, data items and null. The basic operations performed on a simple linked list are insertion, deletion and reverse. There are so many reasons you need a Linked Data Visualization Data Structure Simple Linked List Clipart PDF. The first reason is you cant spend time making everything from scratch, Thus, Slidegeeks has made presentation templates for you too. You can easily download these templates from our website easily.


Slide 1 of 9
This slide depicts the doubly linked list in the linked data structure, including its representation and basic operations, such as insertion, deletion, insert last, delete last, insert after, delete, display forward, and display backward. Want to ace your presentation in front of a live audience Our Linked Data Visualization Data Structure Doubly Linked List Inspiration PDF can help you do that by engaging all the users towards you. Slidegeeks experts have put their efforts and expertise into creating these impeccable powerpoint presentations so that you can communicate your ideas clearly. Moreover, all the templates are customizable, and easy-to-edit and downloadable. Use these for both personal and commercial use.


Slide 1 of 9
This slide represents the circular linked list in the data structure, including its different categories such as singly linked list and doubly linked list. It also caters to the basic operations of the circular linked list, such as insertion, deletion, and display. Slidegeeks is one of the best resources for PowerPoint templates. You can download easily and regulate Linked Data Visualization Data Structure Circular Linked List Portrait PDF for your personal presentations from our wonderful collection. A few clicks is all it takes to discover and get the most relevant and appropriate templates. Use our Templates to add a unique zing and appeal to your presentation and meetings. All the slides are easy to edit and you can use them even for advertisement purposes.


Slide 1 of 9
Deliver an awe inspiring pitch with this creative Information Visualizations Playbook Data Management Framework After Data Analytics Solution Formats PDF bundle. Topics like Data Discovery, Data Sharing, Data Harmonization can be discussed with this completely editable template. It is available for immediate download depending on the needs and requirements of the user.


Slide 1 of 9
Presenting Table Of Contents Information Visualizations Playbook Data Pictures PDF to provide visual cues and insights. Share and navigate important information on one stages that need your due attention. This template can be used to pitch topics like Automated Data Analysis, Information Visualizations Playbook. In addtion, this PPT design contains high resolution images, graphics, etc, that are easily editable and available for immediate download.


Slide 1 of 9
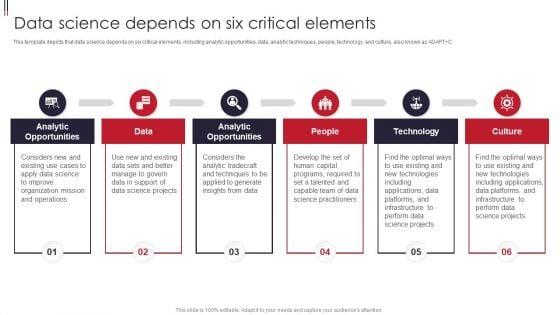
This template depicts that data science depends on six critical elements, including analytic opportunities, data, analytic techniques, people, technology, and culture, also known as ADAPT C. This is a Information Visualizations Playbook Data Science Depends On Six Critical Elements Structure PDF template with various stages. Focus and dispense information on six stages using this creative set, that comes with editable features. It contains large content boxes to add your information on topics like Data, Analytic Opportunities, Technology. You can also showcase facts, figures, and other relevant content using this PPT layout. Grab it now.
Slide 1 of 1
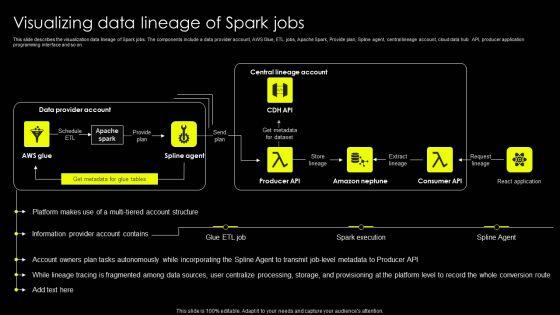
This slide describes the visualization data lineage of Spark jobs. The components include a data provider account, AWS Glue, ETL jobs, Apache Spark, Provide plan, Spline agent, central lineage account, cloud data hub API, producer application programming interface and so on. Coming up with a presentation necessitates that the majority of the effort goes into the content and the message you intend to convey. The visuals of a PowerPoint presentation can only be effective if it supplements and supports the story that is being told. Keeping this in mind our experts created Data Lineage Implementation Visualizing Data Lineage Of Spark Jobs Portrait PDF to reduce the time that goes into designing the presentation. This way, you can concentrate on the message while our designers take care of providing you with the right template for the situation.


Slide 1 of 9
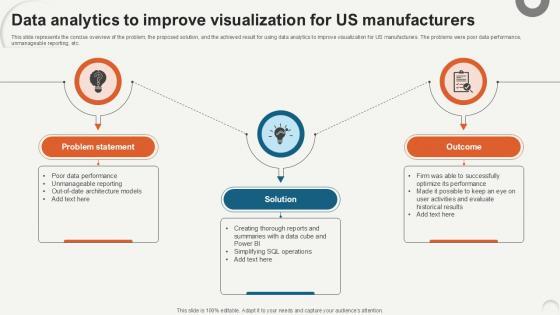
This slide represents the concise overview of the problem, the proposed solution, and the achieved result for using data analytics to improve visualization for US manufacturers. The problems were poor data performance, unmanageable reporting, etc. Whether you have daily or monthly meetings, a brilliant presentation is necessary. Data Analytics To Improve Visualization Data Analytics For Informed Decision Ppt PowerPoint can be your best option for delivering a presentation. Represent everything in detail using Data Analytics To Improve Visualization Data Analytics For Informed Decision Ppt PowerPoint and make yourself stand out in meetings. The template is versatile and follows a structure that will cater to your requirements. All the templates prepared by Slidegeeks are easy to download and edit. Our research experts have taken care of the corporate themes as well. So, give it a try and see the results. This slide represents the concise overview of the problem, the proposed solution, and the achieved result for using data analytics to improve visualization for US manufacturers. The problems were poor data performance, unmanageable reporting, etc.


Slide 1 of 10
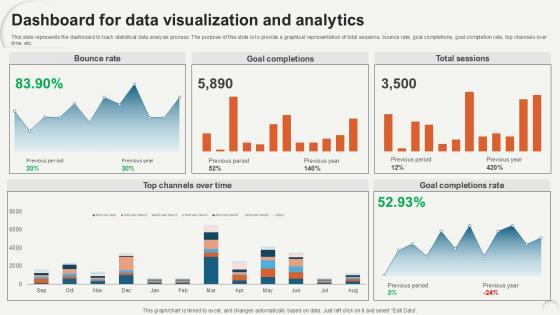
This slide represents the dashboard to track statistical data analysis process. The purpose of this slide is to provide a graphical representation of total sessions, bounce rate, goal completions, goal completion rate, top channels over time, etc. Do you have an important presentation coming up Are you looking for something that will make your presentation stand out from the rest Look no further than Dashboard For Data Visualization Data Analytics For Informed Decision Ppt Sample. With our professional designs, you can trust that your presentation will pop and make delivering it a smooth process. And with Slidegeeks, you can trust that your presentation will be unique and memorable. So why wait Grab Dashboard For Data Visualization Data Analytics For Informed Decision Ppt Sample today and make your presentation stand out from the rest This slide represents the dashboard to track statistical data analysis process. The purpose of this slide is to provide a graphical representation of total sessions, bounce rate, goal completions, goal completion rate, top channels over time, etc.


Slide 1 of 9
This slide describes the visualization data lineage of Spark jobs. The components include a data provider account, AWS Glue, ETL jobs, Apache Spark, Provide plan, Spline agent, central lineage account, cloud data hub API, producer application programming interface and so on. Coming up with a presentation necessitates that the majority of the effort goes into the content and the message you intend to convey. The visuals of a PowerPoint presentation can only be effective if it supplements and supports the story that is being told. Keeping this in mind our experts created Business Process Data Lineage Visualizing Data Lineage Of Spark Jobs Ideas Pdf to reduce the time that goes into designing the presentation. This way, you can concentrate on the message while our designers take care of providing you with the right template for the situation. This slide describes the visualization data lineage of Spark jobs. The components include a data provider account, AWS Glue, ETL jobs, Apache Spark, Provide plan, Spline agent, central lineage account, cloud data hub API, producer application programming interface and so on.


Slide 1 of 9
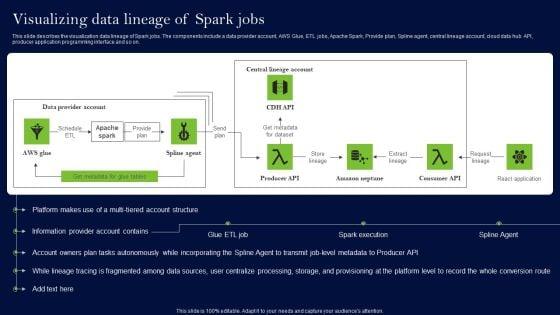
This slide describes the visualization data lineage of Spark jobs. The components include a data provider account, AWS Glue, ETL jobs, Apache Spark, Provide plan, Spline agent, central lineage account, cloud data hub API, producer application programming interface and so on. There are so many reasons you need a Data Lineage Methods Visualizing Data Lineage Of Spark Jobs Guidelines PDF. The first reason is you can not spend time making everything from scratch, Thus, Slidegeeks has made presentation templates for you too. You can easily download these templates from our website easily.
30 Item(s)
