 AI PPT Maker
 Templates
 PPT Bundles
 Design Services
 Business PPTs
 Business Plan
 Management
 Strategy
 Introduction PPT
 Roadmap
 Self Introduction
 Timelines
 Process
 Marketing
 Agenda
 Technology
 Medical
 Startup Business Plan
 Cyber Security
 Dashboards
 SWOT
SWOT Proposals
 Education
 Pitch Deck
 Digital Marketing
 KPIs
KPIs Project Management
 Product Management
 Artificial Intelligence
 Target Market
 Communication
 Supply Chain
 Google Slides
 Research Services
 One Pagers
 All Categories
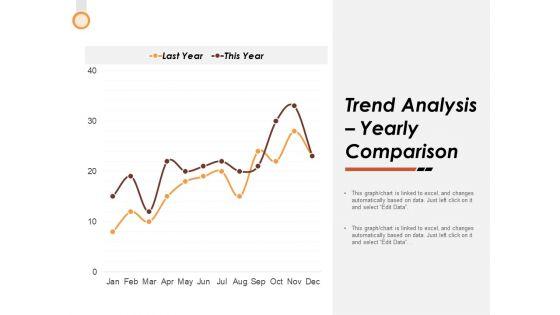
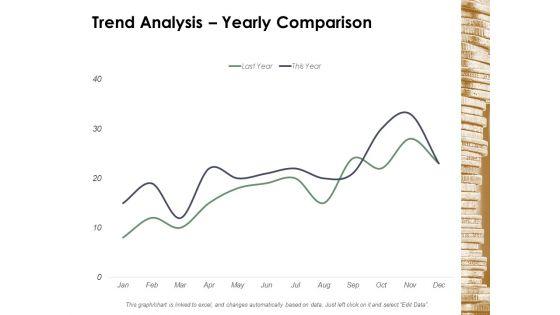
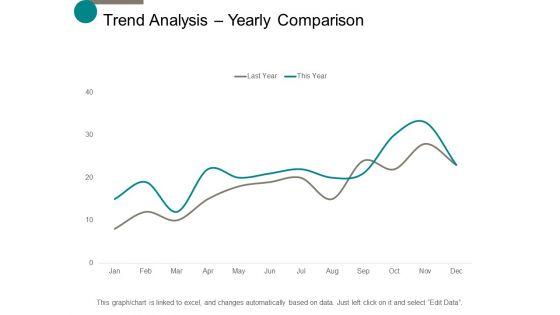
Yearly-comparison PowerPoint Presentation Templates and Google Slides
24 Item(s)


This slide showcases yearly breakdown that can help to identify amount of revenue generated by different manufacturing industries and analyze the reason behind decline. It showcases comparison for a period of 3 years. Showcasing this set of slides titled Yearly Comparison Of Manufacturing Industries Earning Breakup Portrait PDF. The topics addressed in these templates are Electronics, Machinery, Automobile. All the content presented in this PPT design is completely editable. Download it and make adjustments in color, background, font etc. as per your unique business setting.

This slide shows comparison increase in employees headcount in last four years. The key reason for increase in workforce headcount is business expansion. Showcasing this set of slides titled Yearly Comparison Of Employees Workforce Increase Ppt Styles Slide PDF. The topics addressed in these templates are Continuous Increase, Employees Headcount, Business Expansion. All the content presented in this PPT design is completely editable. Download it and make adjustments in color, background, font etc. as per your unique business setting.
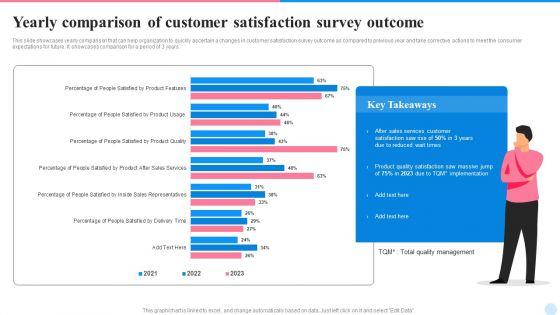
This slide showcases yearly comparison that can help organization to quickly ascertain a changes in customer satisfaction survey outcome as compared to previous year and take corrective actions to meet the consumer expectations for future. It showcases comparison for a period of 3 years. Showcasing this set of slides titled Yearly Comparison Of Customer Satisfaction Survey Outcome Demonstration PDF. The topics addressed in these templates are Sales Services Customer, Implementation, Product Quality Satisfaction. All the content presented in this PPT design is completely editable. Download it and make adjustments in color, background, font etc. as per your unique business setting.


This slide showcases yearly comparison of salary of different employees in organization and identify the increment growth rate. It showcases comparative assessment for a period of 4 years. Pitch your topic with ease and precision using this Yearly Comparison Graph For Human Resource Employees Salary Template PDF. This layout presents information on Human Resource, Employees Salary. It is also available for immediate download and adjustment. So, changes can be made in the color, design, graphics or any other component to create a unique layout.
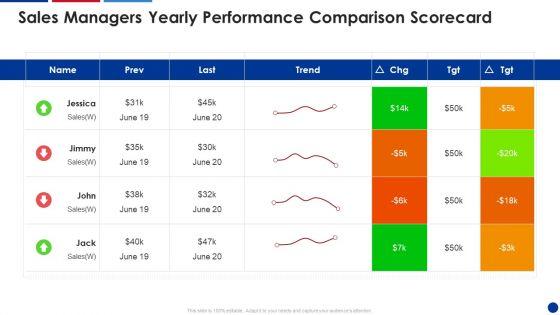

Deliver and pitch your topic in the best possible manner with this Sales Managers Yearly Performance Comparison Scorecard Designs PDF. Use them to share invaluable insights on Sales Managers, Yearly Performance, Comparison Scorecard and impress your audience. This template can be altered and modified as per your expectations. So, grab it now.
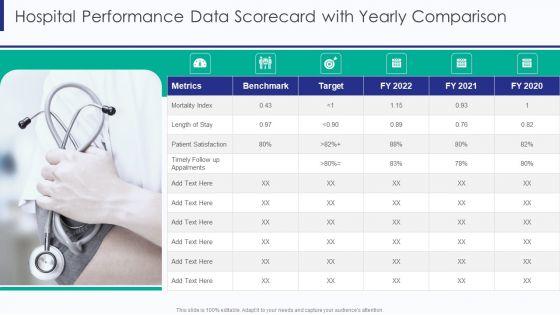

Deliver and pitch your topic in the best possible manner with this Healthcare Hospital Performance Data Scorecard With Yearly Comparison Ppt Model Templates PDF. Use them to share invaluable insights on Mortality Index Metrics, Patient Satisfaction Target, Length Of Stay and impress your audience. This template can be altered and modified as per your expectations. So, grab it now.

This slide showcases yearly comparison table that can help organization to identify the change in current year website statistics as compared to previous year. Its key metrics are total traffic, conversion rate, pages or session, pageviews and bounce rate. Pitch your topic with ease and precision using this Website Data Yearly Comparison With Percentage Change Formats PDF. This layout presents information on Website Data Yearly Comparison With Percentage Change. It is also available for immediate download and adjustment. So, changes can be made in the color, design, graphics or any other component to create a unique layout.
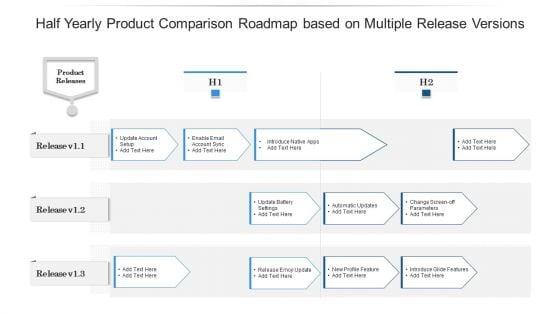

Presenting our jaw dropping half yearly product comparison roadmap based on multiple release versions information. You can alternate the color, font size, font type, and shapes of this PPT layout according to your strategic process. This PPT presentation is compatible with Google Slides and is available in both standard screen and widescreen aspect ratios. You can also download this well researched PowerPoint template design in different formats like PDF, JPG, and PNG. So utilize this visually appealing design by clicking the download button given below.
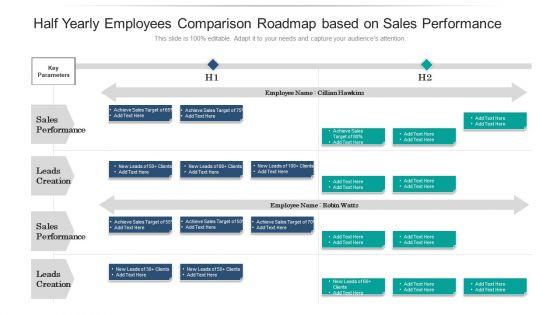
We present our half yearly employees comparison roadmap based on sales performance template. This PowerPoint layout is easy to edit so you can change the font size, font type, color, and shape conveniently. In addition to this, the PowerPoint layout is Google Slides compatible, so you can share it with your audience and give them access to edit it. Therefore, download and save this well researched half yearly employees comparison roadmap based on sales performance template in different formats like PDF, PNG, and JPG to smoothly execute your business plan.
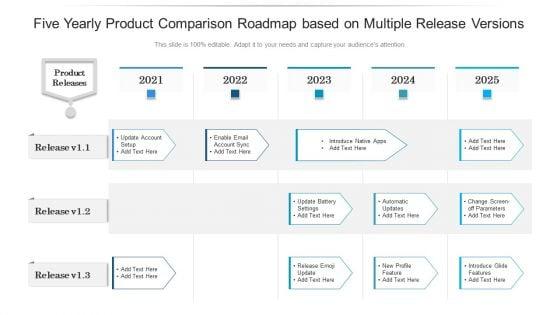

Presenting our jaw dropping five yearly product comparison roadmap based on multiple release versions guidelines. You can alternate the color, font size, font type, and shapes of this PPT layout according to your strategic process. This PPT presentation is compatible with Google Slides and is available in both standard screen and widescreen aspect ratios. You can also download this well researched PowerPoint template design in different formats like PDF, JPG, and PNG. So utilize this visually appealing design by clicking the download button given below.
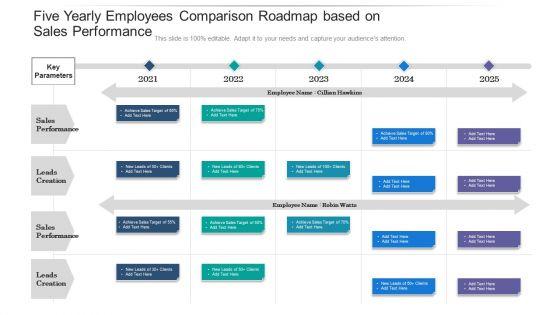

We present our five yearly employees comparison roadmap based on sales performance summary. This PowerPoint layout is easy to edit so you can change the font size, font type, color, and shape conveniently. In addition to this, the PowerPoint layout is Google Slides compatible, so you can share it with your audience and give them access to edit it. Therefore, download and save this well researched five yearly employees comparison roadmap based on sales performance summary in different formats like PDF, PNG, and JPG to smoothly execute your business plan.
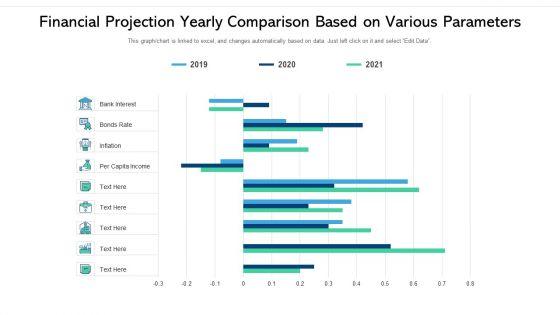
Showcasing this set of slides titled financial projection yearly comparison based on various parameters ppt ideas infographics pdf. The topics addressed in these templates are financial projection yearly comparison based on various parameters. All the content presented in this PPT design is completely editable. Download it and make adjustments in color, background, font etc. as per your unique business setting.


This is a yearly timeline comparison of loyal customers ppt powerpoint presentation pictures information pdf template with various stages. Focus and dispense information on two stages using this creative set, that comes with editable features. It contains large content boxes to add your information on topics like timeline analysis of business loyal consumers. You can also showcase facts, figures, and other relevant content using this PPT layout. Grab it now.
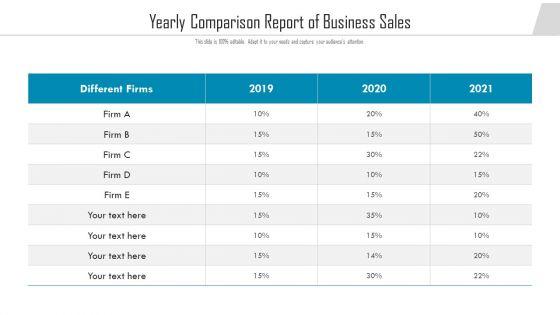
Showcasing this set of slides titled yearly comparison report of business sales ppt portfolio rules pdf. The topics addressed in these templates are yearly comparison report of business sales. All the content presented in this PPT design is completely editable. Download it and make adjustments in color, background, font etc. as per your unique business setting.
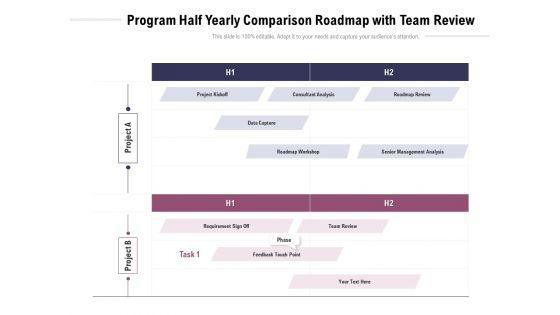
Presenting our jaw dropping program half yearly comparison roadmap with team review microsoft. You can alternate the color, font size, font type, and shapes of this PPT layout according to your strategic process. This PPT presentation is compatible with Google Slides and is available in both standard screen and widescreen aspect ratios. You can also download this well researched PowerPoint template design in different formats like PDF, JPG, and PNG. So utilize this visually appealing design by clicking the download button given below.
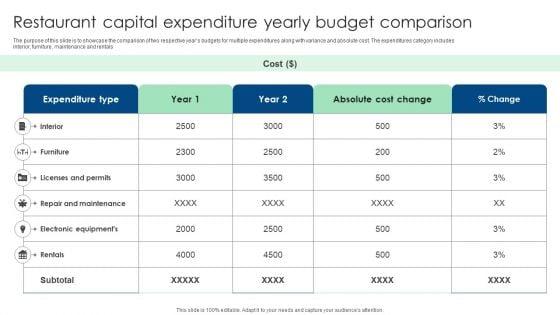


The purpose of this slide is to showcase the comparison of two respective years budgets for multiple expenditures along with variance and absolute cost. The expenditures category includes interior, furniture, maintenance and rentals. Showcasing this set of slides titled Restaurant Capital Expenditure Yearly Budget Comparison Ppt Professional Guide PDF. The topics addressed in these templates are Expenditure Type, Licenses And Permits, Absolute Cost Change. All the content presented in this PPT design is completely editable. Download it and make adjustments in color, background, font etc. as per your unique business setting.
Persuade your audience using this Yearly Comparison Graph Icon For Operating Profit Margin Topics PDF. This PPT design covers four stages, thus making it a great tool to use. It also caters to a variety of topics including Yearly Comparison Graph, Icon For Operating, Profit Margin. Download this PPT design now to present a convincing pitch that not only emphasizes the topic but also showcases your presentation skills.

This slide showcases comparison table that can help organization to compare operating profit margin for a period of five years. Its key components are revenue, gross profit, expenses, operating expenses, operating profit and operating margin. Showcasing this set of slides titled Yearly Comparison For Operating Profit Margin And Expenses Demonstration PDF. The topics addressed in these templates are Gross Profit, Revenue, Operating Expenses. All the content presented in this PPT design is completely editable. Download it and make adjustments in color, background, font etc. as per your unique business setting.
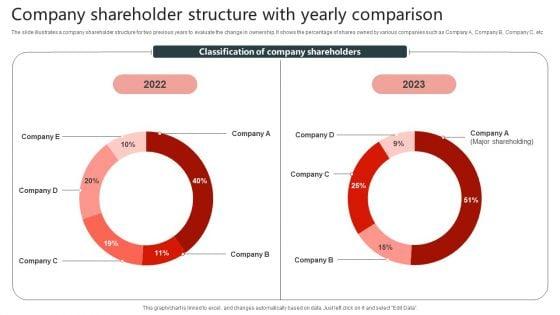
The slide illustrates a company shareholder structure for two previous years to evaluate the change in ownership. It shows the percentage of shares owned by various companies such as Company A, Company B, Company C, etc. Pitch your topic with ease and precision using this Company Shareholder Structure With Yearly Comparison Infographics PDF. This layout presents information on Structure With Yearly Comparison, Company Shareholder. It is also available for immediate download and adjustment. So, changes can be made in the color, design, graphics or any other component to create a unique layout.
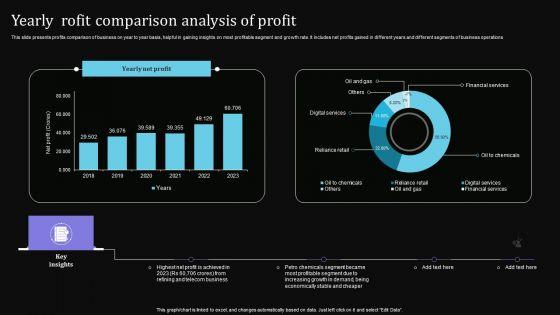
This slide presents profits comparison of business on year to year basis, helpful in gaining insights on most profitable segment and growth rate. It includes net profits gained in different years and different segments of business operations. Showcasing this set of slides titled Yearly Rofit Comparison Analysis Of Profit Slides PDF. The topics addressed in these templates are Highest Net Profit, Telecom Business, Stable Cheaper. All the content presented in this PPT design is completely editable. Download it and make adjustments in color, background, font etc. as per your unique business setting.
24 Item(s)