AI PPT Maker
Templates
PPT Bundles
Design Services
Business PPTs
Business Plan
Management
Strategy
Introduction PPT
Roadmap
Self Introduction
Timelines
Process
Marketing
Agenda
Technology
Medical
Startup Business Plan
Cyber Security
Dashboards
SWOT
Proposals
Education
Pitch Deck
Digital Marketing
KPIs
Project Management
Product Management
Artificial Intelligence
Target Market
Communication
Supply Chain
Google Slides
Research Services
 One Pagers
All Categories
After IPO Equity Non Performing Assets Loans Graph Ppt Infographic Template Example Introduction PDF
Features of these PowerPoint presentation slides:
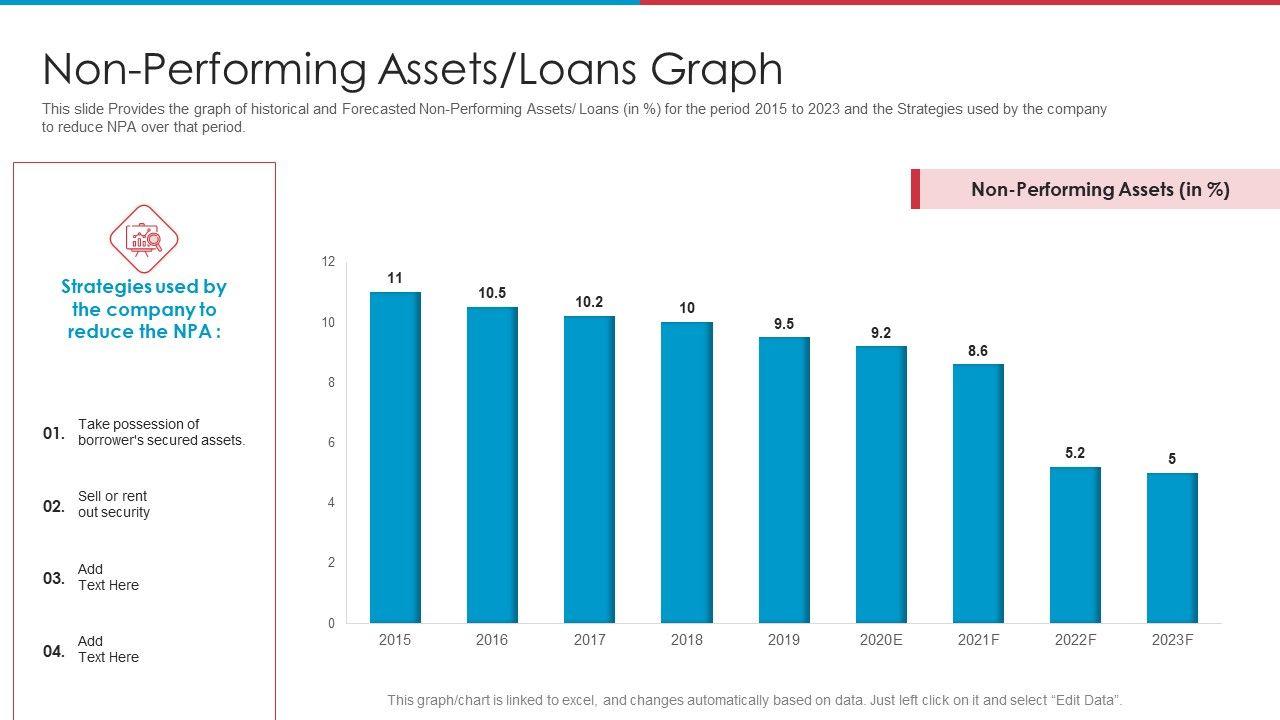
This slide Provides the graph of historical and Forecasted Non-Performing Assets or Loans in percent for the period 2015 to 2023 and the Strategies used by the company to reduce NPA over that period. Deliver an awe-inspiring pitch with this creative after ipo equity non performing assets loans graph ppt infographic template example introduction pdf bundle. Topics like non performing assets or loans graph can be discussed with this completely editable template. It is available for immediate download depending on the needs and requirements of the user.
People who downloaded this PowerPoint presentation also viewed the following :
Keywords:
Related Products
After IPO Equity Non Performing Assets Loans Graph Ppt Infographic Template Example Introduction PDF with all 2 slides:
Ratings and Reviews
5
- ★51
- ★40
- ★30
- ★20
- ★10
Write a review
Most Relevant Reviews
by Kirti Jindal
August 12, 2021
Excellent design and quick turnaround.
View per page:
10


