- Sign up
- Sign In
 AI PPT Maker
 Templates
 PPT Bundles
 Design Services
 Business PPTs
 Business Plan
 Management
 Strategy
 Introduction PPT
 Roadmap
 Self Introduction
 Timelines
 Process
 Marketing
 Agenda
 Technology
 Medical
 Startup Business Plan
 Cyber Security
 Dashboards
 SWOT
SWOT Proposals
 Education
 Pitch Deck
 Digital Marketing
 KPIs
KPIs Project Management
 Product Management
 Artificial Intelligence
 Target Market
 Communication
 Supply Chain
 Google Slides
 Research Services
 One Pagers
 All Categories
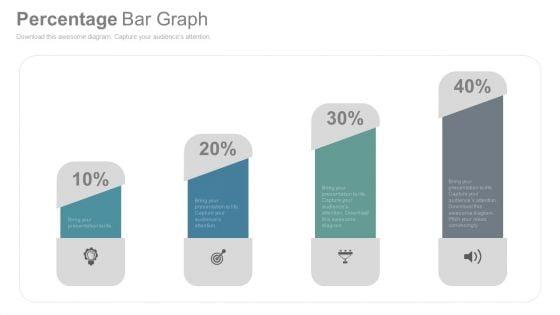
Bar Graph To Compare Business Data PowerPoint Slides

Features of these PowerPoint presentation slides:
This is the slide which can solve many purposes of yours. Be it growth in your company, need to show your company?s status in the market as compared to others, or how your business has improved so far. An ideal PowerPoint template to display all of these. You can easily use this graph to show the growth of your company using the percentage icons. You can use this visual to show the status of your company in the market in comparison with others. You can edit the icons and replace them with the logo of your company and the others. You can also show it to your colleagues how your company has built its image in the market or how it has improved over the time. A perfect bar graph image which needs to be included in your business PPT presentations.
People who downloaded this PowerPoint presentation also viewed the following :
Keywords:
Bar Graph To Compare Business Data PowerPoint Slides with all 4 slides: