AI PPT Maker
Templates
PPT Bundles
Design Services
Business PPTs
Business Plan
Management
Strategy
Introduction PPT
Roadmap
Self Introduction
Timelines
Process
Marketing
Agenda
Technology
Medical
Startup Business Plan
Cyber Security
Dashboards
SWOT
Proposals
Education
Pitch Deck
Digital Marketing
KPIs
Project Management
Product Management
Artificial Intelligence
Target Market
Communication
Supply Chain
Google Slides
Research Services
 One Pagers
All Categories
Dashboard For Tracking Impact Of Transport Automation Optimizing Automated Supply Chain And Logistics Inspiration PDF
Features of these PowerPoint presentation slides:
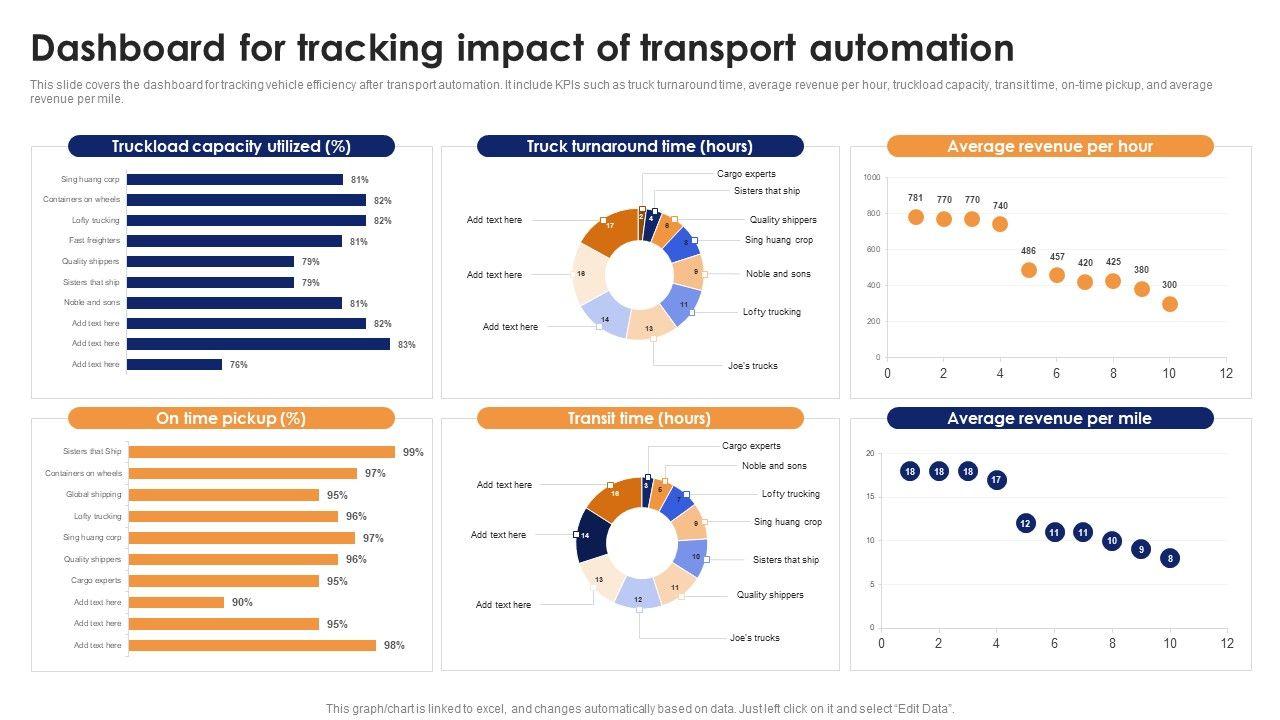
This slide covers the dashboard for tracking vehicle efficiency after transport automation. It include KPIs such as truck turnaround time, average revenue per hour, truckload capacity, transit time, on-time pickup, and average revenue per mile. Whether you have daily or monthly meetings, a brilliant presentation is necessary. Dashboard For Tracking Impact Of Transport Automation Optimizing Automated Supply Chain And Logistics Inspiration PDF can be your best option for delivering a presentation. Represent everything in detail using Dashboard For Tracking Impact Of Transport Automation Optimizing Automated Supply Chain And Logistics Inspiration PDF and make yourself stand out in meetings. The template is versatile and follows a structure that will cater to your requirements. All the templates prepared by Slidegeeks are easy to download and edit. Our research experts have taken care of the corporate themes as well. So, give it a try and see the results.
People who downloaded this PowerPoint presentation also viewed the following :
Related Products
Dashboard For Tracking Impact Of Transport Automation Optimizing Automated Supply Chain And Logistics Inspiration PDF with all 2 slides:
Ratings and Reviews
4.5
- ★51
- ★41
- ★30
- ★20
- ★10
Write a review
Most Relevant Reviews
by Mark Comer
January 27, 2023
Easy to edit slides with easy to understand instructions.by ali
January 27, 2023
Commendable slides with attractive designs. Extremely pleased with the fact that they are easy to modify. Great work!
View per page:
10


