- Sign up
- Sign In
 AI PPT Maker
 Templates
 PPT Bundles
 Design Services
 Business PPTs
 Business Plan
 Management
 Strategy
 Introduction PPT
 Roadmap
 Self Introduction
 Timelines
 Process
 Marketing
 Agenda
 Technology
 Medical
 Startup Business Plan
 Cyber Security
 Dashboards
 SWOT
SWOT Proposals
 Education
 Pitch Deck
 Digital Marketing
 KPIs
KPIs Project Management
 Product Management
 Artificial Intelligence
 Target Market
 Communication
 Supply Chain
 Google Slides
 Research Services
 One Pagers
 All Categories
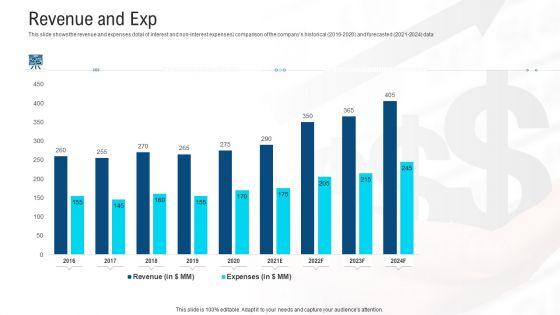
Revenue And Expenses Comparison Historical Vs Forecasted Ppt Show Deck PDF

Features of these PowerPoint presentation slides:
This slide shows the revenue and expenses total of interest and non interest expenses comparison of the companys historical 2016 to2020 and forecasted 2021 to2024 data.Deliver and pitch your topic in the best possible manner with this revenue and expenses comparison historical vs forecasted ppt show deck pdf. Use them to share invaluable insights on 2015 to 2024, revenue and impress your audience. This template can be altered and modified as per your expectations. So, grab it now.
People who downloaded this PowerPoint presentation also viewed the following :
Keywords:
Revenue And Expenses Comparison Historical Vs Forecasted Ppt Show Deck PDF with all 2 slides: