AI PPT Maker
Templates
PPT Bundles
Design Services
Business PPTs
Business Plan
Management
Strategy
Introduction PPT
Roadmap
Self Introduction
Timelines
Process
Marketing
Agenda
Technology
Medical
Startup Business Plan
Cyber Security
Dashboards
SWOT
Proposals
Education
Pitch Deck
Digital Marketing
KPIs
Project Management
Product Management
Artificial Intelligence
Target Market
Communication
Supply Chain
Google Slides
Research Services
 One Pagers
All Categories
QA Modification For Product Quality Development And Consumer Satisfaction QA Key Performance Indicators Infographics PDF
Features of these PowerPoint presentation slides:
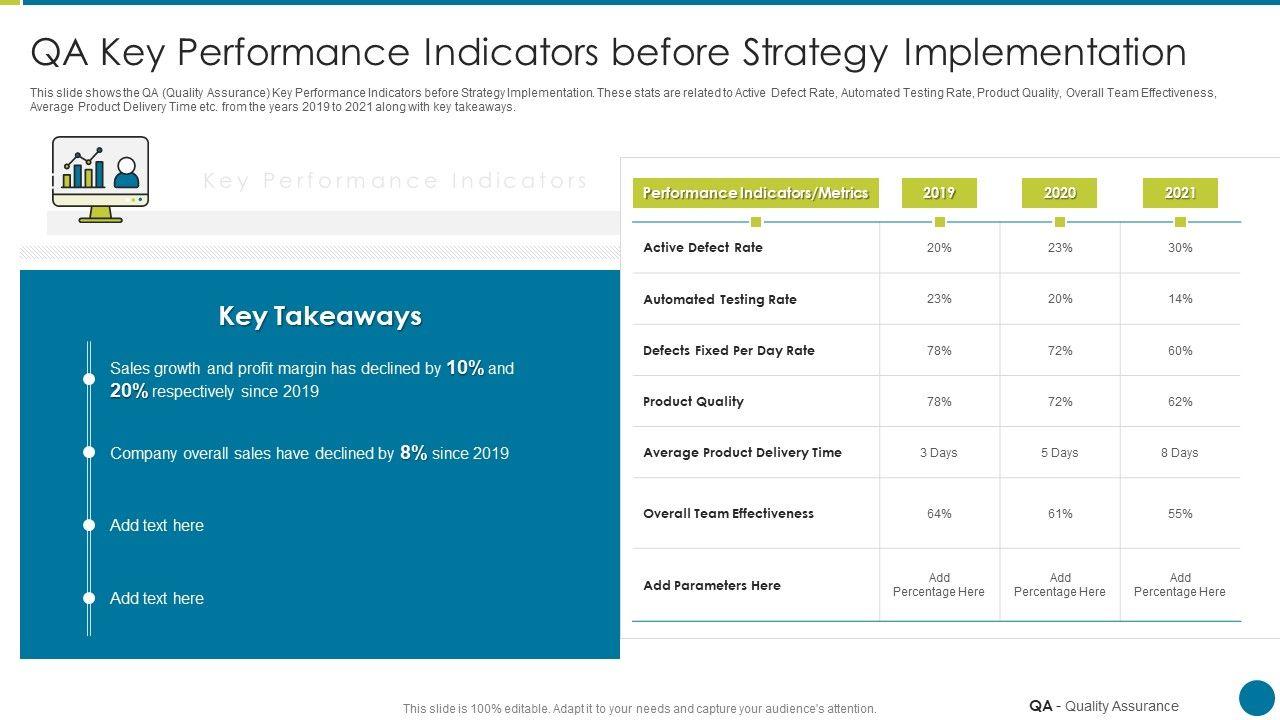
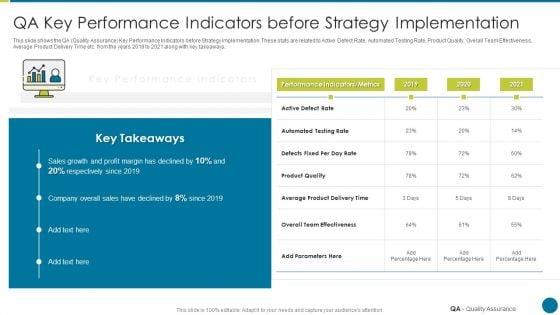
This slide shows the QA Quality Assurance Key Performance Indicators before Strategy Implementation. These stats are related to Active Defect Rate, Automated Testing Rate, Product Quality, Overall Team Effectiveness, Average Product Delivery Time etc. from the years 2019 to 2021 along with key takeaways. Deliver an awe inspiring pitch with this creative qa modification for product quality development and consumer satisfaction qa key performance indicators infographics pdf bundle. Topics like overall team effectiveness, product quality, performance, product quality can be discussed with this completely editable template. It is available for immediate download depending on the needs and requirements of the user.
People who downloaded this PowerPoint presentation also viewed the following :
Related Products
QA Modification For Product Quality Development And Consumer Satisfaction QA Key Performance Indicators Infographics PDF with all 2 slides:
Ratings and Reviews
4
- ★50
- ★42
- ★30
- ★20
- ★10
Write a review
Most Relevant Reviews
by Thorsten Enghave
March 4, 2022
Attractive design and informative presentation.by Ana Paula
March 4, 2022
Very well designed and informative templates.
View per page:
10

