AI PPT Maker
 Templates
 PPT Bundles
 Design Services
 Business PPTs
 Business Plan
 Management
 Strategy
 Introduction PPT
 Roadmap
 Self Introduction
 Timelines
 Process
 Marketing
 Agenda
 Technology
 Medical
 Startup Business Plan
 Cyber Security
 Dashboards
 SWOT
SWOT Proposals
 Education
 Pitch Deck
 Digital Marketing
 KPIs
KPIs Project Management
 Product Management
 Artificial Intelligence
 Target Market
 Communication
 Supply Chain
 Google Slides
 Research Services
 One Pagers
 All Categories
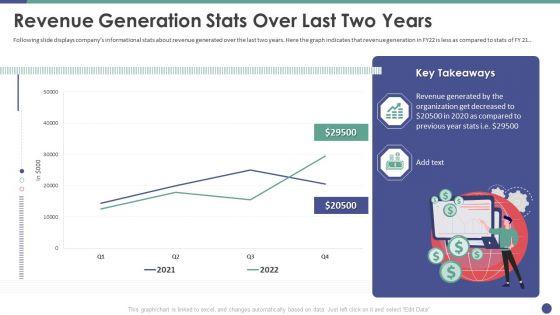
QC Engineering Revenue Generation Stats Over Last Two Years Ppt Portfolio Graphics Tutorials PDF


Features of these PowerPoint presentation slides:
Following slide displays companys informational stats about revenue generated over the last two years. Here the graph indicates that revenue generation in FY22 is less as compared to stats of FY21. Deliver an awe inspiring pitch with this creative qc engineering revenue generation stats over last two years ppt portfolio graphics tutorials pdf bundle. Topics like revenue generation stats over last two years can be discussed with this completely editable template. It is available for immediate download depending on the needs and requirements of the user.
People who downloaded this PowerPoint presentation also viewed the following :
Related Products
QC Engineering Revenue Generation Stats Over Last Two Years Ppt Portfolio Graphics Tutorials PDF with all 2 slides: