- Sign up
- Sign In
 AI PPT Maker
 Templates
 PPT Bundles
 Design Services
 Business PPTs
 Business Plan
 Management
 Strategy
 Introduction PPT
 Roadmap
 Self Introduction
 Timelines
 Process
 Marketing
 Agenda
 Technology
 Medical
 Startup Business Plan
 Cyber Security
 Dashboards
 SWOT
SWOT Proposals
 Education
 Pitch Deck
 Digital Marketing
 KPIs
KPIs Project Management
 Product Management
 Artificial Intelligence
 Target Market
 Communication
 Supply Chain
 Google Slides
 Research Services
 One Pagers
 All Categories
Quantitative Data Analysis Representation Methods With Benefits Template PDF


Features of these PowerPoint presentation slides:
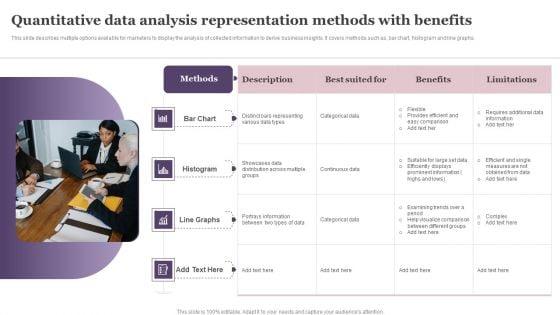
This slide describes multiple options available for marketers to display the analysis of collected information to derive business insights. It covers methods such as, bar chart, histogram and line graphs. Persuade your audience using this Quantitative Data Analysis Representation Methods With Benefits Template PDF. This PPT design covers four stages, thus making it a great tool to use. It also caters to a variety of topics including Bar Chart, Histogram, Line Graphs. Download this PPT design now to present a convincing pitch that not only emphasizes the topic but also showcases your presentation skills.
People who downloaded this PowerPoint presentation also viewed the following :
Keywords:
Related Products
Quantitative Data Analysis Representation Methods With Benefits Template PDF with all 9 slides: