AI PPT Maker
 Templates
 PPT Bundles
 Design Services
 Business PPTs
 Business Plan
 Management
 Strategy
 Introduction PPT
 Roadmap
 Self Introduction
 Timelines
 Process
 Marketing
 Agenda
 Technology
 Medical
 Startup Business Plan
 Cyber Security
 Dashboards
 SWOT
SWOT Proposals
 Education
 Pitch Deck
 Digital Marketing
 KPIs
KPIs Project Management
 Product Management
 Artificial Intelligence
 Target Market
 Communication
 Supply Chain
 Google Slides
 Research Services
 One Pagers
 All Categories
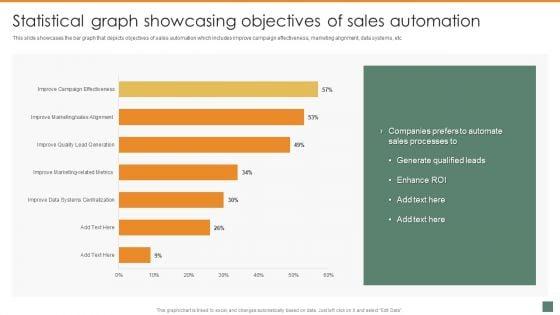
Statistical Graph Showcasing Objectives Of Sales Automation Summary And Significance Of Sales Automation Inspiration PDF


Features of these PowerPoint presentation slides:
This slide showcases the bar graph that depicts objectives of sales automation which includes improve campaign effectiveness, marketing alignment, data systems, etc. The Statistical Graph Showcasing Objectives Of Sales Automation Summary And Significance Of Sales Automation Inspiration PDF is a compilation of the most recent design trends as a series of slides. It is suitable for any subject or industry presentation, containing attractive visuals and photo spots for businesses to clearly express their messages. This template contains a variety of slides for the user to input data, such as structures to contrast two elements, bullet points, and slides for written information. Slidegeeks is prepared to create an impression.
People who downloaded this PowerPoint presentation also viewed the following :
Related Products
Statistical Graph Showcasing Objectives Of Sales Automation Summary And Significance Of Sales Automation Inspiration PDF with all 2 slides: