AI PPT Maker
Templates
PPT Bundles
Design Services
Business PPTs
Business Plan
Management
Strategy
Introduction PPT
Roadmap
Self Introduction
Timelines
Process
Marketing
Agenda
Technology
Medical
Startup Business Plan
Cyber Security
Dashboards
SWOT
Proposals
Education
Pitch Deck
Digital Marketing
KPIs
Project Management
Product Management
Artificial Intelligence
Target Market
Communication
Supply Chain
Google Slides
Research Services
 One Pagers
All Categories
Statistics Showing Annual Comparison Of Multiple Beauty Care Products Ppt Infographics Objects PDF
Features of these PowerPoint presentation slides:
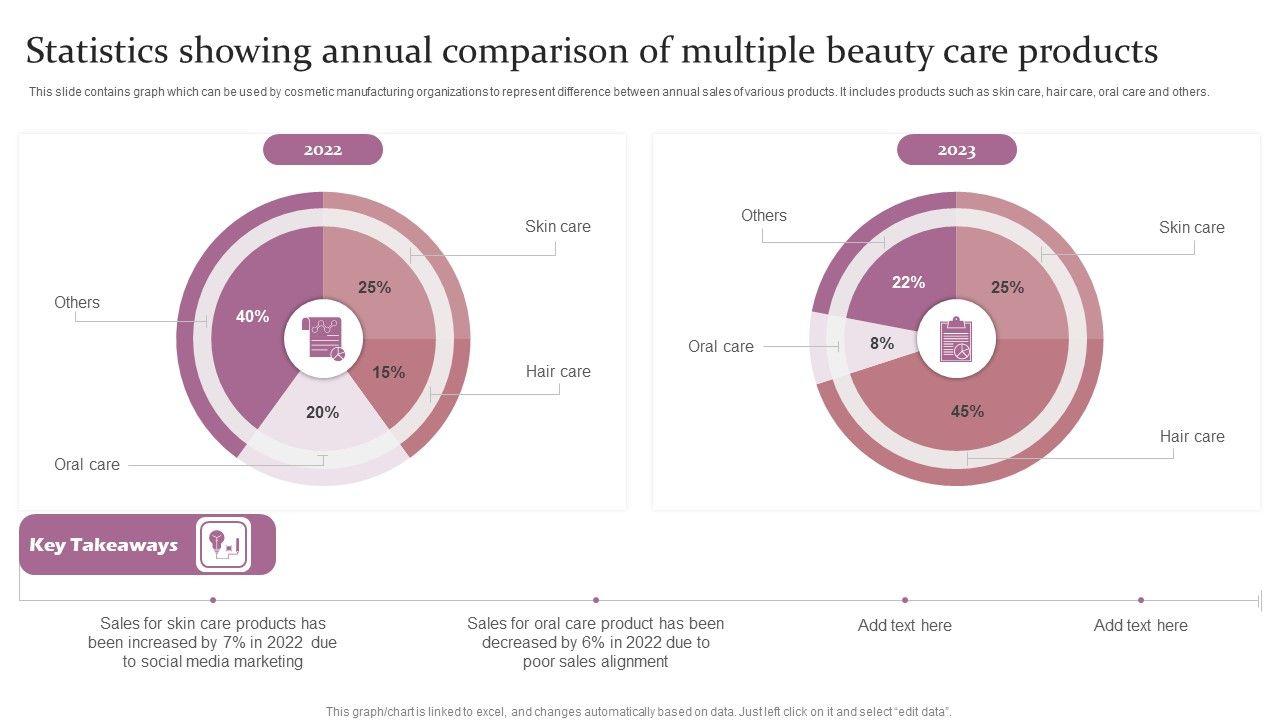
This slide contains graph which can be used by cosmetic manufacturing organizations to represent difference between annual sales of various products. It includes products such as skin care, hair care, oral care and others. Showcasing this set of slides titled Statistics Showing Annual Comparison Of Multiple Beauty Care Products Ppt Infographics Objects PDF. The topics addressed in these templates are Skin Care, Hair Care, 2022 To 2023. All the content presented in this PPT design is completely editable. Download it and make adjustments in color, background, font etc. as per your unique business setting.
People who downloaded this PowerPoint presentation also viewed the following :
Keywords:
Related Products
Statistics Showing Annual Comparison Of Multiple Beauty Care Products Ppt Infographics Objects PDF with all 2 slides:
Ratings and Reviews
5
- ★52
- ★40
- ★30
- ★20
- ★10
Write a review
Most Relevant Reviews
by ali
January 17, 2023
Unique research projects to present in meeting.by raya
January 17, 2023
Much better than the original! Thanks for the quick turnaround.
View per page:
10


