Call Center Dashboard PowerPoint Templates
-
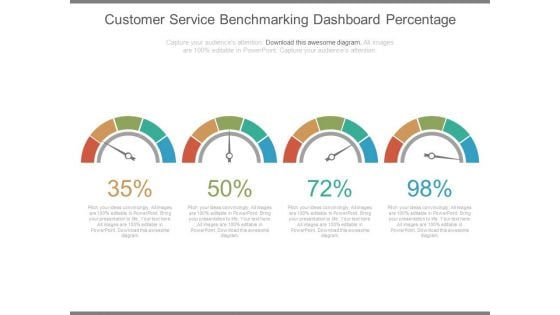
Customer Service Benchmarking Dashboard Percentage Ppt Slides
This is a customer service benchmarking dashboard percentage ppt slides. This is a four stage process. The stages in this process are finance, business, marketing.
-
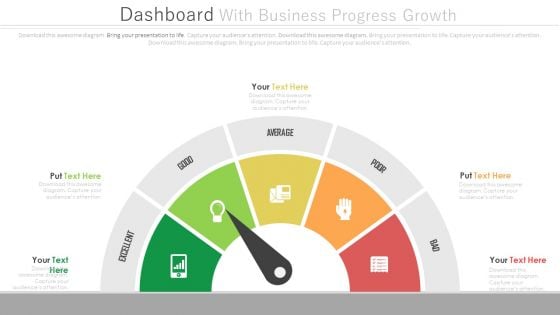
Dashboard To Simplify Business Data Analysis Powerpoint Slides
This PowerPoint template graphics of meter chart. Download this PPT chart to simplify business data analysis. This PowerPoint slide is of great help in the business sector to make realistic presentations and provides effective way of presenting your newer thoughts.
-
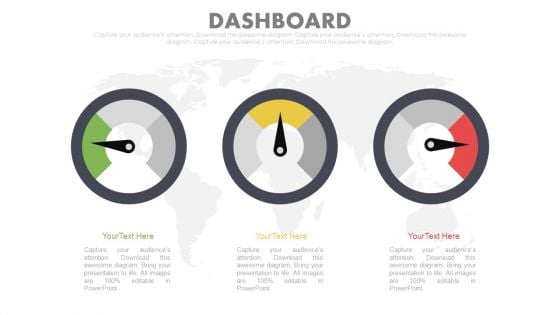
Three Dashboard For Risk Management Techniques Powerpoint Slides
This PowerPoint template has been designed with three dashboards. You may use this slide to display risk management techniques. Refine your thoughts with this slide. Narrow them down to the very best.
-
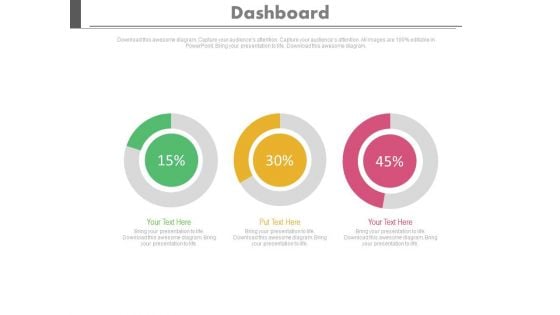
Three Dashboard With Percentage Value Growth Powerpoint Slides
This PowerPoint template has been designed with three dashboards. Use this PPT slide to depict rise in business profit. This professional diagram slide will help you express your views to target audience.
-
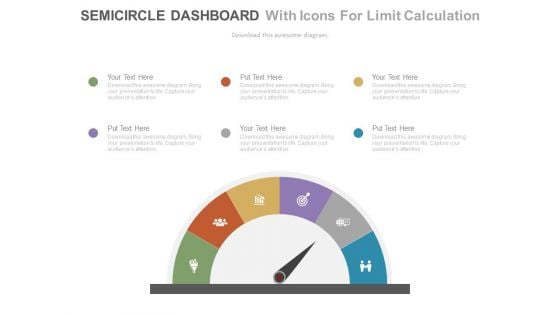
Dashboard With Business Icons Powerpoint Slides
This PowerPoint template graphics of meter chart with business icons. Download this PPT chart to simplify business data analysis. This PowerPoint slide is of great help in the business sector to make realistic presentations and provides effective way of presenting your newer thoughts.
-
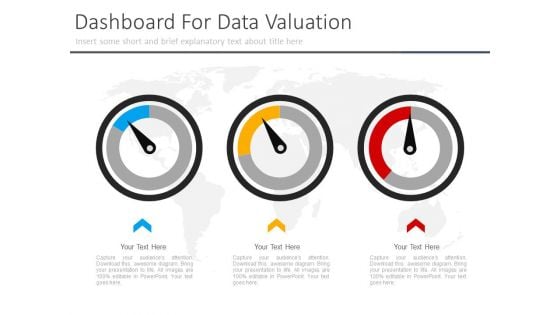
Three Dashboard For Corporate Level Strategy Powerpoint Slides
This PowerPoint template has been designed with three dashboards. You may use this slide to display corporate level strategy. This diagram provides an effective way of displaying information you can edit text, color, shade and style as per you need.
-
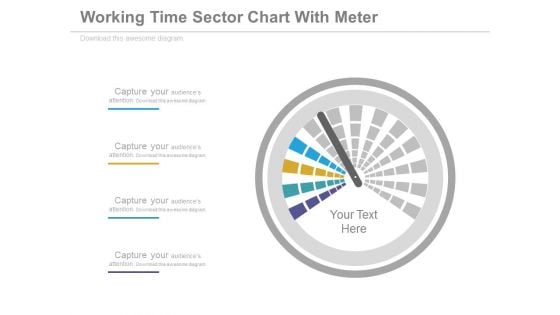
Dashboard Performance Analysis Chart Powerpoint Slides
This PowerPoint template graphics of meter chart. Download this PPT chart for business performance analysis. This PowerPoint slide is of great help in the business sector to make realistic presentations and provides effective way of presenting your newer thoughts.

 Home
Home