Charts and Graphs PowerPoint Templates
-
Monthly Product Sales Analysis Dashboard Infographics PDF
This slide illustrates a dashboard for product sales review to measure to help business monitor and improve productivity, employee engagement and meet revenue targets. It covers product names with sales reps, lead conversion, response time and outbound calls. Showcasing this set of slides titled Monthly Product Sales Analysis Dashboard Infographics PDF. The topics addressed in these templates are Lead Conversion Rate, Outbound Calls, Sales Analysis Dashboard. All the content presented in this PPT design is completely editable. Download it and make adjustments in color, background, font etc. as per your unique business setting.
-
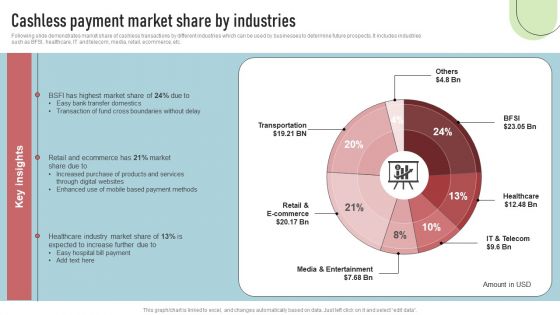
Cashless Payment Strategies To Enhance Business Performance Cashless Payment Market Share By Industries Clipart PDF
Following slide demonstrates market share of cashless transactions by different industries which can be used by businesses to determine future prospects. It includes industries such as BFSI, healthcare, IT and telecom, media, retail, ecommerce, etc. Find a pre-designed and impeccable Cashless Payment Strategies To Enhance Business Performance Cashless Payment Market Share By Industries Clipart PDF. The templates can ace your presentation without additional effort. You can download these easy-to-edit presentation templates to make your presentation stand out from others. So, what are you waiting for Download the template from Slidegeeks today and give a unique touch to your presentation.
-
Dashboard Tracking Warehouse Capacity And Utilization Metrics Icons PDF
This slide represents a dashboard providing an enterprise-level view of warehouse capacity and utilization to enable process improvements. It monitors KPIs such as shelf capacity used by inventory type, storage device, honeycomb percentage, days on hand by inventory type, and by items. Create an editable Dashboard Tracking Warehouse Capacity And Utilization Metrics Icons PDF that communicates your idea and engages your audience. Whether you are presenting a business or an educational presentation, pre-designed presentation templates help save time. Dashboard Tracking Warehouse Capacity And Utilization Metrics Icons PDF is highly customizable and very easy to edit, covering many different styles from creative to business presentations. Slidegeeks has creative team members who have crafted amazing templates. So, go and get them without any delay.
-
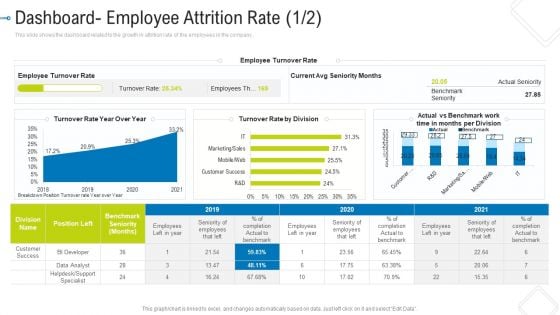
Dashboard Employee Attrition Rate Seniority Template PDF
This slide shows the dashboard related to the growth in attrition rate of the employees in the company .Deliver an awe inspiring pitch with this creative dashboard employee attrition rate seniority template pdf bundle. Topics like employee turnover rate, benchmark seniority, current avg seniority months can be discussed with this completely editable template. It is available for immediate download depending on the needs and requirements of the user.
-
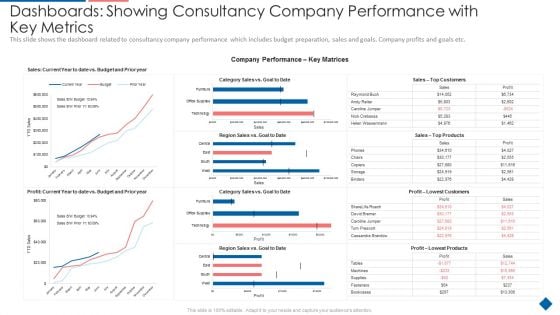
Dashboards Showing Consultancy Company Performance With Key Metrics Mockup PDF
Deliver and pitch your topic in the best possible manner with this dashboards showing consultancy company performance with key metrics mockup pdf. Use them to share invaluable insights on customers, top products, lowest customers, and impress your audience. This template can be altered and modified as per your expectations. So, grab it now.
-
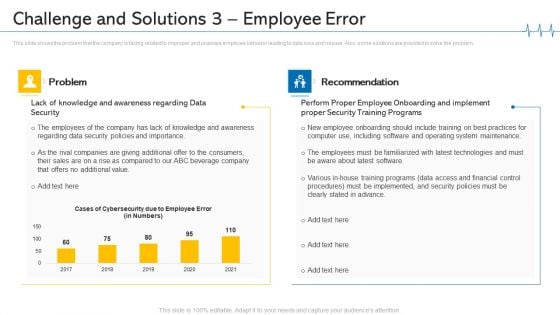
Minimize Cloud Risks Medical Care Business Case Competition Challenge And Solutions 3 Employee Error Portrait PDF
This slide shows the problem that the company is facing related to improper and unaware employee behavior leading to data loss and misuse. Also, some solutions are provided to solve the problem. Deliver and pitch your topic in the best possible manner with this minimize cloud risks medical care business case competition challenge and solutions 3 employee error portrait pdf. Use them to share invaluable insights on security training programs, operating system maintenance, financial control procedures, training programs and impress your audience. This template can be altered and modified as per your expectations. So, grab it now.
-
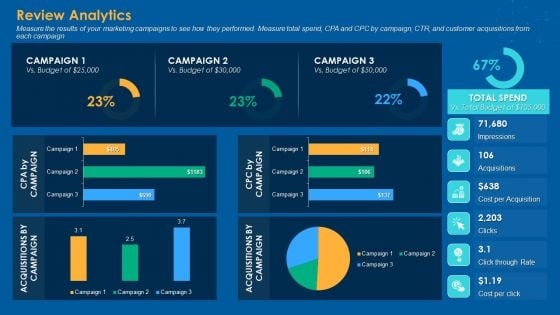
Review Analytics Elements PDF
Deliver and pitch your topic in the best possible manner with this review analytics elements pdf. Use them to share invaluable insights on impressions, acquisitions, cost per acquisition, click through rate, cost per click and impress your audience. This template can be altered and modified as per your expectations. So, grab it now.
-
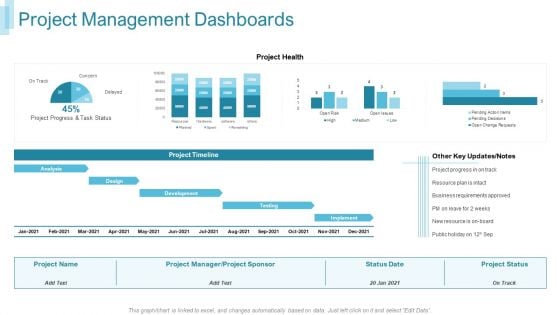
Team Forming IT Project Project Management Dashboards Ppt Ideas Clipart PDF
Deliver an awe-inspiring pitch with this creative team forming it project project management dashboards ppt ideas clipart pdf bundle. Topics like project timeline, analysis, development, implement can be discussed with this completely editable template. It is available for immediate download depending on the needs and requirements of the user.
-
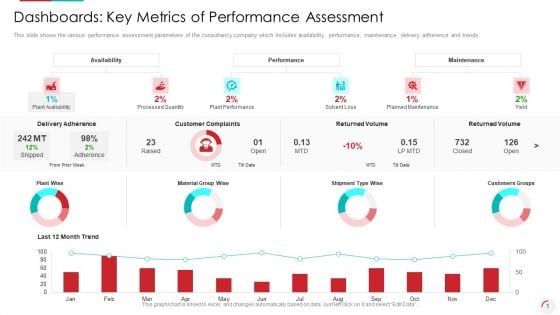
Dashboards Key Metrics Of Performance Assessment Summary PDF
Deliver and pitch your topic in the best possible manner with this dashboards key metrics of performance assessment summary pdf. Use them to share invaluable insights on delivery adherence, customer complaints, returned volume and impress your audience. This template can be altered and modified as per your expectations. So, grab it now.
-
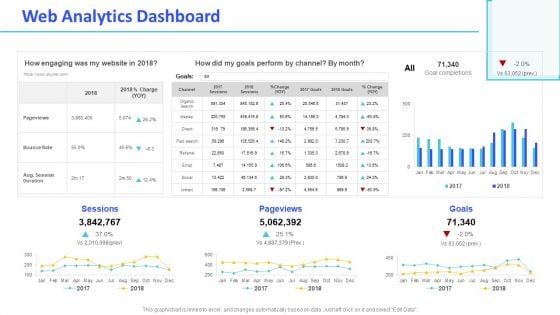
Monthly Digital Marketing Report Template Web Analytics Dashboard Mockup PDF
Deliver and pitch your topic in the best possible manner with this monthly digital marketing report template web analytics dashboard mockup pdf. Use them to share invaluable insights on web analytics dashboard and impress your audience. This template can be altered and modified as per your expectations. So, grab it now.
-
Bar Graph Ppt PowerPoint Presentation File Slides
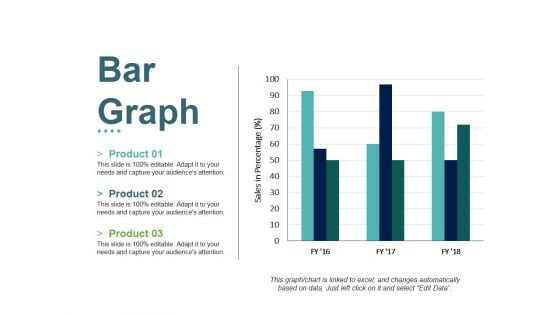
This is a bar graph ppt powerpoint presentation file slides. This is a three stage process. The stages in this process are product, sales in percentage, bar graph, growth, success.
-
Sales KPI Performance Summary Ppt PowerPoint Presentation Infographics Model
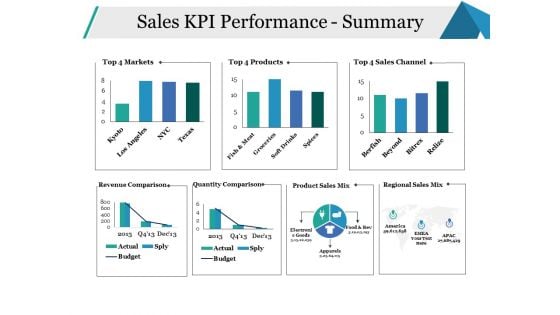
This is a sales kpi performance summary ppt powerpoint presentation infographics model. This is a seven stage process. The stages in this process are sales channel, revenue comparison, quantity comparison, business, marketing.
-
Pie Chart Ppt PowerPoint Presentation Layouts Gridlines
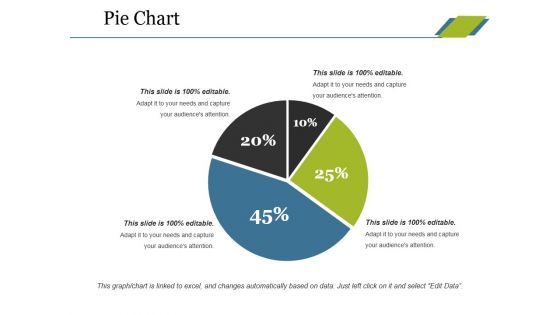
This is a pie chart ppt powerpoint presentation layouts gridlines. This is a four stage process. The stages in this process are pie, process, percentage, finance, business.
-
Commodity Channel Segmentation Product Management Kpi Sales Metrics Summary PDF
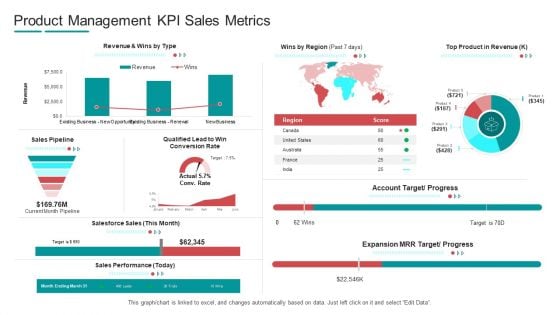
Deliver an awe inspiring pitch with this creative commodity channel segmentation product management kpi sales metrics summary pdf bundle. Topics like revenue, product, account target, progress can be discussed with this completely editable template. It is available for immediate download depending on the needs and requirements of the user.
-
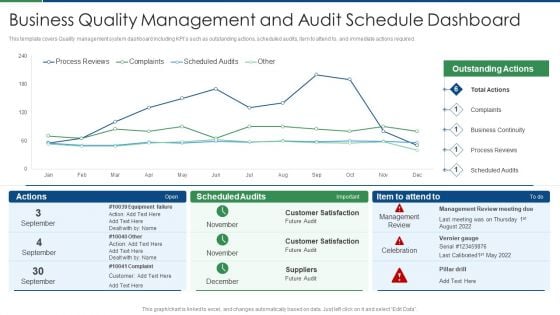
Business Quality Management And Audit Schedule Dashboard Themes PDF
This template covers Quality management system dashboard including KPIs such as outstanding actions, scheduled audits, item to attend to, and immediate actions required. Deliver an awe inspiring pitch with this creative business quality management and audit schedule dashboard themes pdf bundle. Topics like business continuity, scheduled audits, process reviews, complaints can be discussed with this completely editable template. It is available for immediate download depending on the needs and requirements of the user.
-
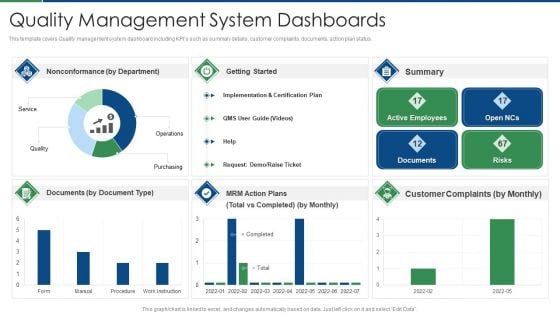
International Standard For Quality Management System Quality Management System Dashboards Themes PDF
This template covers Quality management system dashboard including KPIs such as summary details, customer complaints, documents, action plan status. Deliver an awe inspiring pitch with this creative international standard for quality management system quality management system dashboards themes pdf bundle. Topics like customer complaints, documents, nonconformance, implementation can be discussed with this completely editable template. It is available for immediate download depending on the needs and requirements of the user.
-
Roadmap For Financial Accounting Transformation Accounting Statement Profit And Loss Analysis Dashboard Clipart PDF
Deliver an awe inspiring pitch with this creative roadmap for financial accounting transformation accounting statement profit and loss analysis dashboard clipart pdf bundle. Topics like profit and loss statements, p and l structure dynamics, sales or margin quality performance analysis, creditworthiness assessment, debt coverage ratios can be discussed with this completely editable template. It is available for immediate download depending on the needs and requirements of the user.
-
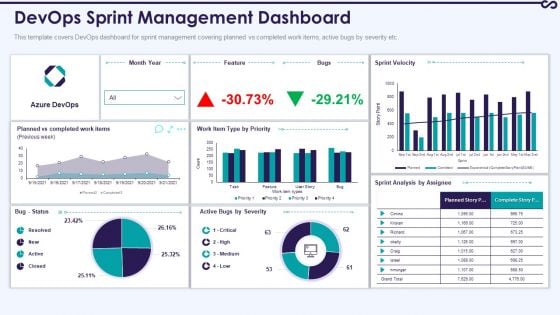
Development And Operations KPI Dashboard IT Devops Sprint Management Dashboard Portrait PDF
This template covers DevOps dashboard for sprint management covering planned vs completed work items, active bugs by severity etc. Deliver an awe inspiring pitch with this creative development and operations kpi dashboard it devops sprint management dashboard portrait pdf bundle. Topics like devops sprint management dashboard can be discussed with this completely editable template. It is available for immediate download depending on the needs and requirements of the user.
-
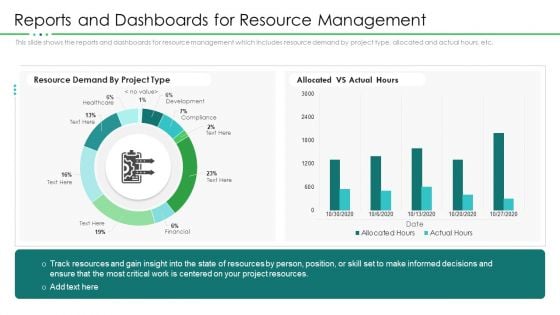
Project Resource Planning Reports And Dashboards For Resource Management Ideas PDF
This slide shows the reports and dashboards for resource management which includes resource demand by project type, allocated and actual hours, etc. Deliver an awe inspiring pitch with this creative project resource planning reports and dashboards for resource management ideas pdf bundle. Topics like reports and dashboards for resource management can be discussed with this completely editable template. It is available for immediate download depending on the needs and requirements of the user.
-
Data Analysis Excel 3d Pie Chart For Marketing Process PowerPoint Templates
Our data analysis excel 3d pie chart for marketing process Powerpoint Templates Team Are A Dogged Lot. They Keep At It Till They Get It Right.
-
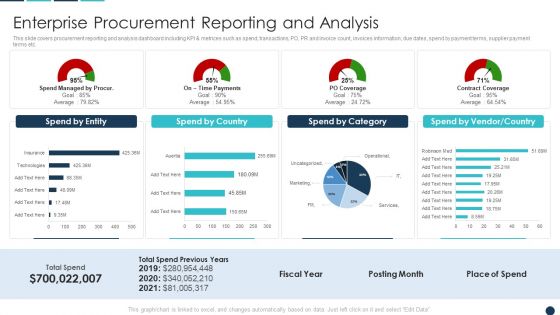
Procurement Analytics Tools And Strategies Enterprise Procurement Reporting Infographics PDF
This slide covers procurement reporting and analysis dashboard including KPI metrices such as spend, transactions, PO, PR and invoice count, invoices information, due dates, spend by payment terms, supplier payment terms etc. Deliver an awe inspiring pitch with this creative Procurement Analytics Tools And Strategies Enterprise Procurement Reporting Infographics PDF bundle. Topics like Spend By Country, Spend Category, Vendor Country can be discussed with this completely editable template. It is available for immediate download depending on the needs and requirements of the user.
-
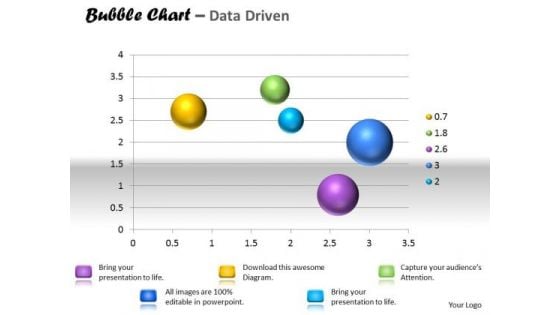
Data Analysis Template Interactive Bubble Chart PowerPoint Templates
Our data analysis template interactive bubble chart Powerpoint Templates Are A Wonder Drug. They Help Cure Almost Any Malaise.
-
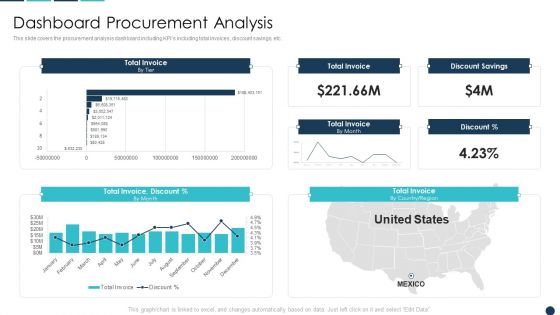
Procurement Analytics Tools And Strategies Dashboard Procurement Analysis Inspiration PDF
This slide covers the procurement analysis dashboard including KPIs including total invoices, discount savings, etc. Deliver and pitch your topic in the best possible manner with this Procurement Analytics Tools And Strategies Dashboard Procurement Analysis Inspiration PDF. Use them to share invaluable insights on Total Invoice, Discount Savings, Invoice Discount and impress your audience. This template can be altered and modified as per your expectations. So, grab it now.
-
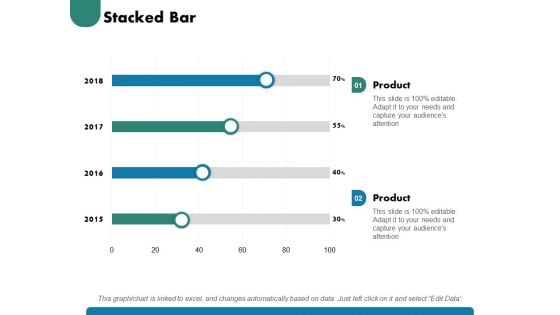
Stacked Bar Ppt PowerPoint Presentation Slides Demonstration
This is a stacked bar ppt powerpoint presentation slides demonstration. This is a two stage process. The stages in this process are stacked bar, finance, marketing, management, investment, analysis.
-
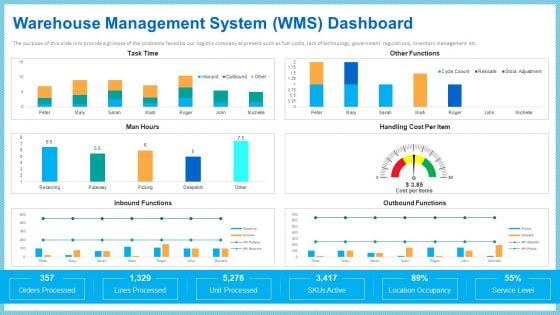
Warehouse Management System Functions Structure PDF
The purpose of this slide is to provide a glimpse of the problems faced by our logistic company at present such as fuel costs, lack of technology, government regulations, inventory management etc. Deliver an awe inspiring pitch with this creative warehouse management system functions structure pdf bundle. Topics like warehouse management system wms dashboard can be discussed with this completely editable template. It is available for immediate download depending on the needs and requirements of the user.
-
Warehouse Management System Wms Dashboard Mockup PDF
The purpose of this slide is to provide a glimpse of the problems faced by our logistic company at present such as fuel costs, lack of technology, government regulations, inventory management etc. Deliver and pitch your topic in the best possible manner with this warehouse management system wms dashboard mockup pdf. Use them to share invaluable insights on order status graph, warehouse capacity, warehouse status and impress your audience. This template can be altered and modified as per your expectations. So, grab it now.
-
Vendor Compliance Monitoring Dashboard Template PDF
Following slide shows vendor compliance monitoring dashboard. It covers KPIs namely top supplier by partner status, average procurement cycle time and average procurement cycle. Deliver an awe-inspiring pitch with this creative vendor compliance monitoring dashboard template pdf. bundle. Topics like rate of contract compliance by supplier category, procurement cycle time, procurement cycle, top suppliers by partner status can be discussed with this completely editable template. It is available for immediate download depending on the needs and requirements of the user.
-
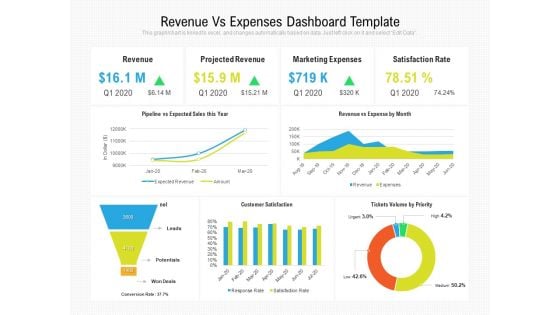
Revenue Vs Expenses Dashboard Template Ppt PowerPoint Presentation Slides Tips PDF
Presenting this set of slides with name revenue vs expenses dashboard template ppt powerpoint presentation slides tips pdf. The topics discussed in these slides are revenue, projected revenue, marketing expenses, satisfaction rate, pipeline vs expected sales this year, revenue vs expense by month, customer satisfaction, tickets volume by priority. This is a completely editable PowerPoint presentation and is available for immediate download. Download now and impress your audience.
-
Managing Employee Turnover Dashboard For Employee Retention Polices Ideas PDF
Purpose of the following slide is to show the Employee Attrition dashboard as it highlights the Employee turnover rate, average seniority of employees in months, year-over-year turnover rate etc.Deliver an awe inspiring pitch with this creative Managing Employee Turnover Dashboard For Employee Retention Polices Ideas PDF bundle. Topics like Turnover Rate, Employees These, Actual Seniority can be discussed with this completely editable template. It is available for immediate download depending on the needs and requirements of the user.
-
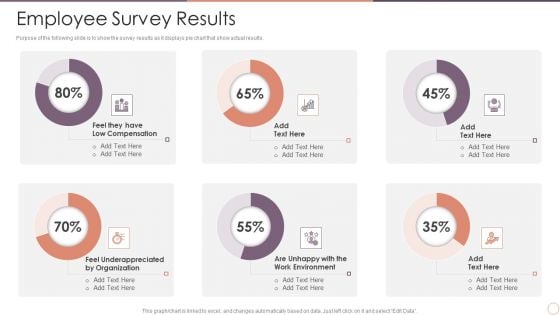
Managing Employee Turnover Employee Survey Results Microsoft PDF
Purpose of the following slide is to show the survey results as it displays pie chart that show actual results. Deliver an awe inspiring pitch with this creative Managing Employee Turnover Employee Survey Results Microsoft PDF bundle. Topics like Low Compensation, Underappreciated, Work Environment can be discussed with this completely editable template. It is available for immediate download depending on the needs and requirements of the user.
-
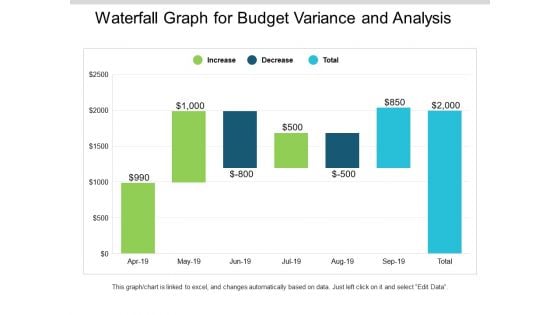
Waterfall Graph For Budget Variance And Analysis Ppt PowerPoint Presentation Slides Mockup
This is a waterfall graph for budget variance and analysis ppt powerpoint presentation slides mockup. This is a three stage process. The stages in this process are profit and loss, balance sheet, income statement, benefit and loss.
-
Business Diagram Four Pie Chart For Data Driven Result Analysis Of Business PowerPoint Slide
This business diagram displays graphic of pie charts in shape of flasks. This business slide is suitable to present and compare business data. Use this diagram to build professional presentations for your viewers.
-
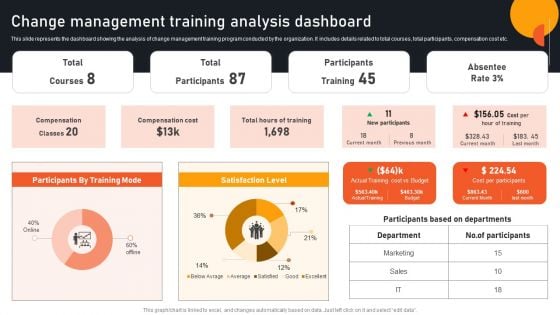
Transform Management Instruction Schedule Change Management Training Analysis Pictures PDF
This slide represents the dashboard showing the analysis of change management training program conducted by the organization. It includes details related to total courses, total participants, compensation cost etc. Coming up with a presentation necessitates that the majority of the effort goes into the content and the message you intend to convey. The visuals of a PowerPoint presentation can only be effective if it supplements and supports the story that is being told. Keeping this in mind our experts created Transform Management Instruction Schedule Change Management Training Analysis Pictures PDF to reduce the time that goes into designing the presentation. This way, you can concentrate on the message while our designers take care of providing you with the right template for the situation.
-
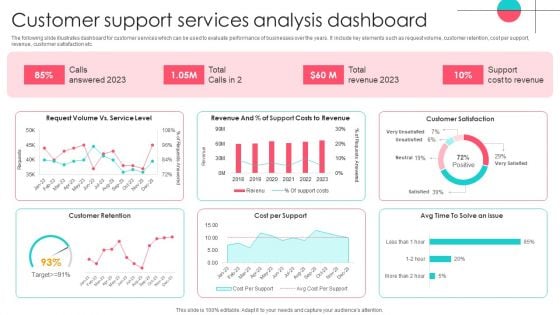
Customer Support Services Analysis Dashboard Template PDF
The following slide illustrates dashboard for customer services which can be used to evaluate performance of businesses over the years. It include key elements such as request volume, customer retention, cost per support, revenue, customer satisfaction etc. Showcasing this set of slides titled Customer Support Services Analysis Dashboard Template PDF. The topics addressed in these templates are Customer Support Services, Analysis Dashboard. All the content presented in this PPT design is completely editable. Download it and make adjustments in color, background, font etc. as per your unique business setting.
-
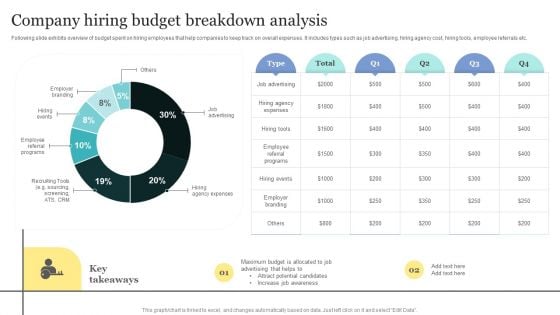
Strategic Approaches To Efficient Candidate Selection Company Hiring Budget Breakdown Analysis Elements PDF
Following slide exhibits overview of budget spent on hiring employees that help companies to keep track on overall expenses. It includes types such as job advertising, hiring agency cost, hiring tools, employee referrals etc. Find a pre-designed and impeccable Strategic Approaches To Efficient Candidate Selection Company Hiring Budget Breakdown Analysis Elements PDF. The templates can ace your presentation without additional effort. You can download these easy-to-edit presentation templates to make your presentation stand out from others. So, what are you waiting for Download the template from Slidegeeks today and give a unique touch to your presentation.
-
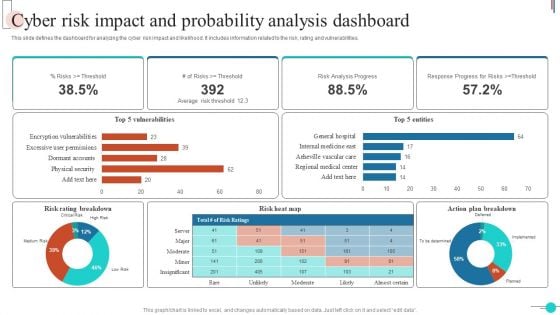
Cyber Risk Impact And Probability Analysis Dashboard Brochure PDF
This slide defines the dashboard for analyzing the cyber risk impact and likelihood. It includes information related to the risk, rating and vulnerabilities. Showcasing this set of slides titled Cyber Risk Impact And Probability Analysis Dashboard Brochure PDF. The topics addressed in these templates are Risk Heat Map, Risk Rating Breakdown, Vulnerabilities. All the content presented in this PPT design is completely editable. Download it and make adjustments in color, background, font etc. as per your unique business setting.
-
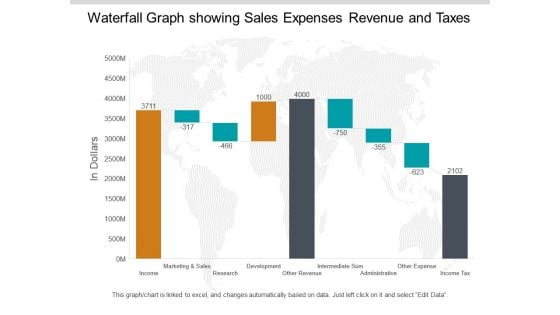
Waterfall Graph Showing Sales Expenses Revenue And Taxes Ppt PowerPoint Presentation Pictures Summary
This is a waterfall graph showing sales expenses revenue and taxes ppt powerpoint presentation pictures summary. This is a three stage process. The stages in this process are profit and loss, balance sheet, income statement, benefit and loss.
-
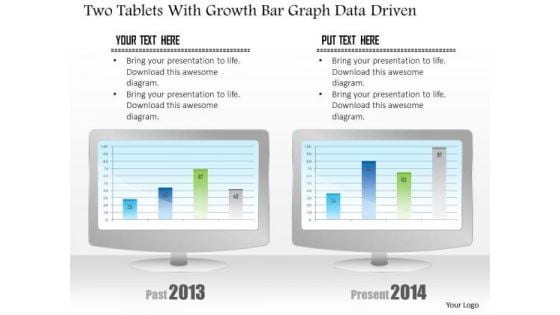
Business Diagram Two Tablets With Growth Bar Graph Data Driven PowerPoint Slide
This business diagram has been designed with comparative charts on tablets. This slide suitable for data representation. You can also use this slide to present business reports and information. Use this diagram to present your views in a wonderful manner.
-
Human Resource Metrics Dashboard Ppt PowerPoint Presentation Layouts Icons PDF
Presenting this set of slides with name human resource metrics dashboard ppt powerpoint presentation layouts icons pdf. The topics discussed in these slide is total applicants, shortlisted candidates, hired candidates, rejected candidates, time to hire, cost to hire. This is a completely editable PowerPoint presentation and is available for immediate download. Download now and impress your audience.
-
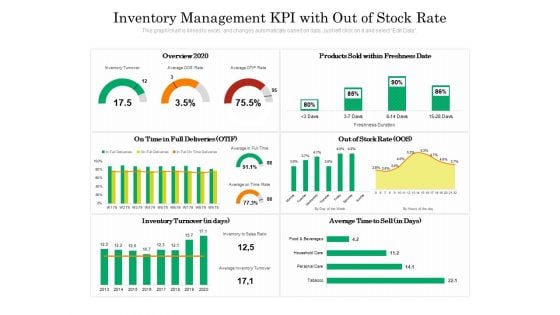
Inventory Management KPI With Out Of Stock Rate Ppt PowerPoint Presentation Gallery Background PDF
Presenting this set of slides with name inventory management kpi with out of stock rate ppt powerpoint presentation gallery background pdf. The topics discussed in these slides are inventor, average, deliveries. This is a completely editable PowerPoint presentation and is available for immediate download. Download now and impress your audience.
-
Human Resource Annual Report With Headcount Ppt PowerPoint Presentation Icon Influencers PDF
Presenting this set of slides with name human resource annual report with headcount ppt powerpoint presentation icon influencers pdf. The topics discussed in these slides are starters, headcount, leavers, promotions, male, female, 2019 to 2020. This is a completely editable PowerPoint presentation and is available for immediate download. Download now and impress your audience.
-
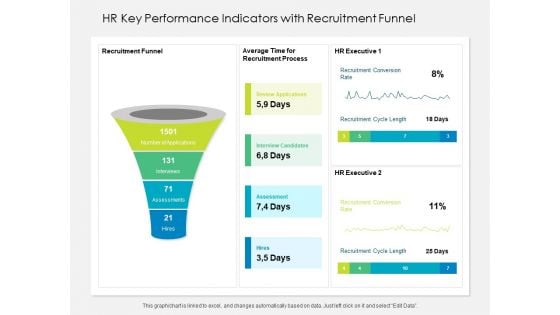
HR Key Performance Indicators With Recruitment Funnel Ppt PowerPoint Presentation File Formats PDF
Presenting this set of slides with name hr key performance indicators with recruitment funnel ppt powerpoint presentation file formats pdf. The topics discussed in these slides are funnel, process, recruitment. This is a completely editable PowerPoint presentation and is available for immediate download. Download now and impress your audience.
-
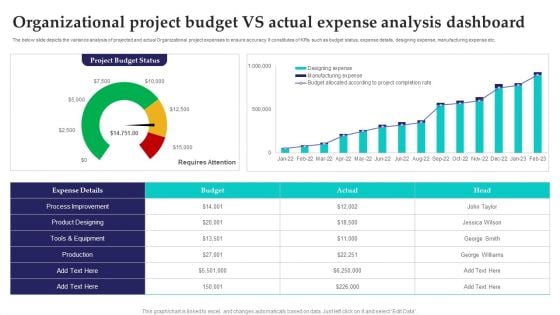
Organizational Project Budget Vs Actual Expense Analysis Dashboard Sample PDF
Showcasing this set of slides titled Organizational Project Budget Vs Actual Expense Analysis Dashboard Sample PDF. The topics addressed in these templates are Process Improvement, Equipment, Budget. All the content presented in this PPT design is completely editable. Download it and make adjustments in color, background, font etc. as per your unique business setting.
-
Project Tracking Issue Tracker Dashboard Rules PDF
The following slide highlights the project tracking issues in project management to determine and resolve them quickly. It includes metrics such as issue summary, priorities, responsible head, reporting and closing date etc. Showcasing this set of slides titled Project Tracking Issue Tracker Dashboard Rules PDF. The topics addressed in these templates are Inappropriate Supplies, Project, Tracker Dashboard. All the content presented in this PPT design is completely editable. Download it and make adjustments in color, background, font etc. as per your unique business setting.
-
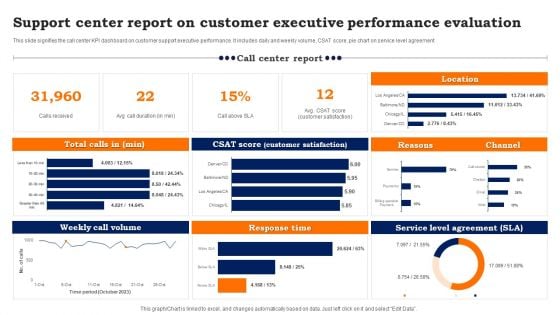
Support Center Report On Customer Executive Performance Evaluation Background PDF
This slide signifies the call center KPI dashboard on customer support executive performance. It includes daily and weekly volume, CSAT score, pie chart on service level agreement. Pitch your topic with ease and precision using this Support Center Report On Customer Executive Performance Evaluation Background PDF. This layout presents information on Weekly Call Volume, Response Time, Service Level Agreement. It is also available for immediate download and adjustment. So, changes can be made in the color, design, graphics or any other component to create a unique layout.
-
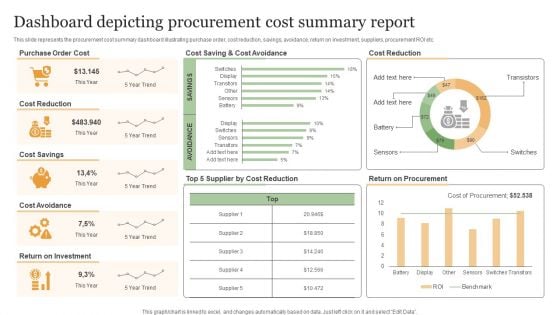
Dashboard Depicting Procurement Cost Summary Report Microsoft PDF
This slide represents the procurement cost summary dashboard illustrating purchase order, cost reduction, savings, avoidance, return on investment, suppliers, procurement ROI etc. Pitch your topic with ease and precision using this Dashboard Depicting Procurement Cost Summary Report Microsoft PDF. This layout presents information on Purchase Order Cost, Cost Reduction, Cost Savings. It is also available for immediate download and adjustment. So, changes can be made in the color, design, graphics or any other component to create a unique layout.
-
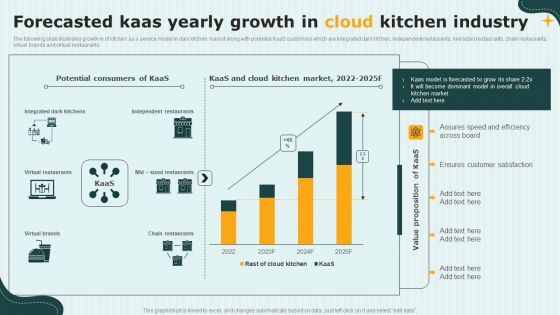
International Cloud Kitchen Industry Analysis Forecasted Kaas Yearly Growth In Cloud Kitchen Industry Slides PDF
The following slide illustrates growth in of kitchen as a service model in dark kitchen market along with potential KaaS customers which are integrated dark kitchen, independent restaurants, mid sized restaurants, chain restaurants, virtual brands and virtual restaurants. Coming up with a presentation necessitates that the majority of the effort goes into the content and the message you intend to convey. The visuals of a PowerPoint presentation can only be effective if it supplements and supports the story that is being told. Keeping this in mind our experts created International Cloud Kitchen Industry Analysis Forecasted Kaas Yearly Growth In Cloud Kitchen Industry Slides PDF to reduce the time that goes into designing the presentation. This way, you can concentrate on the message while our designers take care of providing you with the right template for the situation.
-
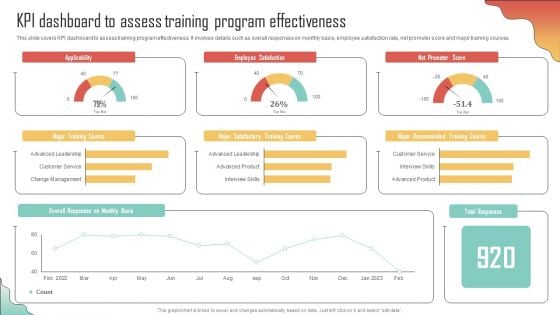
KPI Dashboard Assess Training Program Effectiveness Enhancing Organization Productivity By Implementing Graphics PDF
This slide covers KPI dashboard to assess training program effectiveness. It involves details such as overall responses on monthly basis, employee satisfaction rate, net promoter score and major training courses. If you are looking for a format to display your unique thoughts, then the professionally designed KPI Dashboard Assess Training Program Effectiveness Enhancing Organization Productivity By Implementing Graphics PDF is the one for you. You can use it as a Google Slides template or a PowerPoint template. Incorporate impressive visuals, symbols, images, and other charts. Modify or reorganize the text boxes as you desire. Experiment with shade schemes and font pairings. Alter, share or cooperate with other people on your work. Download KPI Dashboard Assess Training Program Effectiveness Enhancing Organization Productivity By Implementing Graphics PDF and find out how to give a successful presentation. Present a perfect display to your team and make your presentation unforgettable.
-
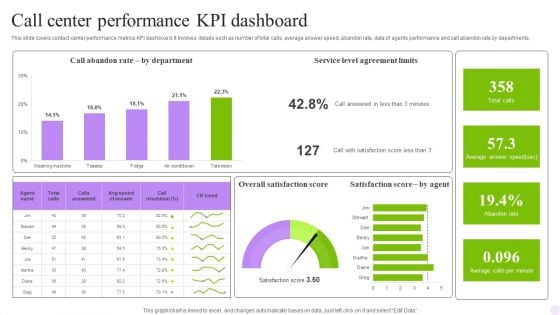
Call Center Performance KPI Dashboard Formats PDF
This slide covers contact center performance metrics KPI dashboard. It involves details such as number of total calls, average answer speed, abandon rate, data of agents performance and call abandon rate by departments. Showcasing this set of slides titled Call Center Performance KPI Dashboard Formats PDF. The topics addressed in these templates are Department, Dashboard, Agreement Limits. All the content presented in this PPT design is completely editable. Download it and make adjustments in color, background, font etc. as per your unique business setting.
-
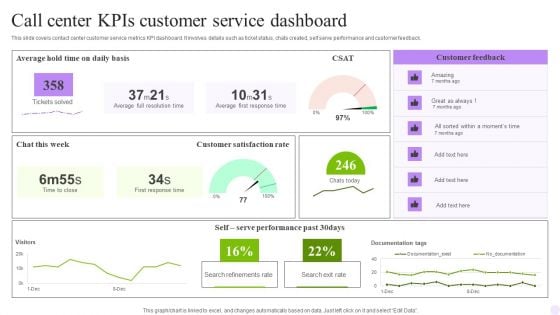
Call Center Kpis Customer Service Dashboard Pictures PDF
This slide covers contact center customer service metrics KPI dashboard. It involves details such as ticket status, chats created, self serve performance and customer feedback. Pitch your topic with ease and precision using this Call Center Kpis Customer Service Dashboard Pictures PDF. This layout presents information on Response Time, Customer, Dashboard. It is also available for immediate download and adjustment. So, changes can be made in the color, design, graphics or any other component to create a unique layout.
-
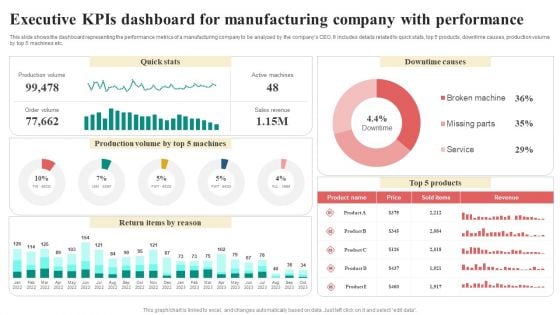
Executive Kpis Dashboard For Manufacturing Company With Performance Infographics PDF
This slide shows the dashboard representing the performance metrics of a manufacturing company to be analyzed by the companys CEO. It includes details related to quick stats, top 5 products, downtime causes, production volume by top 5 machines etc. Showcasing this set of slides titled Executive Kpis Dashboard For Manufacturing Company With Performance Infographics PDF. The topics addressed in these templates are Return Items By Reason, Quick Stats, Downtime Causes, Revenue. All the content presented in this PPT design is completely editable. Download it and make adjustments in color, background, font etc. as per your unique business setting.
-
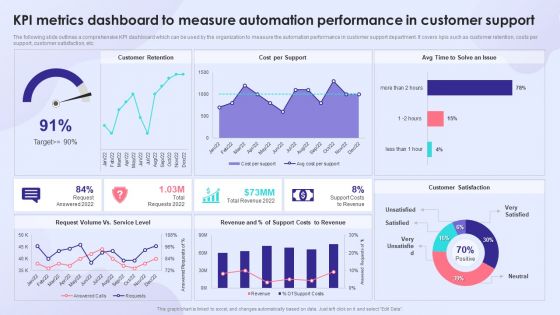
KPI Metrics Dashboard To Measure Automation Performance In Customer Support Professional PDF
The following slide outlines a comprehensive KPI dashboard which can be used by the organization to measure the automation performance in customer support department. It covers kpis such as customer retention, costs per support, customer satisfaction, etc. Deliver and pitch your topic in the best possible manner with this KPI Metrics Dashboard To Measure Automation Performance In Customer Support Professional PDF. Use them to share invaluable insights on Customer Retention, Cost Per Support, Support Costs To Revenue and impress your audience. This template can be altered and modified as per your expectations. So, grab it now.
-
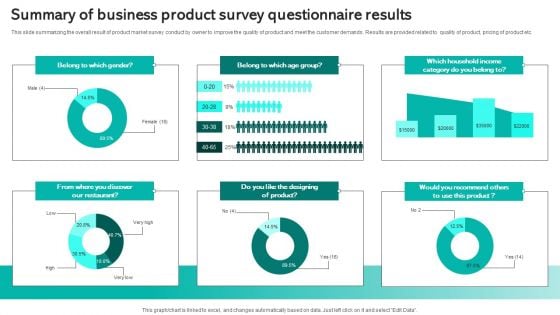
Summary Of Business Product Survey Questionnaire Results Survey SS
This slide summarizing the overall result of product market survey conduct by owner to improve the quality of product and meet the customer demands . Results are provided related to quality of product, pricing of product etc. Pitch your topic with ease and precision using this Summary Of Business Product Survey Questionnaire Results Survey SS. This layout presents information on Summary Of Business, Product Survey, Questionnaire Results. It is also available for immediate download and adjustment. So, changes can be made in the color, design, graphics or any other component to create a unique layout.
-
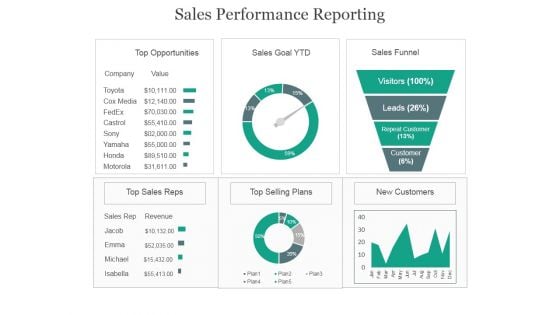
Sales Performance Reporting Ppt PowerPoint Presentation Model
This is a sales performance reporting ppt powerpoint presentation model. This is a six stage process. The stages in this process are top opportunities, sales goal ytd, sales funnel, top sales reps, top selling plans, new customers.
-
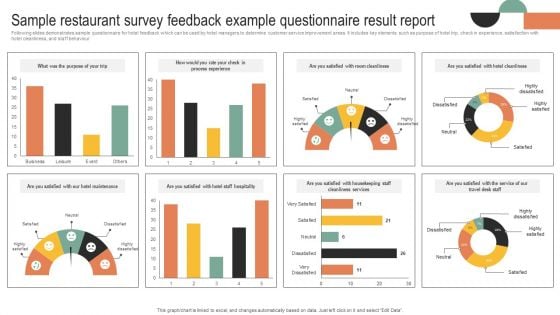
Sample Restaurant Survey Feedback Example Questionnaire Result Report Survey SS
Following slides demonstrates sample questionnaire for hotel feedback which can be used by hotel managers to determine customer service improvement areas. It includes key elements such as purpose of hotel trip, check in experience, satisfaction with hotel cleanliness, and staff behaviour. Pitch your topic with ease and precision using this Sample Restaurant Survey Feedback Example Questionnaire Result Report Survey SS. This layout presents information on Maintenance, Staff Hospitality, Cleanliness Services . It is also available for immediate download and adjustment. So, changes can be made in the color, design, graphics or any other component to create a unique layout.
-
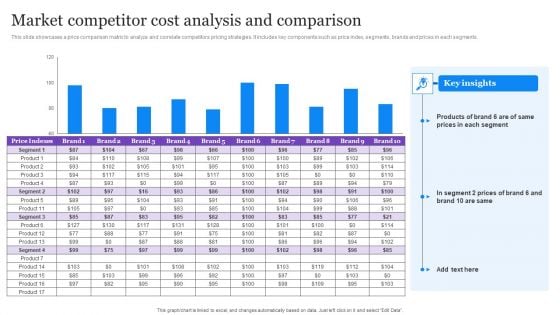
Market Competitor Cost Analysis And Comparison Demonstration PDF
This slide showcases a price comparison matrix to analyze and correlate competitors pricing strategies. It includes key components such as price index, segments, brands and prices in each segments. Showcasing this set of slides titled Market Competitor Cost Analysis And Comparison Demonstration PDF. The topics addressed in these templates are Market Competitor, Cost Analysis And Comparison. All the content presented in this PPT design is completely editable. Download it and make adjustments in color, background, font etc. as per your unique business setting.
-
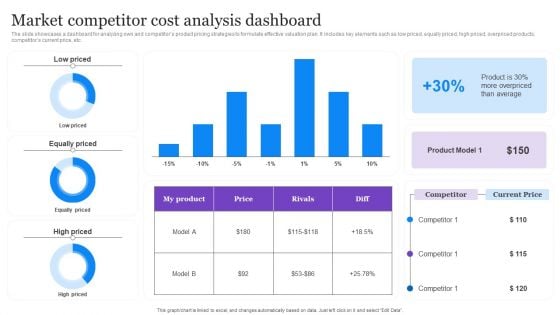
Market Competitor Cost Analysis Dashboard Graphics PDF
The slide showcases a dashboard for analyzing own and competitors product pricing strategies to formulate effective valuation plan. It includes key elements such as low priced, equally priced, high priced, overpriced products, competitors current price, etc. Pitch your topic with ease and precision using this Market Competitor Cost Analysis Dashboard Graphics PDF. This layout presents information on Average, Product Model, Cost Analysis Dashboard. It is also available for immediate download and adjustment. So, changes can be made in the color, design, graphics or any other component to create a unique layout.
-
Improvement Of Safety Performance At Construction Site Kpi Dashboard To Track Safety Program Microsoft PDF
This slide reflects the key performance indicator dashboard to track the performance of safety program. It includes information regarding the total manpower, manhours, unsafe conditions, lost time injuries frequency, injuries severity rate, along with the training hours. Make sure to capture your audiences attention in your business displays with our gratis customizable Improvement Of Safety Performance At Construction Site Kpi Dashboard To Track Safety Program Microsoft PDF. These are great for business strategies, office conferences, capital raising or task suggestions. If you desire to acquire more customers for your tech business and ensure they stay satisfied, create your own sales presentation with these plain slides.
-
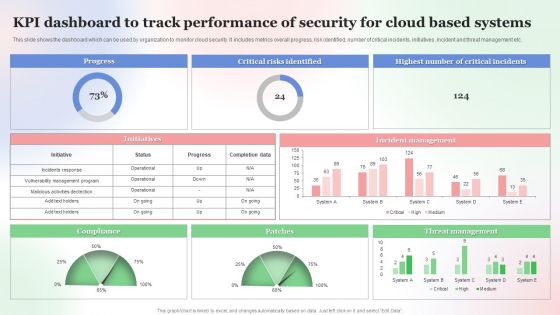
KPI Dashboard To Track Performance Of Security For Cloud Based Systems Clipart PDF
This slide shows the dashboard which can be used by organization to monitor cloud security. It includes metrics overall progress, risk identified, number of critical incidents, initiatives, incident and threat management etc. Showcasing this set of slides titled KPI Dashboard To Track Performance Of Security For Cloud Based Systems Clipart PDF. The topics addressed in these templates are Kpi Dashboard To Track, Performance Of Security, Cloud Based Systems . All the content presented in this PPT design is completely editable. Download it and make adjustments in color, background, font etc. as per your unique business setting.
-
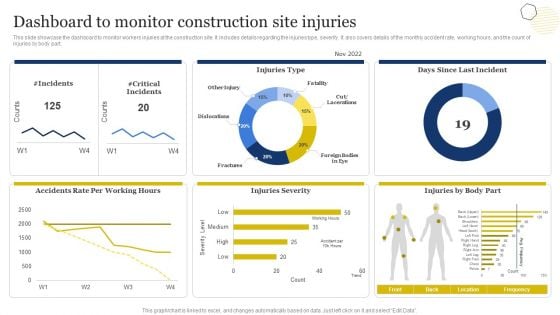
Improvement Of Safety Performance At Construction Site Dashboard To Monitor Construction Mockup PDF
This slide showcase the dashboard to monitor workers injuries at the construction site. It includes details regarding the injuries type, severity. It also covers details of the monthly accident rate, working hours, and the count of injuries by body part. Do you have an important presentation coming up Are you looking for something that will make your presentation stand out from the rest Look no further than Improvement Of Safety Performance At Construction Site Dashboard To Monitor Construction Mockup PDF. With our professional designs, you can trust that your presentation will pop and make delivering it a smooth process. And with Slidegeeks, you can trust that your presentation will be unique and memorable. So why wait Grab Improvement Of Safety Performance At Construction Site Dashboard To Monitor Construction Mockup PDF today and make your presentation stand out from the rest

 Home
Home 


